Akio FUJIMURA
1, Masanao ABE
2, 1, *Toru YADA
1, 2,
Tomoki NAKAMURA
3, Takaaki NOGUCHI
4, Ryuji OKAZAKI
5, Keisuke NAGAO
6, Hiroshi NARAOKA
5, Yukihiro ISHIBASHI
1,
Kei SHIRAI
2, Michael E. ZOLENSKY
7, Scott SANDFORD
8, Tatsuaki OKADA
2, 1, Masayuki UESUGI
1, Yuzuru KAROUJI
1,
Maho OGAWA
9, Shogo YAKAME
9, Munetaka UENO
2, Toshifumi MUKAI
10, Makoto YOSHIKAWA
2, 1and Junichiro KAWAGUCHI
11JAXA’s Space Exploration Center, Japan Aerospace Exploration Agency, 3-1-1, Yoshinodai, Chuo-ku, Sagamihara, Kanagawa 252-5210, JAPAN.
2Institute of Space and Astronautical Science, Japan Aerospace Exploration Agency, 3-1-1, Yoshinodai, Chuo-ku, Sagamihara, Kanagawa 252-5210, JAPAN.
3Department of Earth and Planetary Material Sciences, Graduate School of Science, Tohoku University, Aoba, Sendai, Miyagi 980-8578, JAPAN.
4College of Science, Ibaraki University, 2-1-1 Bunkyo, Mito, Ibaraki 310-8512, JAPAN.
5Department of Earth and Planetary Science, Graduate School of Science, Kyushu University, Hakozaki, Fukuoka 812-8581, JAPAN.
6Geochemical Research Center, Graduate School of Science, The University of Tokyo, 7-3-1 Hongo, Bunkyo-ku, Tokyo 113-0033, JAPAN.
7ARES, NASA Johnson Space Center, Houston, TX 77058, USA.
8NASA Ames Research Center, Moffett Field, CA 94035, USA.
9Department of Earth and Planetary Science, Graduate School of Science, University of Tokyo, 7-3-1 Hongo, Bunkyo-ku, Tokyo 113-0033, JAPAN.
10Japan Aerospace Exploration Agency, 3-1-1, Yoshinodai, Chuo-ku, Sagamihara, Kanagawa 252-5210, JAPAN.
*Corresponding author: e-mail: [email protected]
Keywords: Hayabusa, Itokawa, curation, asteroid, sample return mission,
Abstract: The Planetary Material Sample Curation Facility of JAXA (PMSCF/JAXA) was established in Sagamihara, Kanagawa, Japan in order to curate planetary material samples returned from space in conditions of minimum terrestrial contaminants. The performances for the curation of Hayabusa returned samples had been checked with a series of comprehensive tests and rehearsals. After the Hayabusa spacecraft had accomplished a round flight to asteroid 25143 Itokawa and returned its reentry capsule to the Earth in June 2010, the reentry capsule was brought back to the PMSCF/JAXA and was experienced in a series of processes to be extracted recovered samples from Itokawa. The particles recovered from the sample catcher were analyzed by electron microscope, given their ID, grouped into four categories, and preserved in dimples on quartz slide glasses. Some fraction of them has been distributed for initial analyses, NASA and will be for international announcement of opportunity (A/O), but certain fraction of them will be preserved in vacuum for future analyses.
Note: This technical report is written based on the paper to be published in the journal Meteoritics and Planetary Science by Wiley-Blackwell. Thus some parts of sentences and figures in this report are almost identical to those of the paper.
INTRODUCTION
Sample return missions recovering samples from other extraterrestrial bodies have brought us great progresses in understanding their origin, formation and evolution processes. The Apollo missions, accomplished six successful landings on the Lunar nearside and recover samples there, brought back about 382 kilograms of lunar samples.
In order to curate the returned lunar samples with lesser terrestrial contamination, the Apollo mission had prepared the Lunar Receiving Laboratory (LRL) in Johnson Space Center (JSC) of NASA to treat the lunar samples in glove boxes (Allton et al., 1998).
Almost forty years after the Apollo mission, the Stardust spacecraft successfully returned samples captured nearby comet Wild 2 (Brownlee et al., 2008). They prepared a special clean room to curate the Stardust samples under clean condition (Zolensky et al., 2008). The Stardust clean room is a higher cleanliness level than that the LRL, but it does not contain a glove box to treat the samples in nitrogen condition, as the LRL did.
A sample return mission from an asteroid was first planned in 1985 in Japan.
It was accepted as a mission named MUSES-C in 1996. Scientific objectives of MUSES-C spacecraft were to obtain a surface topography, near infrared (IR) spectra, X-ray fluorescence spectra of a target asteroid and to try capturing samples on its surface to return the recovered samples to the Earth. Its target asteroid had been changed from 4660 Nereus, to 10302 1989ML, and finally to 25143 1998SF36, named Itokawa later. Visible and near infrared spectroscopic measurements revealed that the 25143 Itokawa belonged to an S (IV) type asteroid, mainly composed of olivine/pyroxene (Binzel et al., 2001; Dermawan et al., 2002). The spacecraft was launched on 9 May 2003, and traveled to Itokawa to reach at an altitude of about 20 km (Gate position) of the asteroid in September 2005 (Fujiwara et al., 2006).
Observational results from a near-infrared spectrometer and an X-ray fluorescence spectrometer on Hayabusa indicated that asteroid Itokawa was mainly composed of olivine and related to ordinary chondrites, LL5-6 (Abe et al., 2006; Okada et al., 2006).
After remote sensing analyses around Itokawa for about two months, Hayabusa carried out touchdowns twice onto the surface of MUSES-C Regio for sample collections on 20 and 26 November 2005 (Yano et al., 2006). It returned to the Earth to release its reentry capsule on 13 June 2010, after a long round trip from Itokawa (Abe et al., 2011).
A basic concept for Hayabusa return sample curation was planned before its launch, but it had been reconsidered by an advisory committee for specifications of a Planetary Material Sample Curation Facility of JAXA between Dec. 2005 and Feb.
2007. Detail specifications of the facility and clean chambers and instruments installed in the facility was considered in parallel, and the facility had finished in March 2008. In the followings, we describe details of the facility and curation of the Hayabusa return samples.
SPECIFICATIONS OF THE PLANETARY MATERIAL SAMPLE CURATION FACILITY OF JAXA.
The concept of sample condition controls of Hayabusa mission
Chemical and physical conditions of returned samples are affected by gas, liquid and solid terrestrial contamination on the ground before launch and after atmospheric reentry, as well as temperature, magnetic, electric condition, shock pressure and acceleration they would experience in space and during atmospheric entry. For solid contamination, material constituents of a sample container of Hayabusa were limited to aluminum alloy (A6061 in Japanese Industrial Standards (JIS) code) coated with pure aluminum, stainless steel (SUS304 in JIS code), Viton®, Al2O3 glass and Teflon coated onto the aluminum surface. Before launch, every part of the sample container was cleaned in 2-propanol using an ultrasonic cleaner, installed in a class 10,000 clean room in Fed. Std. 209D. A contamination coupon made of Al2O3 glass was set inside a sample catcher during the final assemblage for flight model of the spacecraft, thus contamination after that point has been monitored with the coupon.
We designed the PMSCF/JAXA to minimize contaminations from natural detritus, artificial particles containing especially boron, rare earth elements (REEs) and lead, for analyses of returned samples from Itokawa. Terrestrial gas and liquid contamination on the samples might have happened after the touchdown sampling. Thus the sample container was designed to seal the samples after the sampling as described later. The rock samples and gases possibly released from them were expected to have maintained their original conditions in the container. After returning to the Earth, terrestrial atmosphere however could be permeable through the double O-rings seal. The pressure increase due to gas permeating through the double O-rings seal is estimated to be less than 1Pa for 100 hours after the reentry. The temperature condition of the returned samples was managed to be kept as low as possible. It should have been less than 0˚C during the returning trip in interplanetary space. During atmospheric entry, the sample container is designed to be preserved under 80˚C within the reentry capsule protected by its ablators made of carbon fiber reinforced plastic (CFRP). The thermal
condition after the recovery on the Australian dessert until introduction to the PMSCF/JAXA was monitored with a temperature logger attached to a transportation box for the reentry capsule. The data of the logger showed that the sample container had been kept under 30˚C. The PMSCF/JAXA clean rooms are kept less than 26˚C.
The magnetic condition of Hayabusa returned samples should have been disturbed during a return trip to the Earth due to ion engine operation which is one of propulsion systems on Hayabusa, because the microwave ionization system of the ion engine causes strong magnetism. Among those conditions, electric disturbance and shock from atmospheric entry, landing and transportation had not been monitored during the processes in this mission because their effects on the samples are considered to be minor.
Hereafter we detail the curation facility and clean chambers, in which the Hayabusa samples were treated.
Clean rooms
We designed the Planetary Material Sample Curation Facility (PMSCF) to diminish
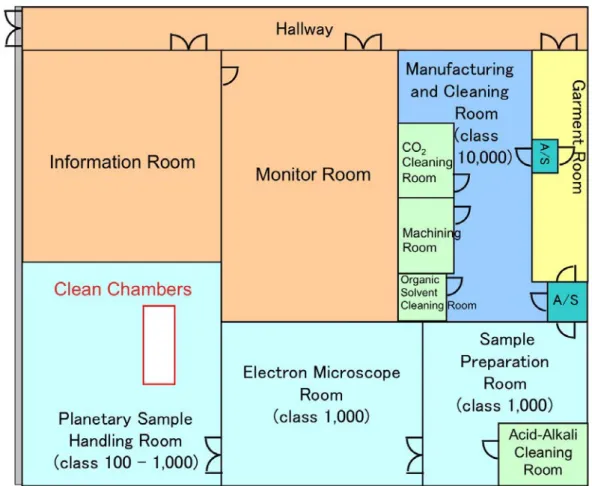
Fig. 1. A schematic viewgraph of cleanrooms of the Planetary Material Sample Curation Facility (PMSCF) of JAXA. They consist of four cleanrooms, the Planetary Sample handling room, the Electron microscope room, the Sample preparation room and the Manufacturing and cleaning room.
terrestrial contaminants from its environment. It equips four clean rooms, the Planetary sample handling room, the Electron microscope room, the Sample preparation room and the Manufacturing and cleaning room (Fig. 1). The clean class level of the room is 100 - 1,000 in Fed. Std. 209D for the Planetary sample handling room, 1,000 for Electron microscope room and Sample preparation room, and 10,000 for the Manufacturing and cleaning room. Because of necessity for cleaning using organic solvent, acid and alkali and instruments which would give off contaminant, four independent air exhaust rooms are equipped in the clean rooms, the Acid and alkali treatment room, the Organic solvent cleaning room, the Machining room and the CO2
cleaning room. Equipment which cannot be set in the clean rooms, such as roughing pumps and nitrogen purifiers, are also set in the Basement.
Clean chambers
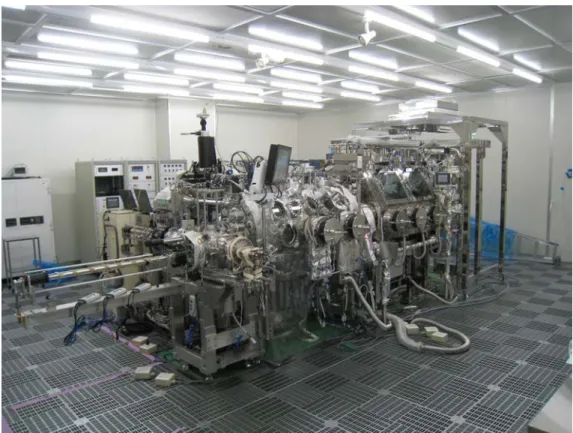
The basic concept for solid and gas contamination control was that the sample should be exposed to the lowest particle level in vacuum or nitrogen condition. Thus we prepared two clean chambers, No.1 and No. 2, in the Sample handling room of the PMSCF/JAXA (Fig. 2). They are mainly made of stainless steel (SUS304 in JIS code), and their inside walls are treated by the method of electrochemical polishing. They were baked in vacuum more than 120˚C before and after the installation to lessen contaminant gas absorbed on them. Environment from the ultrahigh vacuum to atmospheric pressure of purified nitrogen condition can be realized in the chamber No.1, in which the sample capsule of Hayabusa was opened. For opening the sample container in the clean chamber No.1, a container opening system is equipped to the clean chamber No.1. It is composed of four movable shafts which can be connected with an inner lid of the container, touch-type displacement sensors and laser displacement sensors to monitor the movement of the shafts and load cells to monitor the stress on them. Residual gas in the container can be collected in residual gas sampling bottles made of stainless steel which are equipped with an introduction line to the clean chamber No.1. A lower part of the sample container will be stored in vacuum condition of cabinet No.1 attached to the chamber No.1. For the transportation of the sample container, a transportation chamber is equipped between the chamber No.1 and cabinet No.1. It has two magnet coupling transfer rods by which the container can be transported from the chamber No.1 to the cabinet No.1 via the transportation chamber both in vacuum and atmospheric pressure nitrogen conditions. The chamber No.1 also has two Viton® gloves equipped with gate valves so that we can handle the sample container and catcher with tools and jigs.
The sample catcher will be sent to the clean chamber No.2 for further handling such as recovery of solid sample grains from the catcher and treated them samples for further sample analysis. An ultra long work distance optical microscope is prepared to be capable to be adjusted to both glass viewports of the clean chamber No.1 and glass windows of the clean chamber No.2. The samples can be handled in an atmospheric pressure condition of purified nitrogen with special tools and jigs in the clean chamber No.2 which is equipped with six Viton® gloves. And samples once cataloged will be stored in vacuum of cabinet No.2 or 3 attached to the chamber No.2. Both the chamber No.1 and No.2 equip ultraviolet (UV) neutralization apparatuses in order to compensate electrostatic charge which should occur in the pure nitrogen condition.
Also, an alpha-ray neutralizer of 210Po radioactive source is prepared for the same purpose.
Fig. 2. A photograph of clean chambers in the Planetary Material Sample Curation Facility (PMSCF) of JAXA. They consist of two main chambers, No.1 (left) and No.2 (right) and situate in the planetary sample handling room of 100 – 1,000 in clean class level of Fed. Std. 209D.
Other equipment Electron microscope
A field-emission type scanning electron microscope (FESEM), Hitachi S-4300SE/N, equipped with energy dispersive X-ray spectrometer (EDS), Oxford Instruments INCA X-act Energy 350, is installed in the electron microscope room. It is prepared for initial description of planetary material samples, and equips low vacuum observation mode for observing insulators such as silicate without conductive coating.
We also prepared a custom-made sample holder which is basically made of cupper coated by gold and has a cap with a Viton® O-ring to seal samples inside from terrestrial atmosphere. With this holder and an airlock of the FESEM which equips a mechanism to open its cap, we can transfer samples from the clean chamber to the FESEM without exposing to terrestrial atmosphere. There situated another glove box in the electron microscope room. It has two Viton® gloves for handling and an air lock to introduce tools and jigs without breaking the environment inside the box. It can be vacuumed to be exchanged with nitrogen, also flow nitrogen gas and control its inner pressure not only positive to the cleanroom air but also negative to the air.
Instruments for cleaning and checking cleanliness
To keep cleanliness of the clean chamber, a series of cleaning instruments are prepared for cleaning tools, containers and jigs used in the clean chamber. Four ultra sonic cleaners of 38kHz, 35kHz and 95kHz, 100kHz, and 950kHz in frequency are set in the manufacturing and cleaning room and the sample preparation room. They are capable to perform overflow cleaning with ultra pure water supply system in the rooms.
In order to perform acid and base treatment cleanly, a clean evaporator is installed in the acid and base cleaning room. It consists of two chambers made of polyvinyl chloride equipped with seat heaters covered by PTFT and an independent intake and exhaust fan system with a series of filters for ambient air intake and a water scrubber for the exhaust line. We also prepared an atmospheric-pressure plasma cleaner and a CO2 blast cleaner to remove particles and organics on surfaces of materials, and an UV ozone cleaner to sterilize bacteria and remove organics on materials’ surfaces.
In order to check the environment of the clean chambers and attached chambers with them, two types of mass spectrometers are set near by the clean chambers. One is an atmospheric pressure ionization mass spectrometer (API-MS) and the other is a differential pumping quadrupole mass spectrometer (Q-MS). The former is suitable
for analyze impurities in nitrogen gas less than sub-ppm, and the latter is capable to analyze impurities more than sub-ppm. A Fourier transform infrared spectroscopy (FT-IR) and a dynamic contact angle meter are prepared to check cleanliness of surfaces of materials.
Electrostatically controlled micromanipulation system
We prepared three commercial base micromanipulator systems operated in clean rooms and two specially designed micromanipulator systems operated in an ultra pure nitrogen environment of the clean chamber and one system operated in a low vacuum nitrogen condition of FESEM sample room for handling the minute particle one by one. Most of the systems are operated manually and have special designed quartz glass probe with electrode that lifts or releases a particle by electrostatic force. Two of the three commercial base micromanipulators are operated in an atmospheric condition.
Another one commercial base micromanipulator system is attached on a microscope with long work distance objective lenses and operated mainly in a glove box filled with highly purified ultra pure nitrogen. For the use in a clean chamber filled with the ultra pure nitrogen, two specially designed micromanipulator systems are prepared. One system is a principal device for handling and consists of single sample stage and dual probe stages. The other system enables us to move a particle and release it on the bottom of small quartz bottle that is one type of sample transfer vessel, and it prevents farther alterations when the mouth of the bottle is welded by a quartz plug in the clean chamber. These two systems are of oil free for the operation in the clean chamber.
The last one system is installed in sample room of FE-SEM, which is filled with low vacuum clean nitrogen due to prevent metalize sample surface for discharge. In the FE-SEM, particles on a specially designed sample holder can be lifted and released by the micromanipulator system. This manipulator is not operated manually, but it has two axes (x and y) PC control piezoelectric elements which hold probes each other.
All micromanipulator devices possess newly developed quartz glass probe. The probe has a platinum electrode that takes control of sample particle by electro-static force. The probe works as lift tool or release tool when the polarity and voltage of the electrode is changed. The electro-static control method is reasonable, because the electro-static force acting on a particle is essential and gravity force is not effective when particles are small, i.e., less than several tens micrometer. The shape and tip length of the quartz probe vary widely for the actual purposes. Though the electro-static control method is easily realized on the system with metal needle probes, we did not use
metal probes basically. If the metal needle probe touches the other metal probe or metal base with different electric potential, accidental spark will take place and sample particle lifted by the probe will be melted or lost.
In case of very tiny sample particles, visual confirmation is difficult by an optical microscope, and more precise technique such as SEM observation will be required. In the sample room of our FE-SEM, the particles often became stuck the surface of spatula that collects particles from sample container. The metal needle is useful to dig the particles from the surface of the spatula, because it is not break, and because quartz glass probe is easy to brake. We prepare tantalum needle, since the tantalum is a selected material for the projectile of sample collector of Hayabusa spacecraft.
The present tiny sample requires high cleanliness, and chemically clean quartz glass probe is convenient. The conventional borosilicate glass and metal, such as tungsten needle, were not employed because of their pollution source. The electrostatic controlling method developed at present, has remarkable advantages for handling tiny particles. The method provides adequate force for handling every sample particle. As a result, the present returned samples preserve their loose structural character realized at the surface of the asteroid Itokawa, and avoid chemical pollution coupled with cleanliness of quartz glass probe. The electrostatic controlling method produces a potential contamination of the magnetic and electric properties for the virginal asteroid sample. Unfortunately, however, propelling power of Hayabusa spacecraft is provided by ion engines that require large electric current, sample particles in a sample container were affected by this electric current in the spacecraft to a greater or lesser degree.
PERFORMANCE CHECK OF THE CURATION FACILITY Cleanliness of clean rooms
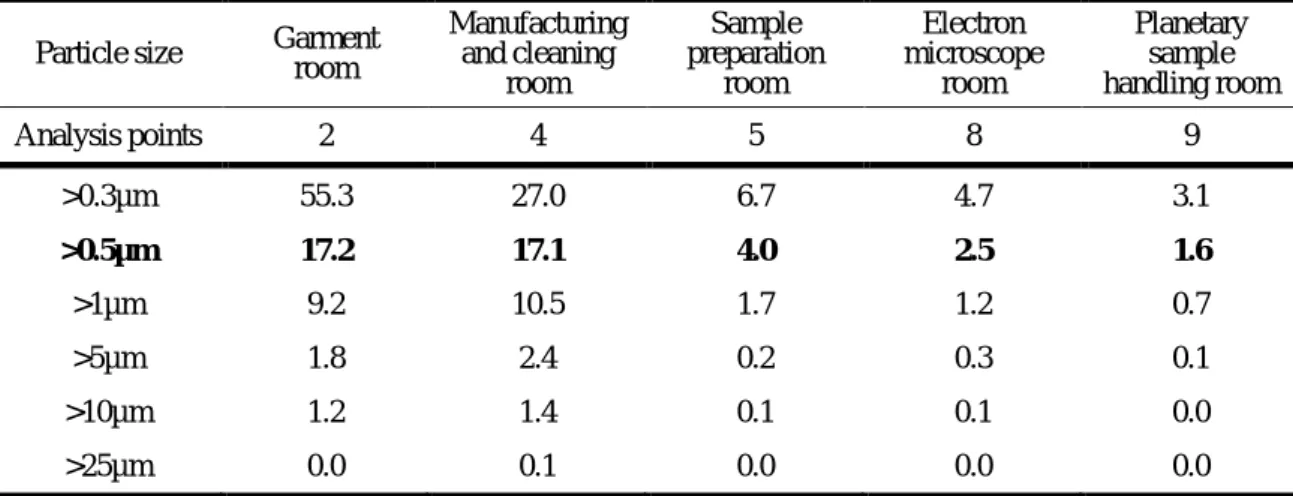
Particle cleanliness levels of the clean rooms were investigated after finishing their constructions on April 11, 2008. A following table is the results of the analyses of cleanliness for each cleanrooms. The data were acquired by a particle counter PMS LASAIR II 310A. The air suction rate of the analyses was 28.3L/min (1 ft3/min).
The cleanliness was analyzed at multiple points for each cleanroom in accordance with its area, and analyzed three times at each point. The unit is N/cf3 and the particle number of >0.5µm corresponds to the cleanliness level in Fed. Std. 209D. This table shows that the actual cleanliness level for each cleanroom is much smaller than its
specification.
Table 1. Results of analyses of particle cleanliness level of each cleanrooms of the facility (unit: N/cf3).
Particle size Garment room
Manufacturing and cleaning
room
Sample preparation
room
Electron microscope
room
Planetary sample handling room
Analysis points 2 4 5 8 9
>0.3µm 55.3 27.0 6.7 4.7 3.1
>0.5µm 17.2 17.1 4.0 2.5 1.6
>1µm 9.2 10.5 1.7 1.2 0.7
>5µm 1.8 2.4 0.2 0.3 0.1
>10µm 1.2 1.4 0.1 0.1 0.0
>25µm 0.0 0.1 0.0 0.0 0.0
Cleanliness of clean chambers
The source of the nitrogen gas supplying to the clean chambers is liquid nitrogen whose concentrations of the heavy noble gases are less than 0.1% of terrestrial atmosphere. The vaporized nitrogen gas is purified by two types of gas purifiers.
The first is a flow type and the second is a cyclic type. The nitrogen gas purified by the flow type purifier is introduced to the cyclic gas purifiers directly linked to the clean chambers.
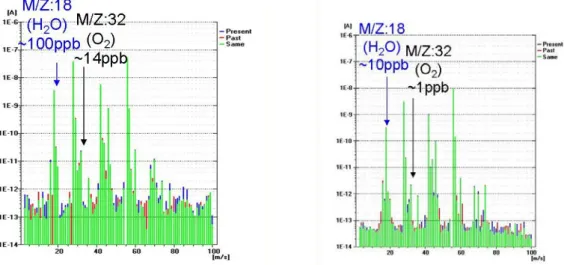
The mass spectrum of the nitrogen processed by the flow type purifier is obtained the API-MS (Fig. 3). The major impurities detected in the purified nitrogen gas are ~1 ppb of water and 0.2 ppb of oxygen. The other candidate impurities are under detection limits of CH4 and CO2, less than 50 ppt.
The baking process under the vacuum condition is the most effective clean up procedure for the clean chambers, which has been already cleaned in particle level.
We performed the baking at about 120 ˚C for three days, by using 37 heaters and temperature monitor of 48 points for the clean chamber 1, and 6 heaters and temperature monitor of 25 points for the clean chamber No.2.
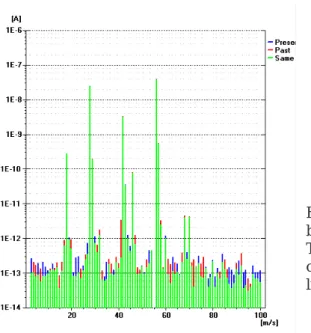
After the baking, the vacuum condition of the chamber No.1 reaches to 7.20x10⁻⁸Pa. The residual gas components measured by the residual gas analyzer of Q-MS (RGA-QMS) are lower than the detection limit of the RGA-QMS (i.e., lower than 1.0 x10⁻¹⁴A) except mass number 1(H), 2(H2), 14(N). The observed spectrum is shown in Fig. 4. The vacuum condition of the chamber No.2 reaches to 3.16 x10⁻⁶Pa that reflects the lower performance of the vacuum condition including the sealing Fig. 4. RGA-QMS spectra obtained in the chamber No.1. Their vertical axes are electric currents and horizontal axes mass numbers (m/z).
Left: Obtained at the vacuum condition of 7.68x10⁻⁶ Pa realized before baking.
Right: Obtained at the vacuum condition of 7.20x10⁻⁸ Pa realized after baking. The elements of m/z=1,2,and 14 are identified. The other elements are not detected, because no apparent mass peak of larger than 1x10-14 A can be recognized.
Fig. 3. Electric current vs. m/z relation obtained by API-MS.
The spectrum shows ~ 1 ppb of water, 0.2 ppb of oxygen, and CH4 and CO2 of lower than detection limit, less than 50 ppt.
Viton® gaskets of several components of the chamber and low performance of the vacuum pump attached to it. The lower vacuum performance of the chamber 2 is expected because the chamber is designed for the operation under the atmospheric pressure of nitrogen.
The cleanliness of the chamber No. 2 is examined by the API-MS. The major impurity gas components are of ~1ppb of oxygen and ~14ppb of water in the second room fulfilled by the purified nitrogen supplied by the cyclic gas purifier. Both concentrations of the impurities are less than the nominal specification of the cyclic gas purifier, which are 20 ppb of oxygen and also 20 ppb of water. The mass spectrum obtained by the API-MS is shown in figure 5
The time dependence of the vacuum deterioration was measured on the chamber No.1 and No.2 (Fig. 5). The vacuum condition under the pressure of 1x10⁻⁵ Pa was realized during 15 minutes in the chamber No.1 at the condition of stopping the e, and under the pressure of 1x10⁻⁴Pa in the chamber No.2. The result of the chamber No.1 is explained by the outgas rate of 7x10⁻⁹ Pa・m3/s/m2, which is consistent to the outgas rate of the completely baked and electrically etched clean surface of stainless steel (SUS316L in JIS code) wall of the chamber No.1. The result of the second room is explained by 1x10⁻⁷ Pa・m3/s/m2, which can be interpreted by the outgas rate of baked Viton® elastomer and of baked metal surface wall of the chamber No.2. The chamber No.2 is a glove box and possesses three sets of Viton® gloves and several Viton®
O-ring seals. Around half of the outgas may be due to this baked Viton® elastomer
Fig. 5 API-MS spectra obtained in the clean chamber No.2. Their vertical axes are electric current and horizontal mass number (m/z). Left: ~100 ppb of water and ~14 ppb of oxygen are detected in atmospheric pressure nitrogen of the chamber No.2 (before baking). Right: Detected water content is ~10 ppb and oxygen is ~1 ppb in the atmospheric pressure nitrogen of the chamber No.2 (after baking). The vacuum condition of 3.16 x10⁻⁶ Pa is achieved just after baking.
and the other half may be caused by the outgas rate of the completely baked and electrically etched clean surface of the stainless steel (SUS304 in JIS code) wall of the chamber No.2.
As the results of the baking, the cleanliness of the chamber No.2 has been improved. The observed impurity components in nitrogen gas of the chamber No.2 supplied by the cyclic gas purifier are 9 ppb of water, 1 ppb of oxygen, 2 ppb of CH4, and 4 ppb of CO2. After the 4 hours interval of supply stop of the purified nitrogen gas, the major impurity components are about 90 ppb of water and about 30 ppb of oxygen in the chamber No.2.
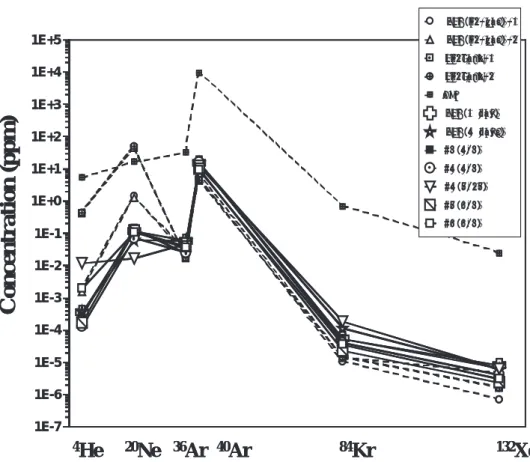
Noble gas abundances in high purity nitrogen gas used in the curation facility Pure nitrogen gas is preferable for use of atmosphere in the chambers No.1 and No.2 to prevent weathering and oxidation of samples by terrestrial water vapor and oxygen. Moreover, low concentrations of noble gases in the nitrogen gas are favorable because the high concentrations of noble gases in terrestrial atmosphere are the most serious source of noble gas contamination to extraterrestrial samples such as meteorites and interplanetary dust particles. We searched nitrogen gas with low concentrations of noble gases. Concentrations of noble gases in nitrogen gas evaporated from liquid nitrogen produced by the Taiyo Nippon Sanso Corporation are plotted in Fig. 6. The nitrogen gas was sampled from headspaces of tanks for storage of liquid nitrogen in the company: ELF is a small tank of 175L but liquid nitrogen (LN2) Tank is a large one in which liquid nitrogen produced in the company is stored. Noble gases were measured with a modified-VG5400 (MS-III) at the Geochemical Research Center, University of Tokyo. Concentrations of Ar, Kr, and Xe from both tanks are almost the same among them, and 3 to 5 orders of magnitude lower than those in atmosphere. In contrast to the heavier noble gases, He and Ne concentrations in both tanks are different among them. Concentration of He in the LN2 Tank is not so depleted, about 1/10 of atmospheric one, while that of Ne is higher than the atmospheric value. The concentrations in ELF are low compared with those of LN2 Tank. The relative enrichments in He and Ne might be due to accumulation of those gases in the headspace of tanks, because He and Ne would be partitioned in gas phase while Ar-Xe be in liquid at the liquid nitrogen temperature. If this is the case for He and Ne, nitrogen gas with low concentrations of all noble gases will be available from the tank after purging of enough amount of nitrogen gas from the headspace.
The nitrogen gas is used in the curation chamber by supplying it from the headspace of ELF tanks set outside the curation building through a metal pipe line. To certify the purity of nitrogen in the curation chamber, nitrogen gas was sampled several times by using ultra-clean metal bottles connected to the curation chamber, and then transferred to University of Tokyo for noble gas analysis. The measured noble gas concentrations are depicted in Fig. 6. The lower concentrations of He and Ne compared with those in nitrogen gas collected from ELF and LN2 tanks in the company must be due to the purging of gas in headspace before supply to the curation chamber.
Heavy noble gases are also 4 orders of magnitude lower than those in atmosphere.
The low concentrations of noble gases would reduce atmospheric contamination to the Hayabusa samples.
Fig. 6. Noble gas concentrations in nitrogen gas evaporated from liquid nitrogen and accumulated in headspace of tanks for storage of liquid nitrogen. Noble gas concentrations in atmosphere are shown for comparison. Four samples, from ELF (nitrogen gas) to LN2Tank, were collected in metal bottles from an ELF tank and a large tank (LN2Tank) at the company (Taiyo Nippon Sanso Corporation) producing the liquid nitrogen. Seven samples, from ELF (1 day) to #6(6/3), were in the curation chamber, to which the nitrogen gas is supplied from ELF tanks after purging the headspace of ELF tanks.
1E-7 1E-6 1E-5 1E-4 1E-3 1E-2 1E-1 1E+0 1E+1 1E+2 1E+3 1E+4 1E+5
ELF(N2-gas)-1 ELF(N2-gas)-2 LN2Tank-1 LN2Tank-2 Air
ELF(1 day) ELF(4 days)
#3(4/3)
#4(4/3)
#4(5/25)
#5(6/3)
#6(6/3)
C onc ent ra tio n ( ppm )
4He 20Ne 36Ar 40Ar 84Kr 132Xe
1E-7 1E-6 1E-5 1E-4 1E-3 1E-2 1E-1 1E+0 1E+1 1E+2 1E+3 1E+4 1E+5
ELF(N2-gas)-1 ELF(N2-gas)-2 LN2Tank-1 LN2Tank-2 Air
ELF(1 day) ELF(4 days)
#3(4/3)
#4(4/3)
#4(5/25)
#5(6/3)
#6(6/3)
C onc ent ra tio n ( ppm )
4He 20Ne 36Ar 40Ar 84Kr 132Xe
Isotopic ratios of noble gases are close to those of atmospheric ones except for Ar isotopic ratios as shown in Fig. 7. The 38Ar/36Ar and 40Ar/36Ar ratios are as low as 0.175 and 255, respectively, and are plotted on a mass fractionation line passing the atmospheric Ar. The degree of fractionation is ca. 3.5 %/amu. The large mass fractionation effect on Ar isotopes may be attributable to co-evaporation of a small fraction of Ar with nitrogen gas from liquid nitrogen-oxygen mixture at the separation of nitrogen from oxygen. Because condensation temperature of Ar is close to those of nitrogen and oxygen, only Ar is affected by fractionation effect. In contrast to Ar, He and Ne are always as gas phase, while Kr and Xe are as liquid phase during the fractional evaporation process of liquid nitrogen-oxygen mixture.
A simple Layleigh distillation model indicates that a single step distillation causes only 1.3 %/amu of enrichments in lighter isotopes in distilled Ar phase, i.e., from
the atmospheric 40Ar/36Ar of 296 to ≈281. If 10-20 % of Ar is distributed in nitrogen gas while remaining Ar is in liquid oxygen during a single stage distillation of nitrogen, three steps of distillation can account for the observed 40Ar/36Ar of 255 in the nitrogen
250 260 270 280 290 300
0.170 0.175 0.180 0.185 0.190
ELF(N2-gas)-1 ELF(N2-gas)-2 LN2Tank-1 LN2Tank-2 air
38
Ar/
36Ar
40
Ar /
36Ar
Mas s fr act ionat ion
Air
Fig. 7. 40Ar/36Ar ratios in the nitrogen gases from the ELF and LN2 tanks, showing heavy mass fractionation from atmospheric value (296) favoring lighter isotopes by ca. 3.5 %/amu.
gas.
Viton® glove permeability to noble gas
Degassing rates of noble gases from a Viton® sheet and noble gas permeability through it were investigated. One side of the sheet was coated with Teflon. The Viton®
sheet was set to a window of vacuum chamber, and then gases from the sheet were accumulated to measure accumulation rates of noble gases. The accumulation was carried out in two cases; 1) both sides of the Viton® sheet were connected to the accumulation chamber, and 2) one side opposite to the gas accumulation was exposed to
atmosphere. Measured rates in cc/cm2/min are plotted in Fig. 8. The case 1) shows degassing rates from the Viton® sheet. It is shown that baking of the Viton® effectively reduces degassing rates. Moreover, different degassing rates from the Teflon coated side and non-coated one were not observed. In the case of 2), only He and Ne clearly increased, indicating permeation of He and Ne from atmosphere through the Viton®
sheet with a rate of ≤10-9 cc/cm2/min. Permeation of heavier noble gases (Ar, Kr, and Xe) seems to be much smaller than those of He and Ne. These results show that the Viton® glove can be safely used for the curation chamber if it is degassed by baking
Fig. 8. Increasing rates of noble gases in a vacuum chamber, in which a Viton® sheet was set. The increase is due to degassing of noble gases from the Viton® sheet or permeating atmospheric noble gases through the sheet. The Viton® sheet is used for gloves in the curation chamber.
0.0001 0.001 0.01 0.1 1 10
4He 20Ne 36Ar 40Ar 84Kr 132Xe
He, Ne, Ar (10-9cc/cm2/min), Kr, Xe (10-12cc/cm2/min) 100ºC 5h bake 100ºC 3h bake 100ºC 4h bake
Air on one side Air on one side
19 Nov. 19 Nov. 19 Nov. 20 Nov. 20 Nov. 23 Nov.
0.0001 0.001 0.01 0.1 1 10
4He 20Ne 36Ar 40Ar 84Kr 132Xe
He, Ne, Ar (10-9cc/cm2/min), Kr, Xe (10-12cc/cm2/min) 100ºC 5h bake 100ºC 3h bake 100ºC 4h bake
Air on one side Air on one side
0.0001 0.001 0.01 0.1 1 10
4He 20Ne 36Ar 40Ar 84Kr 132Xe
He, Ne, Ar (10-9cc/cm2/min), Kr, Xe (10-12cc/cm2/min) 100ºC 5h bake 100ºC 3h bake 100ºC 4h bake
Air on one side Air on one side
19 Nov. 19 Nov. 19 Nov. 20 Nov. 20 Nov. 23 Nov.
under vacuum condition.
Chemistries of the Viton® gloves for the clean chambers
As described before, the chamber No.1 and No.2 have two and six Viton®
gloves, respectively. The gloves are products of North® by Honeywell International Inc. They are mainly composed of Viton® elastomer, but they also contain some amounts of small talc particles to obtain more stable electrostatic condition in pure gas condition free from H2O. Before attached to the clean chambers, they had been washed by distilled water and baked in vacuo around 110 ˚C to decrease adsorbed H2O on their surfaces.
Viton® is stable in water and organic solvent, and the characteristics of the Viton® gloves used for the clean chambers were checked in Kyushu Univ. A small sheet of Viton® trimmed from the gloves was involved in dichloromethane, and the
Fig. 9. A GC-MS spectrum of dichloromethane with Viton® sheet trimmed from a Viton®
glove used for the clean chamber (upper) and that of dichloromethane blank (lower). There is no different peak in the Viton® spectrum from the blank.
sample solution was analyzed as same as a blank solution by gas chromatography mass spectrometer (GC-MS). An analytical procedure is detailed in Oba and Naraoka (2009). As shown in the analysis results (Fig. 9), there was no difference between the sample and blank, which means that no significant organic contamination other than Viton® itself should not occur from the Viton® gloves.
Cleanliness level accomplished by the cleaning methods in the facility
Every equipment used in the clean chamber is prepared after series of cleaning processes. Their procedures are distinguished based on composed materials. The most typical procedure is a series of ultra sonic cleanings (2-propanol at 40kHz band in frequency, then ultra pure water at 35, 95 and 950 kHz bands respectively in frequency) for all materials such as metals, glasses and Teflon, resistant to cleaning solvents and ultra sonic vibrations. For the quartz glass, an additional cleaning using acid and alkali is performed after the series of ultra sonic cleanings.
We checked the cleanness of the material after its cleanings. Contaminant particles on the material are checked with optical microscopic observations. Almost no contaminant particle larger than a few µm is found just after its cleaning. Such observations are also made with the cameras of the micromanipulation system in the
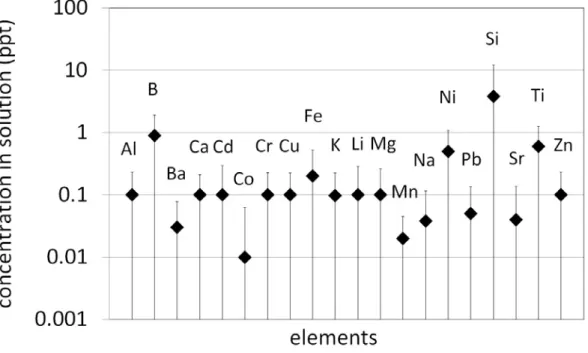
Fig. 10. The concentrations of metal ions in the decocted solution of test quartz pieces in ultrapure water, after acid and alkali cleanings. They are analyzed with ICP-MS. The concentration of 1 ppt in vertical axis corresponds that they are less than 10-12 g on 1 cm2 of glass plate.
clean chamber. SEM observation is also done for the sample holder for SEM. When contaminant particles are found on the holder, additional cleaning such as CO2 blast cleaning is performed to remove them.
Contaminant ions and organics such as machine oil, grease, and human sebum are checked by the other method. Their abundances are evaluated with the decocted solution of test quartz pieces in ultrapure water, after the acid and alkali cleaning. 20 of cations (Al, B, Ba, Ca, Cd, Co, Cr, Cu, Fe, K, Li, Mg, Mn, Na, Ni, Pb, Si, Sr, Ti and Zn) are analyzed with inductively coupled plasma mass spectrometry (ICP-MS) and atomic absorption spectrometry (AAS). Most of them are less than 1 ppt (Fig. 10), corresponding that they are less than 10-12 g on 1 cm2 of glass plate. 6 of anions (F, Cl, NO2, NO3, PO4, and SO4) are also evaluated with ion chromatography (IC). The result is shown in figure 12. PO4 is less than 1 ppb, but the other anions are around 10 to 20 ppb, corresponding that they are less than about 10-8 g on 1 cm2 of glass plate. Upper limit of total organic carbon (TOC) is ~36 ppb, based on the TOC meter analysis (Fig.
11).
Fig. 11. The amount of anions and organic carbon (TOC) in the decocted solution of test quartz pieces in ultrapure water, after the acid and alkali cleaning. They are analyzed with IC for anions and TOC meter for carbon. The amount of 1 ppt in vertical axis corresponds that they are less than 10-9 g on 1 cm2 of glass plate.
REHEARSAL OF ACCEPTANCE OF A REENTRY CAPSULE AND SAMPLE RECOVERY FROM A SAMPLE CONTAINER
Structures of the reentry capsule and the sample container of Hayabusa
The Hayabusa spacecraft equipped a reentry capsule in which sample recovered from Asteroid Itokawa had been enclosed. The capsule is saucer-shaped 30cm in width and 15cm in height. It is covered with front- and back-side ablators made of carbon fiber reinforced plastic (CFRP) to prevent the sample container, a parachute and related devices from atmospheric entry heating. The sample container is set in the center of the reentry capsule. Figure 12 shows the structure of the sample container. It shapes like up-side down silk hut and sizes 12cm in width 15cm in height.
It mainly consists of an outer lid equipped with latches, an inner lid, a frame for latches, a sample container and a sample catcher. They are mainly made of aluminum alloy (A6061 in JIS code) coated by pure aluminum, and surfaces of the parts which should cause frictions with other parts are coated with Teflon in order to obtain smooth movements, which is to treat the surface of aluminum alloy to be alumite and coat it with Teflon in order to obtain smooth movements (McMurtrey, 1985).
The initial position of the sample catcher together with the lids was on the top
Fig. 12. A schematic view of the sample container of Hayabusa. It mainly consists of an outer lid equipped with latches, an inner lid, a frame for latches, a non-explosive actuator and a sample catcher.
The sample catcher is divided into three rooms, room A, room B and a rotational cylinder.
of a sampler horn, and it was transferred from the initial position to the sample container set in the reentry capsule before the departure from Itokawa to the Earth in 2007. With this procedure, the sample container should have been sealed from the environment outside the container with double Viton® O-rings attached to the inner lid until the container was unclosed in the clean chamber No.1. The sample catcher is divided to three rooms, room A, B and a rotational cylinder (Fig. 12). Initial position of the rotational cylinder had been opened for the room B, and the first touchdown of the Hayabusa to the surface of Itokawa had been performed with this setting. Before the second touchdown, the part of rotational cylinder was rotated to open for the room A to capture particles with the second touchdown. After the second touchdown, the cylinder was rotated to close all the openings to both the room A and B.
We prepared a simulated model of the sample container for a series of processes of the rehearsal. In the followings, we describe the processes of the rehearsal held in the facility.
Rehearsal of a series of processes of the sample container in the facility
We had performed a series of rehearsal for the acceptance of the reentry capsule of Hayabusa, extraction of the sample container, opening of the container and recovery of samples from its sample catcher from April 2009 to March 2010, before Hayabusa reentry capsule return to the Earth in June 2010. A flowchart of the rehearsal is shown in Figure 13. Each step of the processes was repeatedly performed in the same setting as the real part until the technical problems were clarified.
Basically all the procedures of the rehearsal were described as procedure manuals for rehearsals, and they were revised after the rehearsals based on the results of the rehearsals to make up procedure manuals for real part of the Hayabusa sample return.
Fig. 13. A flowchart of the rehearsal for a series of processes from an acceptance of the reentry capsule of Hayabusa to a recovery of samples. It took around a year to perform each process of the rehearsal repeatedly.
23 Hayabusa Asteroid Sample catalogue 2011
X-ray computed tomography (CT)
The first step after the acceptance of the reentry capsule is an X-ray computed tomography (CT) imaging of whole the capsule. With this process, the condition of latches and seal of the container and the position of the rotational cylinder could be confirmed. After removal of the electronic box and ablators, the container would be examined with the X-ray CT again in order to confirm existence of samples inside the sample catcher. The X-ray CT used for the rehearsal and the actual Hayabusa returned capsule is Toshiba TOSCANER 24200RE, situated in Chofu Aerospace Center Aerodrome Branch of JAXA. We brought the simulated sample container in which San Carlos olivine grain of several mm and those particles and stainless steel spheres of 200-250 µm was preset and performed test investigations with the X-ray CT instrument.
Figs. 14 shows the X-ray CT images of the test investigations. These X-ray CT images indicate that conditions of latches and double Viton® O-rings could be confirmed with these images and silicate particles larger than 200 µm could be recognized with the image.
Fig. 14. X-ray CT images of the simulated sample container. (a) The X-ray CT image of the cross section of the inner lid with latches.
This image indicates that latches are open to hold the lid tightly to the frame. (b) That of the inner lid with the double Viton O-rings.
The O-rings look fixed to the trench of the inner lid to seal the container. (c) That of the bottom of the sample container. This image shows that preset San Carlos olivine particles and stainless steel spheres of 200-250 µm can be recognized with the X-ray CT.
(a) (b)
(c)
Removal of the ablators and cleaning the container and check the cleanliness
A back-side ablator could be removed only after machining to expose tops of eight screw bolts which connect the ablator with the outer lid of the container and unscrewing all the bolts. We had installed the milling machine in the manufacturing and cleaning room. With these tools, we performed a rehearsal of the milling work using a simulated ablator in April 2010, and succeeded in drilling to expose the top of the screw. For the machining at the real part, we prepared special jigs to sustain the container on the table of milling machine.
We had a rehearsal to clean the surface of the simulated container with dry wiping, wet wiping using ultra pure water and ethanol, dry ice blast cleaning and atmospheric pressure plasma cleaning. The surface of the container was wiped with special swabs for clean cleaning to be transferred to the quartz slide glasses, then checked their cleanliness by an optical stereomicroscope, the dynamic contact angle meter and the FT-IR.
Setting the sample container to the clean chamber No.1
We had a rehearsal to perform a series of processes before setting the sample container to the clean chamber No.1. At first, we removed the outer lid, the frame for latches, springs, a non-explosive actuator (NEA) and screw bolts which combine such parts together from the sample container. We prepared special jigs to remove such parts with keeping seal of the container (Fig. 15). After the removal of the parts mentioned above, we connected a joint jig on the inner lid in order to combine the inner lid to the shafts of the container opening system. Then the container was set to the container opening system, and the inner lid was fixed with the four shafts of the system in order to keep its seal. The seal condition of the container was checked with the custom-made container which had a vacuum flange and enabled us to check its vacuum condition through the flange. In the rehearsal, we confirmed that there was no leak during the series of processes.
Opening the sample container and recovering the residual gas
The inner pressure of the sample container of real part will be unknown, thus we have to estimate the pressure and adjust that of the clean chamber to the estimated pressure not to disturb samples in the container due to the gas flow from or to the container because of the difference of pressure between them. For convenience of multiple trials for the pressure estimation, we prepared a cover chamber which can be applied for the vacuum flange of the container opening system and can be set its condition from high vacuum to atmospheric pressure. We had changed both inner pressure of the container and the pressure of the cover flange, and monitored loads and displacements of the four shafts of the opening system.
Because the power to press the inner lid with the springs above is around 160kgf, we pressed 40kgf for each of the four shafts on the container opening system for an initial position of opening. After 150 µm displacement released from the initial position, the load at that position was analyzed. Because the difference of pressure between that in the container and that around it reacts loads on the four shafts which press the inner lid with double Viton® O-rings. Figure 16 is a diagram of external pressure for the container versus mean released load of the four shafts, plotting results
Fig. 15. A snapshot of a rehearsal for removal of the outer lid, the frame for latches and NEA from the sample container. The simulated container equips a vacuum flange, though which we could check the condition inside the container.
in inner pressure of the container ranged from <100 Pa to 105Pa in each of different settings. The lower the external pressure was, the lower the load was, because the pressure force on the inner lid decreases as the external pressure decreases.
Additionally, the load on the inner lid increased as the inner pressure of the container decreased in the same external pressure condition, because the inner pressure of the container reacts to decrease the load on the inner lid of the container. Although the reproducibility of the load in the same condition was not stable, it can be said that the difference of the inner pressure of around >5x10⁴ Pa could be distinguished from the difference of the load in the different external pressure. Also, the graph shows that the load obtained in the cover chamber were almost reproduced in the clean chamber No.1.
Just in case, we also performed the rehearsal of the opening container in conditions that the double Viton® O-ring should have harmed by accident or hardened due to severe conditions in interplanetary space during the round trip to the Earth. As a result, those differences of initial conditions did not seemed to make differences in values of loads from the case of Viton® O-rings in the normal condition.
As the container would be opened in the clean chamber No.1, residual gases which should be released from the container would be captured in gas cylinders for capturing residual gas which are connected to the clean chamber No.1. The gas cylinders have been baked >180 ºC to decrease the background interferences. The background interference of the baked gas cylinders were checked in the same noble gas mass spectrometer in the University of Tokyo as described above. They resulted in their background were good enough for the noble gas analyses.
Handling the sample container and the sample catcher to recover samples
In the rehearsal, we checked movements of the transfer rods of the transportation chamber next to the clean chamber No.1 to transfer the sample container from the sample opening system to the cabinet No.1 via the transportation chamber both in the atmospheric pressure nitrogen condition and the vacuum condition. In the
Fig. 16. Mean released load from four shafts after displacing 150 µm from the point initially loaded to 40kgf. Color of each symbol indicates a container inner pressure as follow: < 100 Pa [cyan], 104Pa [blue], 2x10⁴ Pa [magenta], 5x10⁴ Pa [green] and 105 Pa [red]. Symbols represent data acquired with apparatus conditions as follow: chamber No.1 [triangle], cover chamber with the sample container of normal O-rings [square], cover chamber with the sample container of purposely damaged O-rings [diamond] and that of baked [pentagram].
transportation chamber, we also check images inside the container though a glass viewport of the top of the chamber with the ultra-long working distance microscope which was set above the viewport. After the container transportation, the condition of the clean chamber No.1 was set to atmospheric pressure nitrogen, and the sample catcher together with the inner lid was transported with a special rod handled by two Viton® gloves and set to the a catcher handling jigs to introduce into a sample handling container. Then the inner lid was separated off from the sample catcher. Screw bolts to connect the inner lid and the sample catcher were locked by stainless steel wires, thus we cut and remove them from the bolts with a plier made of stainless steel before we unscrewed the bolts. With this procedure, we will get the first look of the catcher room A in real part, we therefore checked images of inside the room A though a glass viewport of the top of the chamber with the ultra-long working distance microscope which was set above the viewport. Then the sample catcher was enclosed into the sample catcher handling container, and sent to the clean chamber No.2 via a gate valve between the chamber No.1 and 2. In the chamber No.2, we had a rehearsal to scoop out samples inside the catcher to a petri dish made of synthetic quartz glass with a special spatula made of PTFE.
Handling test of simulated particles with the electrostatically controlled micromanipulator
In the rehearsal, we firstly tried to handle simulated particle (San Carlos olivine and synthetic nickel olivine of 30-500 µm is size) in the cleanroom air condition using a reflecting and polarizing microscope with an oil hydraulics micromanipulator setting a quartz glass probe with a platinum wire connected with a direct-current (DC) power source. The simulated particles were put on a quartz slide glass whose back side was coated by gold and connected to another DC power source. We tried to lift up the particles on the glass plate and release it on a different place of there. Although the largest nickel olivine of 500 µm cannot be handled, San Carlos olivine of 30-100 µm can be handled with the manipulator in the electronic condition between -12V and +16V DC for the probe voltage.
Next, we brought all the instruments above into the glove box in the electron microscope to have a rehearsal of manipulation in the same hardware setting with the first one in nitrogen condition. We could handle San Carlos olivine particles of 50-150 µm in the electric condition of ±50 ~ ±100V DC for the probe and ±30V DC. We also had a rehearsal in the same condition but the simulated samples were put on a PTFE plate with a stainless steel plate underneath. As a result, it was more difficult in
releasing the particle than lifting it up, maybe because of the difference of the material of the plate.
Finally, we had a rehearsal of the electrostatically controlled micromanipulation system in the clean chamber No.2. We used a quartz glass particle and a nickel olivine particle of 100 µm in size as simulated particles for handling.
They were put on a quartz slide glass, a quartz dish and an SEM holder made of cupper coated by gold. We could handle the particles in the electric condition of ±50 ~ ±100V DC for the probe voltage and 0 ~ ±30V DC for the stage. We also tried to handle the
nickel olivine particle inside the simulated sample catcher and confirmed to lift up and release the particle with the manipulator system (Fig. 17).
ACTUAL HAYABUSA CAPSULE PROCESS Processes before opening a sample container
On 13 June 2010, the reentry capsule of Hayabusa successfully landed in the Woomera Prohibited Area (WPA) of Australia and the recovered capsule and its heat
Fig. 17. An optical microscope image of a nickel olivine particle of >100 µm lifted up with a quartz glass probe of an electrostatically controlled micromanipulator system in the clean chamber No.2.
The background is a surface of inside wall of a simulated sample catcher.
shields arrived at the Planetary Material Sample Curation Facility of JAXA in Sagamihara, Japan on 18 June (Abe et al., 2011). The processes have been performed, following the flowchart of the rehearsal as shown previously (Fig. 13).
First, the transportation box was opened to extract reentry capsule sealed in plastic bag with nitrogen. The nitrogen gas filled in the bag was recovered in a glass cylinder just in case. After the container was back to the clean room in Sagamihara from the second X-ray CT, a thermosensor, which had been attached bellow the outer surface of the container’s flange, was removed with hand tools. Also, terrestrial dust and chips of the ablator which existed in the gap between the inner and outer lids and the container’s flange was cleaned up with a special vacuum cleaner. Then the outer surface of the container was cleaned with a series of processes described bellow. First, it was wiped with clean cloths wetted by isopropanol and ultra pure water. Second, the surface of the container was blown with a dry ice blast cleaner. Finally, its surface was cleaned with the atmospheric pressure plasma cleaner. For the confirmation of cleanliness of the surface of the container, it was checked via swabs for clean cleaning and/or clean slide glasses with an optical microscope, a dynamic contact angle meter and a Fourier transform infrared spectroscopy. All the three tests showed no sign of contamination. Next, the container was sent to class 1,000 clean room and fixed to the container opening jigs, which was designed to hold its inner lid keeping its seal and remove its frame for latches and its outer lid. After the series of processes related to the jigs, its inner lid was held with claw jigs, and the gap between the inner lid and the container’s flange was cleaned up with the special vacuum cleaner.
Subsequently, the container with the claw jigs was removed from the opening jigs and fixed to the container opening system. After its inner lid was held to the container’s flange with four shafts via a joint jig, the claw jigs was removed from the container’s flange. Then the container opening system with the container fixed joined the clean chamber No.1, in which ultra-pure nitrogen was continuously purged during the joint. All the process described above had been finished until June 20th. The environment of the clean chamber No.1 was purified with a circulated nitrogen purifier equipped with the chamber for an all night of June 20th.
Opening the sample container
Here we describe processes to estimate the pressure inside the container and set the pressure of the clean chamber No.1 close to that of the container as much as we could, in order to minimize a disturbance caused by gas flow between inside and outside the container.
The container opening system contains sets of load cells and displacement sensors for four axes. Rehearsals of the opening of the container had been performed with the opening system and an imitation container in a positive, negative or equal pressure inside the container compared to the outside, before the actual container return.
During the rehearsals, trend of data of the load cells and the displacement sensors had been recorded as shown in Fig. 18.
In the case of the actual returned container, the inner lid was pulled slightly with the sensors recorded on 21 June and the data was compared with the rehearsal data.
A comparison with the data obtained in rehearsals and those in the actual case indicates that the inner pressure of the container would be between vacuum and air pressure.
Based on this estimation, the pressure condition of the clean chamber No.1 was set to vacuum, not in a dynamic but a static condition.
Fig. 18. Correlation curves between displacements and load for the container opening system in <100Pa pressure of the clean chamber No.1. Red curves represent those obtained when the container was atmospheric pressure, and blue curves represent those obtained when it was vacuum in rehearsals. Black curves represent those obtained when the actual container of unknown inner pressure was slightly pulled for its lid.