Development of a web-based survey for
monitoring daily health and its application in an epidemiological survey
Abstract
Background: Early detection of symptoms arising from exposure to pathogens, harmful substances, or environmental changes requires timely intervention. The administration of web-based questionnaires is a potential method for collecting information from a sample population.
Objective: To develop a web-based daily questionnaire for health (WDQH) for symptomatic surveillance.
Methods: We adopted two different survey methods to develop the WDQH: an internet panel survey, which included subjects already registered with an internet survey
company, and the Tokyo Consumers’ Co-operative Union (TCCU) internet survey, in cooperation with the Japanese Consumers’ Co-operative Union, which recruited
participants by website advertising. The internet panel survey participants were given a fee everyday for answers, and the survey was repeated twice with modified surveys and collection methods; Internet Panel Survey I was conducted every day, and Internet Panel Survey II was conducted every 3 days to reduce costs. We examined whether the survey remained valid by reporting health conditions on day 1 over a 3-day period, and whether the response rate would vary among groups with different incentives. In the TCCU survey, participants were given a fee only for initial registering, and health information was provided in return for survey completion. The WDQH included the demographic details of participants and prompted subjects to answer questions about the presence of various symptoms by e-mail. Health information collected by the WDQH was then used for the syndromic surveillance of infection.
Results: Response rates averaged 47.3% for Internet Panel Survey I, 42.7% for Internet Panel Survey II, and 40.1% for the TCCU survey. During a seasonal influenza epidemic, a rapid increase in the number of patients with fever was reported by the WDQH using
the early aberration reporting system.
Conclusions: We developed a health observation method based on self-reporting by subjects via the internet. We validated the usefulness of the WDQH via its practical use in syndromic surveillance.
Keywords
web-based survey; syndromic surveillance; long-term operation
Introduction
The collection of health crisis information has been an important task in every country since the 2005 implementation of the World Health Organization International Health Regulations (WHO IHR 2005) to prevent the global spread of illness [1]. Early
detection of health events related to exposure to various pathogens, harmful substances, or environmental changes is indispensable for timely intervention in order to minimize health crises.
Syndromic surveillance is a method used to investigate epidemics of infections [2-5].
Unlike sentinel surveillance that uses a traditional definitive diagnosis and pathogen identification, this method encompasses the surveillance of symptoms. For example, this type of surveillance has been used at medical institutions to determine the number of patients with fever, cough, diarrhea, or vomiting, and changes in the number of absentees from school or the workplace, sales of commercial drugs, and prescriptions [6-8]. Syndromic surveillance is important as a means of information gathering during the early stages of an epidemic, and it has practical application in many countries. Thus, an effective means of collecting daily health information from subjects directly and quickly is desirable.
Use of the World Wide Web to perform an epidemiological survey was reported in 1996 [9]. This method has since been applied to national-scale surveys in various countries where residents voluntarily input information on influenza-like symptoms directly into a dedicated website so epidemiologists can gain an understanding of the influenza
epidemic [10-13].
To broaden the range of such a survey in terms of contributors and infectious diseases, we developed and conducted a daily health survey of the general population using the internet and named this survey the web-based daily questionnaire for health (WDQH) [14]. In this study, we report the methodology of data collection and processing of the WDQH and clarify its use in syndromic surveillance. This study was performed with subjects of panels registered at internet survey companies. In addition, we investigated a
method for the long-term operation of the survey by reducing the cost of each individual survey.
Methods
Recruitment
Two different methods were used to recruit subjects for the WDQH. First, internet panel surveys comprised subjects who were already registered with an established internet survey company. Second, the Tokyo Consumers’ Co-operative Union (TCCU) internet survey comprised members of the TCCU, in cooperation with the Japanese Consumers’
Co-operative Union (JCCU), who were invited to participate via advertising on the company website.
An internet survey company conducts questionnaire surveys via the internet. For survey subjects registered in advance, questionnaires and a response column are displayed on the website for the respondents to complete and transmit their responses. Additionally, the internet panel survey was repeated twice with different survey and collection
methods (Internet Panel Surveys I and II). In the internet panel surveys, the respondents were registered as panel members with the company and were residents of Izumo City (150,000 inhabitants) in western Japan, which had 89.5% internet coverage in 2008.
The youngest respondent was 16 years old. The respondents also provided information regarding symptoms in family members. Internet Panel Survey I was conducted daily between December 1, 2007, and March 28, 2008, in 245 respondents who were paid 60 yen ($0.75) per survey completed. A reminder e-mail was sent daily to those who agreed to participate. Internet Panel Survey I included 702 subjects. Respondents were those who completed the survey, and all family members included in the survey were subjects.
In Internet Panel Survey II, conducted between January 8, and March 13, 2009, we examined changes in the data acquisition method to reduce survey costs. We
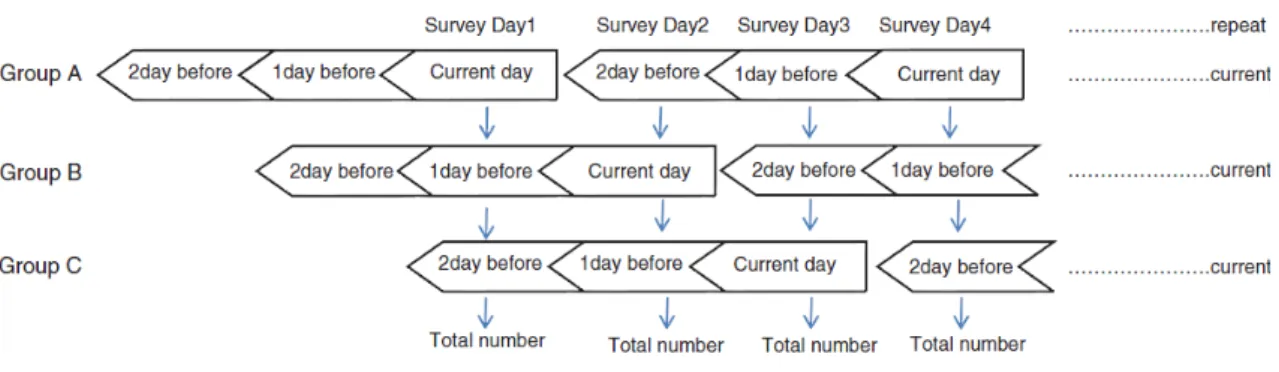
investigated whether reporting health conditions once every 3 days could reduce survey costs. Internet Panel Survey II was conducted continuously with 264 respondents and included 716 subjects. The respondents were divided into groups A, B, and C, and each group was surveyed by shifting the survey date by 1 day to determine the applicability of recall for 1-in-3 day reporting. Thus, groups A, B, and C received the questionnaire on days 1, 2, and 3, respectively. For example, the data on survey day 1 included symptoms that were experienced on the current day by group A, on the day before the survey day by group B, and 2 days before the survey day by group C. Thus, on survey day 1, responses were obtained from all the respondents (Fig. 1). Each group was divided randomly. A reminder e-mail was sent to each group on the survey day.
Figure 1. Data collection method for Internet Panel Survey II
We also investigated whether the response rate varied according to the incentive. Each group was further divided into three subgroups in which the members were given a reward of 40 ($0.50), 60 ($0.75), or 80 yen ($1.00). The response rates were then investigated.
In the TCCU survey, we examined methods to collect health information from residents without the use of an internet survey company. The respondents were those who
accessed the website of the TCCU’s home delivery services and applied to participate in the survey, which was advertised with an onscreen banner. Recruitment was performed between January 15, and January 31, 2009, and any applicant could participate. There were 427 respondents from Tokyo, which had 95.2% internet coverage in 2008. The
subjects were given 100 yen ($1.25) for registering. No fee was paid for each survey, but health information was provided to the participants in the relevant residential areas based on survey results. The TCCU survey was conducted in cooperation with the JCCU, which has 1 million members in Tokyo among a population of 12.3 million. The TCCU has a strong corporate philosophy regarding food safety and understanding the health concerns of consumers. Many respondents were homemakers, as the proportion of female respondents was 97.6%. They provided information about themselves and family members, providing 1453 subjects, who were 49.5% male and 50.5% female.
Response method
The survey administrator sent a reminder e-mail to all recruited subjects on the day of the survey. Respondents accessed the password-protected website designated in the e-mail and responded to the questions. The questionnaire ascertained whether subjects or their family members had any symptoms. The gender and age (in 5-year intervals) of the subjects who developed symptoms as well as their specific symptoms (Table 1) were noted. Six symptoms associated with diseases of infection and bioterrorism were
selected in Internet Panel Survey I. In Internet Panel Survey II and in the TCCU survey, 12 symptoms associated with seasonal allergic diseases and changes in body conditions were added, and “fever” was divided into “slight fever” and “high fever.”
Table 1. Items in the three surveys
Internet Panel Survey I Internet Panel Survey II, the TCCU survey
Fever Slight fever
Cough High fever
Diarrhea Runny nose
Vomiting Cough
Eruption Diarrhea
TCCU, Tokyo Consumers’ Co-operative Union
These surveys were conducted with varied symptoms to examine whether the WDQH could be applied in the surveillance of various diseases according to symptoms.
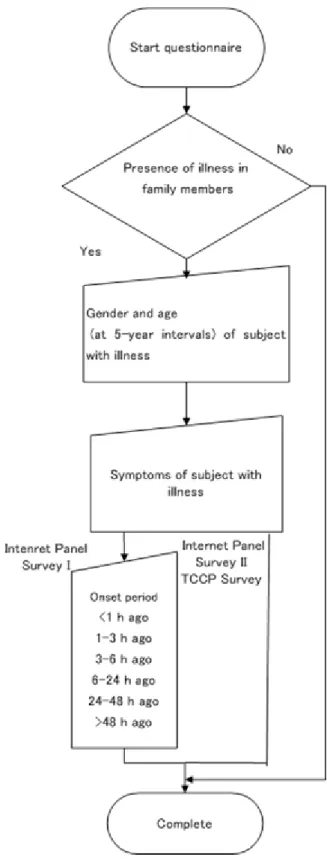
Reports by asymptomatic subjects are essential for calculating prevalence rates and an analysis of variance by the presence of symptoms. The symptoms quoted in this survey are common, particularly during the acute phases of diseases caused by infection and environmental factors. The time of symptom onset was determined (“<1 h ago,” “1–3 h ago,” “3–6 h ago,” “6–24 h ago,” “24–48 h ago,” and “>48 h ago”) (Fig. 2) in Internet Panel Survey I.
Convulsion Vomiting
Convulsion Eye itch Eruption
Diagnosis of Influenza Diagnosis of Gastroenteritis Arthritic pain
Muscle pain Shoulder stiffness Sneeze
Skin itch Rough hands Sleeplessness
Decreased concentration
Figure 2. Survey flowchart
In Internet Panel Survey II and the TCCU survey, only onset cases on the current day were reported. If a respondent tried to exit the survey without answering all the
questions, the system would provide an alert to the respondent to prevent invalid responses.
Data processing
The survey also included details such as “survey date,” “presence of illness in family members,” “presence of symptoms in family members,” and “time of symptom onset in a family member.” Data entered in the WDQH were then transmitted to a server
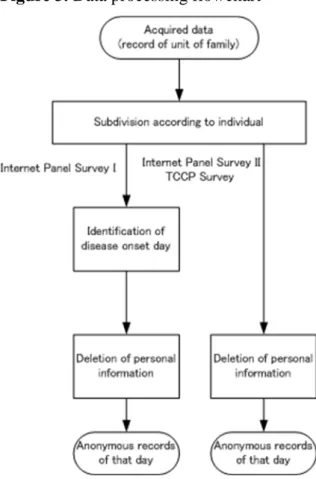
managed by a researcher. Subsequently, the records for each household were subdivided by family member. In Internet Panel Survey I, the symptom onset dates for subjects were determined from the time elapsed between symptom onset and reporting. Those with a symptom onset of >48 h before the survey were excluded. This was intended to include only patients with symptoms at an acute stage. Personal information was then deleted (Fig. 3).
Figure 3. Data processing flowchart
The final subject records consisted of “survey date,” “presence of illness and presence of symptoms by subject,” and “symptom onset date.” Cross-correlation was used during syndromic surveillance with the collected data to determine the number of subjects by symptom and date.
Examples of using the data in syndromic surveillance
Symptoms were cross-tabulated to determine the symptom onset dates and number of subjects who developed a particular symptom. The results were used to prepare time-series graphs by symptom, with the prevalence of symptoms plotted against the date. Subsequently, alerts by symptom were reported on the day when the number of subjects who developed the symptom increased rapidly compared with the baseline of the previous 10 days using the early aberration reporting system (EARS) algorithm recommended by the US Centers for Disease Control and Prevention [15,16].
This study was approved by the Ethical Committee of Nara Medical University (Authorization Code: 220).
Results
Demographic characteristics of the respondents and response rates
Table 2 presents the number of respondents, gender, age distribution, number of subjects including families of the respondents, and daily mean response rates for the three
surveys. The numbers of respondents (subjects) in Internet Panel Survey I, Internet Panel Survey II, and the TCCU survey were 245 (702), 264 (716), and 1427 (1453), respectively.
Table 2. Demographics and response rates of participants in the three surveys
Internet Panel Survey I
Internet Panel
Survey II TCCU survey
Number of respondents 245 264 427
Men 44.5% 52.7% 2.6%
Women 55.5% 47.3% 97.6%
Age distribution of respondents (years)
≤29 26.5% 26.9% 4.6%
30–39 43.3% 41.7% 35.3%
40–49 21.9% 21.9% 39.4%
50–59 5.8% 7.9% 16.3%
≥60 2.5% 1.6% 4.4%
Daily mean response rate 47.3% 42.7% 40.1%
Subjects included in
each survey 702 716 1453
In Internet Panel Survey I, a constant response rate was observed from the initiation to the end of the survey, and there was no tendency to respond when only one symptom was present. The response rate was 48.7% on weekdays and 44.4% on the weekend, indicating a significantly higher rate on weekdays (P < .001). In addition, the
percentage of respondents with a 100% response rate was 3.2%, whereas the percentage of those with no responses was 34.5%. The response of “presence of fever” was given by 184 subjects, including family membersof the respondent. Among these subjects, data for two subjects were given for the first time only when the symptom was present.
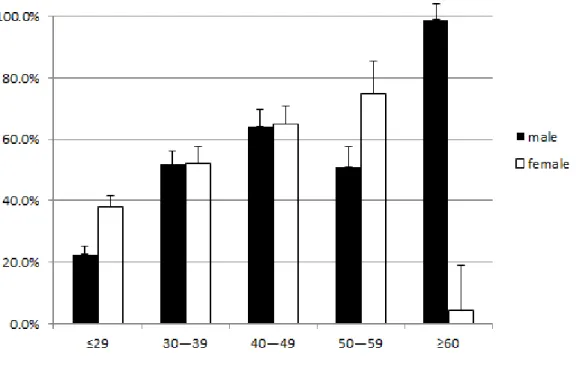
The daily mean response rate was determined for different ages and genders. When the subjects aged ≥60 years were excluded from the analysis, the lowest response rate was
22.6% in males aged ≤29 years, and the highest response rate was 74.9% in females aged 50–59 years (Fig. 4).
Figure 4. Population distribution by age in the studies. Data are presented as the mean and standard deviation, which is indicated by error bars. Age is given in years.
In Internet Panel Survey II, the response rate was constant from the initiation of the survey to its end. The response rate was 44.0% on weekdays and 39.9% on the weekend.
The percentage of respondents with a 100% response rate was 6%, and the percentage of those without a response was 36.2%.
In the TCCU survey, the response rate decreased gradually from the first to the final day.
The response rate was 41.5% on weekdays and 38.9% on weekends. No significant differences were observed among the groups. The percentage of respondents with a 100% response rate was 3.3%, and the percentage of those without a response was 5.9%.
Elapsed time from the development of symptoms to a report
In Internet Panel Survey I, the appearance of symptoms was as follows: “>48 h ago”
(59%), “6–24 h ago” (13%), “24–48 h ago” (12%), “3–6 h ago” (3%), “1–3 h ago” (1%), and “<1 h ago” (1%). Of all responses, the daily average reporting rates by symptom were as follows: cough (8%), fever (3%), diarrhea (2%), vomiting (1%), rash (0%), and convulsion (0%).
Examples of using the data in syndromic surveillance
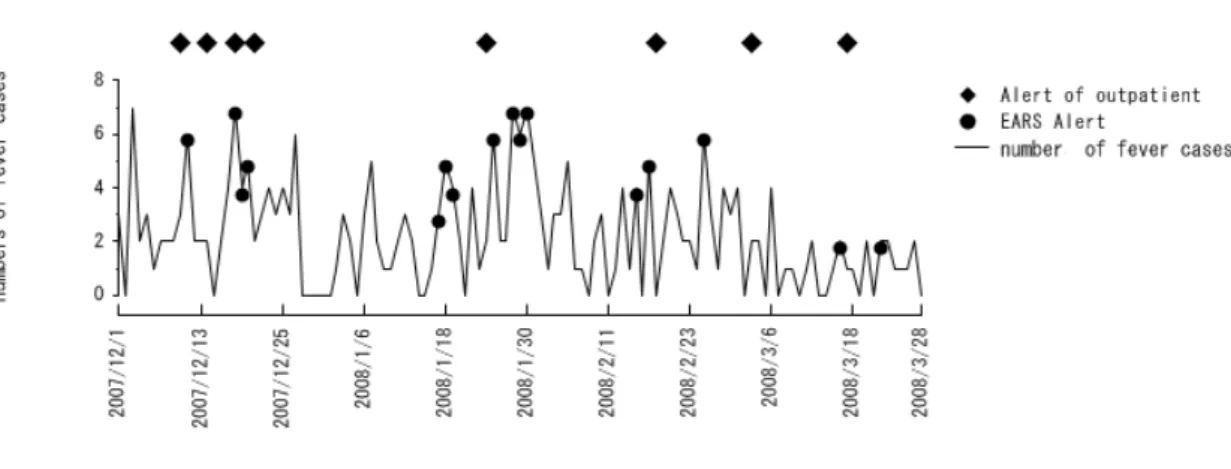
Figure 5 presents a graph for “fever” in Internet Panel Survey I.
Figure 5. Results of syndromic surveillance conducted in Internet Panel Survey I.
Circles: Alerts reported by EARS. Diamonds: Alert occurrence dates coincident with the regional outpatient symptomatic surveillance in medical institutions.
The number of subjects with fever was made a parameter. When the number of persons with fever was three or more standard deviations above the mean of the previous week, an alert was reported by EARS. Circles indicate dates when alerts were reported by EARS [15]. Boxes indicate alert-occurring dates coincident with regional outpatient symptomatic surveillance in medical institutions. The number of patients who
complained of febrile symptoms at history-taking in the outpatient section was made a
parameter. The outpatient symptomatic surveillance reported eight alerts, whereas the WDQH reported 16 alerts. Because of the time factor in an epidemic, the presence of an alert within the gold standard (3 days before to 3 days after symptom onset) was
examined. The sensitivity was 0.43, and the specificity was 0.88. For cough, eight alerts were reported during outpatient symptomatic surveillance. In Internet Panel Survey I, 19 alerts were reported. Similarly, for diarrhea, there were 30 alerts in outpatient symptomatic surveillance and 25 alerts in Internet Panel Survey I. For vomiting, there were 24 alerts in outpatient symptomatic surveillance and 22 alerts in Internet Panel Survey I. For rash, there was one alert in outpatient symptomatic surveillance and 10 alerts in Internet Panel Survey I. For convulsions, there was one alert in outpatient symptomatic surveillance and seven alerts in Internet Panel Survey I.
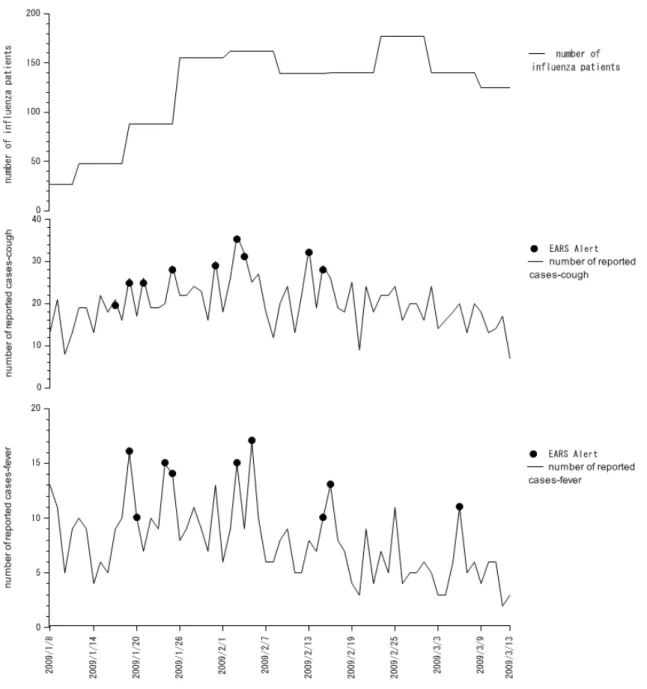
Figure 6 shows the results of syndromic surveillance in Internet Panel Survey II; the number of influenza patients in the area (published by the trend of symptom onset), the patients who reported “cough,” and the patients with “fever” are shown in the upper, middle, and lower panels, respectively. The circles in the middle and lower panels show alerts by EARS. During the survey, nine alerts each were reported for cough and fever.
Figure 6. Results of syndromic surveillance conducted in Internet Panel Survey II.
Circles: Alerts reported by EARS.
Examination of methods to reduce survey costs
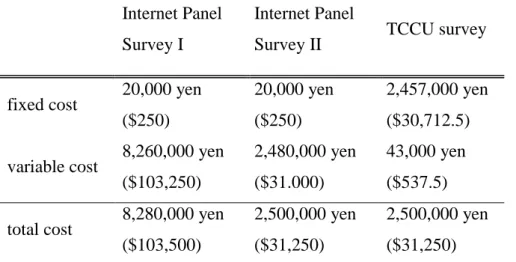
Table 3 shows the fixed, variable, and total costs for the three surveys. Initial costs were very low only for screening the questions for panel research. Variable costs were
composed of the investigation days and the number of investigation panel. In the TCCU survey, the fixed costs for development were the highest. Variable costs were only for
incentives paid when participation was declared.
Table 3. Survey expenses for the three surveys
Internet Panel Survey I
Internet Panel
Survey II TCCU survey
fixed cost 20,000 yen ($250)
20,000 yen ($250)
2,457,000 yen ($30,712.5) variable cost 8,260,000 yen
($103,250)
2,480,000 yen ($31.000)
43,000 yen ($537.5) total cost 8,280,000 yen
($103,500)
2,500,000 yen ($31,250)
2,500,000 yen ($31,250)
There were three respondents in Internet Panel Survey II. All respondents gave their answers regarding symptoms that presented on the same day, providing responses on the day, the day after, and 2 days after the sentinel day. The response rates were 42.4%, 43.1%, and 42.7% in groups A, B, and C, respectively. No significant difference was found in the response rate among the groups.
The response rates by fee paid for a single response were as follows: 46.7% (40 yen), 39.7% (60 yen), and 41.6% (80 yen). A one-way analysis of variance revealed a significant difference; thus, a multiple comparison test was conducted. Significant differences were observed in the average response rates between the 40-yen and 60-yen groups and between the 40-yen and 80-yen groups, with a greater response rate in the 40-yen group.
Discussion
We developed and validated a health observation method based on self-reporting by subjects via the internet. We clarified the usefulness of the WDQH via its practical use
for syndromic surveillance.
Conventional paper-based surveys can be conducted at a low cost in a small population of subjects, and these surveys do not incur major initial expenses for the system.
Moreover, combining web- and paper-based surveys improves the response rate [17].
However, although requiring greater up-front costs, the WDQH allows daily
inexpensive repetitive surveys to be conducted in a large number of subjects, illustrating the advantage of a web-based survey [18]. Furthermore, web-based surveys permit a more efficient statistical analysis of data by computer. Thus, cost-effective and rapid surveys of a large number of subjects, with high data precision, have become possible.
Previous studies have reported surveys of asthma and diet, for example, in specific groups and patients by internet surveys [19,20]. Various countries have been using a method in which residents voluntarily input information on influenza-like symptoms directly into the website to understand an influenza epidemic. Thus, verifications with an actual influenza epidemic have been conducted and its usefulness has been
demonstrated [10,13].
Although reports are available on the surveillance of symptoms in volunteers, no reports are available on the surveillance of symptoms using individuals identified in an internet survey company. To promote the robustness of data gathering, the WDQH comprised registered members of an internet survey company who were more likely to provide reliable data than anonymous respondents. Additionally, because recruitment of the respondents was from registered members, only a short time was required from the decision-making at the initiation of the survey to actual data collection. Thus, this survey provides value in this regard.
Rates of 52.6% [21] and 50% [22] have been reported in surveys that ended after a single investigation. In a meta-analysis conducted on 68 response rates of sampling surveys, the average response rate for web-based surveys was 39.6% [23]. During surveillance of symptoms in volunteers, some participants who initially did not respond to the survey responded only when a symptom was present [13]. In our study,
respondents to the internet panel surveys, who completed the questionnaire the first time, tended to always cooperate with the survey. This finding indicates that these surveys are a useful method for reporting the appearance of symptoms.
There are problems with previous surveillance methods, such as the length of time required, indirect data collection, and no data collection during holidays. However, we developed the WDQH with the objective of acquiring data immediately after symptom onset. In addition, the WDQH allowed data collection on Saturdays, Sundays, and public holidays. Thus, we were able to conduct consistent daily surveillance.
Furthermore, we used preventive measures, such as a branched and stepwise-structured questionnaire, to eliminate mistakes and discrepancies in responses [24].
In Internet Panel Survey I, it was confirmed that health information of the subjects could be collected daily via the internet. However, the survey cost was 8.28 million yen ($103,500), which was considered too expensive over a long period. We thus conducted both Internet Panel Survey II, which is economical for a panel survey, and the TCCU survey, without using the internet survey company. In Internet Panel Survey II, two surveys were conducted. The first was used to reduce the frequency of surveys to once every 3 days. Changes in the actual number of influenza patients corresponded with the changes determined by Internet Panel Survey II, which was conducted for syndromic surveillance without impairing data precision. This method allowed the implementation of a survey three times as long for the same cost as one conducted daily. The cost of Internet Panel Survey II was approximately one-half that of Internet Panel Survey I.
The second survey in Internet Panel Survey II investigated cash incentives. The internet survey company that we used typically paid a fee of 60 yen for a single response.
Surprisingly, the response rate was highest when the fee was set at the lowest level of 40 yen. Generally, higher fees act as an incentive for subject recruitment, but this study found that the offer of a higher reward did not result in a higher response rate. This point has been supported by a previous study [25]. As there was a sufficient response with no payment for each TCCU survey, any cost-associated restrictions on the survey period were eliminated. A fee was paid to the members of the TCCU only for survey
registration, and information about the results was provided to the respondents. The response rate for the TCCU survey was lower than that for Internet Panel Surveys I and II. However, even at this lower rate, a large number of subjects were included because membership in the JCCU numbers at least 24 million throughout Japan, including 300,000 registered to its website.
From the WDQH data, we used EARS as an alert so that if the level measured on the current day was greater than three standard deviations different from the mean observed level for the previous week, it was reported as abnormal. If data are accumulated for several years, the number of patients can be estimated by multivariate analyses, where the number of patients, number of weeks, day of the week, holidays, and day after holidays are considered dummy variables. However, in this study, data were not continuously accumulated for 1 year or longer; thus, a multivariate analysis was not performed.
Syndromic surveillance could be implemented as a result of these validations. The internet survey company in this study used an existing survey panel. The time required from planning to implementation was short with the use of this company, which already had its registered members as recruited subjects. Thus, an urgent surveillance can be conducted within 3 days regardless of the location in Japan. During syndromic surveillance using the WDQH, measures against a health crisis can be readily put in place.
Removing selection bias is difficult in internet surveys. The population tended to be biased toward young people because internet surveys require respondents to have computer skills. Introducing an easy system to increase the response rate of elderly subjects could reduce this bias. However, because we believe that the increase or decrease in symptoms is reliable regardless of bias, we used EARS for all methods.
Cough was often excluded from previous surveys because most cases of cough were present >48 h before the survey, and cough probably requires a longer time to be recognized as bothersome to the same degree as other symptoms, such as fever and vomiting. To use the WDQH for syndromic surveillance, questions to respondents
should be limited to those regarding acute symptoms, and a system that allows easy reporting within 24 h should be established in the future.
In this study, we conducted the surveys with the same respondents. We think that it would be difficult for the respondents to maintain their interest every day for several years. For long-term operation of the survey, we consider that new respondents should be recruited after a certain period.
There are two further applications for the surveys other than the surveillance of
symptoms. First, when environmental data published later by public institutions, such as average temperature and atmospheric pressure, are linked to the records by subject and locality on the same date, a cross-correlation survey of symptoms and environmental factors can be implemented. In the future, various daily surveys can be conducted, such as those for mean air temperature and the presence or absence of fever. These are topics to be investigated in the future.
Another application for the WDQH could be in postmarketing surveillance of food similar to that conducted for pharmaceuticals. Food safety is more widely expected by consumers today than it was in the past. Until now, postmarketing surveillance of food has only been conducted in a single instance for a food additive [26]. A cross-correlation survey using a consumer database to identify the relationship between daily symptom data of the respondents obtained by the WDQH and consumed foods based on sales records may allow the reporting of adverse events when certain symptoms are associated with specific products.
Conclusions
We developed a health observation method via the internet using self-reporting by respondents and validated the method for its application in syndromic surveillance. The internet allows quick, cost-effective epidemiological surveys to be conducted that would be difficult to conduct by conventional methods.
Acknowledgment
Financial support for this study was provided by a grant from the Ministry of Health, Labour and Welfare, Japan.
Competing interests
The authors have no competing interests to declare.
Authors’ contributions
All authors contributed equally to this work.
References
1. WHO (ed.): International Health Regulations (2005) Second Edition; 2005.
2. Mandl KD, Overhage JM, Wagner MM, Lober WB, Sebastiani P, Mostashari F et al. Implementing syndromic surveillance: a practical guide informed by the early experience. J Am Med Inform Assoc 2004;11(2):141-150.
PMID:14633933
3. Henning KJ. What is syndromic surveillance? MMWR Morb Mortal Wkly Rep 2004;53 Suppl:5-11. PMID:15714620
4. Buehler JW, Sonricker A, Paladini M, Soper P, Farzad Mostashari. Syndromic surveillance practice in the United States: Findings from a survey of state, territorial, and selected local health departments. Advances in Disease Surveillance 2008;6(3):1-16 [http://www.isdsjournal.org/articles/2618.pdf]
5. Bravata DM, McDonald KM, Smith WM, Rydzak C, Szeto H, Buckeridge DL et al. Systematic review: surveillance systems for early detection of
bioterrorism-related diseases. Ann Intern Med 2004;140(11):910-922.
PMID:15172906
6. Besculides M, Heffernan R, Mostashari F, Weiss D. Evaluation of school absenteeism data for early outbreak detection, New York City. BMC Public Health 2005;5:105. PMID:16212669
7. Ohkusa Y, Shigematsu M, Taniguchi K, Okabe N. Experimental surveillance
using data on sales of over-the-counter medications—Japan, November 2003-April 2004. MMWR Morb Mortal Wkly Rep 2005;54 Suppl:47-52.
PMID:16177693
8. Najmi AH, Magruder SF. An adaptive prediction and detection algorithm for multistream syndromic surveillance. BMC Med Inform Decis Mak 2005;5:33.
PMID:16221308
9. Bell DS, Kahn CE, Jr. Health status assessment via the World Wide Web. Proc AMIA Annu Fall Symp 1996:338-342. PMID:8947684
10. Marquet RL, Bartelds AI, van Noort SP, Koppeschaar CE, Paget J, Schellevis FG et al. Internet-based monitoring of influenza-like illness (ILI) in the general population of the Netherlands during the 2003–2004 influenza season. BMC Public Health 2006;6:242. PMID:17018161
11. van Noort SP, Muehlen M, Rebelo de Andrade H, Koppeschaar C, Lima Lourenco JM, Gomes MG. Gripenet: an internet-based system to monitor influenza-like illness uniformly across Europe. Euro Surveill 2007;12(7):E5-6.PMID:17991409
12. Carlson SJ, Dalton CB, Tuyl FA, Durrheim DN, Fejsa J, Muscatello DJ et al.
Flutracking surveillance: comparing 2007 New South Wales results with laboratory confirmed influenza notifications. Commun Dis Intell 2009;33(3):323-327.PMID:20043603
13. Tilston NL, Eames KT, Paolotti D, Ealden T, Edmunds WJ. Internet-based surveillance of influenza-like-illness in the UK during the 2009 H1N1 influenza pandemic. BMC Public Health 2010;10:650. PMID:20979640
14. Sugiura H, Ohkusa Y, Akahane M, Sugahara T, Okabe N, Imamura T.
Construction of syndromic surveillance using a web-based daily questionnaire for health and its application at the G8 Hokkaido Toyako Summit meeting.
Epidemiol Infect 2010;138(10):1493-1502. PMID:20067657
15. Hutwagner L, Thomson W, Seeman GM, Treadwell T. The bioterrorism preparedness and response early aberration reporting system (EARS). J Urban Health 2003;80:89-96
[http://www.ingentaconnect.com/content/klu/11524/2003/00000080/A00100s1/i 89]
16. Centers for Disease Control and Prevention. Early Aberration Reporting System.
[http://www.bt.cdc.gov/surveillance/ears/]
17. Kroth PJ, McPherson L, Leverence R, Pace W, Daniels E, Rhyne RL et al.
Combining web-based and mail surveys improves response rates: a PBRN study from PRIME Net. Ann Fam Med 2009;7(3):245-248. PMID:19433842
18. Schleyer TK, Forrest JL. Methods for the design and administration of web-based surveys. J Am Med Inform Assoc 2000;7(4):416-425.
PMID:10887169
19. Weisel CP, Weiss SH, Tasslimi A, Alimokhtari S, Belby K. Development of a web-based questionnaire to collect exposure and symptom data in children and adolescents with asthma. Ann Allergy Asthma Immunol 2008;100(2):112-119.
PMID:18320912
20. Lu C, Pearson M, Renker S, Myerburg S, Farino C. A novel system for collecting longitudinal self-reported dietary consumption information: the internet data logger (iDL). J Expo Sci Environ Epidemiol 2006;16(5):427-433.
PMID:16552428
21. Greenlaw C, Brown-Welty S. A comparison of web-based and paper-based survey methods: testing assumptions of survey mode and response cost. Eval Rev 2009;33(5):464-480. PMID:19605623
22. Converse PD, Wolfe ED, Oswald FL. Response rates for mixed-mode surveys using mail and e-mail/web. Am J Eval 2006;29(1):99-107. doi:
10.1177/1098214007313228
23. Cook C, Heath F, Thompson RL. A meta-analysis of response rates in web- or internet-based surveys. Educ Psychol Meas 2000;60:821-836. doi:
10.1177/00131640021970934
24. Austin TM, Richter RR, Reinking MF. A primer on web surveys. J Allied Health 2008;37(3):180-186. PMID:18847116
25. Kypri K, Gallagher SJ. Incentives to increase participation in an internet survey of alcohol use: a controlled experiment. Alcohol 2003;38(5):437-441.
PMID:12915520
26. Slough CL, Miday RK, Zorich NL, Jones JK. Postmarketing surveillance of new food ingredients: design and implementation of the program for the fat replacer
olestra. Regul Toxicol Pharmacol 2001;33(2):218-223. PMID:11350204