Influence of Biomass Burning on
Characterization of Atmospheric Polycyclic Aromatic Hydrocarbons and their Nitro
Derivatives in Chiang Mai,Thailand
著者 タンヤラット チェサード
著者別表示 Thanyarat Chuesaard journal or
publication title
博士論文本文Full 学位授与番号 13301甲第3961号
学位名 博士(学術)
学位授与年月日 2013‑09‑26
URL http://hdl.handle.net/2297/39364
Creative Commons : 表示 ‑ 非営利 ‑ 改変禁止 http://creativecommons.org/licenses/by‑nc‑nd/3.0/deed.ja
Ph.D. Dissertation
Influence of Biomass Burning on Characterization of Atmospheric Polycyclic Aromatic Hydrocarbons and their Nitro Derivatives in Chiang Mai, Thailand
Thanyarat Chuesaard September 2013
Ph.D. Dissertation
Influence of Biomass Burning on Characterization of Atmospheric Polycyclic Aromatic Hydrocarbons and their
Nitro Derivatives in Chiang Mai, Thailand
タイ・チェンマイにおける大気中多環芳香族炭化水素と
そのニトロ誘導体の特性解析とバイオマス燃焼の影響
Graduate School of Natural Science and Technology Kanazawa University
Major subject: Environmental Science and Engineering Student ID No: 1023142419
Name: Thanyarat Chuesaard
Chief advisor: Assoc. Prof. Dr. Akira Toriba
i
Table of contents
List of Tables………....iii
List of Figures…...………...……….iv
List of Abbreviation………..……….v
Abstract………...……….……vii
Chapter 1: Introduction………...………..…1
1.1. Background information……….……....1
1.1.1. Particulate matter (PM)………..1
1.1.2. Toxicity of Polycyclic aromatic hydrocarbon (PAHs) and nitropolycyclic aromatic hydrocarbons (NPAHs)……….….………..2
1.1.3. Sources, formation and properties of PAHs……….………….……….…3
1.1.4. Sources, formation and properties of NPAHs……….……..….6
1.1.5. Biomass burning ……….……...……8
1.2. Air pollution in Thailand……….……9
1.3. Purpose of this study……….……..…..12
Chapter 2: Influence of Biomass Burning on the Levels of Atmospheric Polycyclic Aromatic Hydrocarbons and their Nitro Derivatives in Chiang Mai, Thailand………....….15
2.1. Methods………...…..16
2.1.1. Sampling………..……….……16
2.1.2. Reagents………...…….17
2.1.3. Sample preparation………..….…18
2.1.4. Analysis……….…..…….18
2.2. Results and discussion………..…..……..23
2.2.1. Ambient concentrations of TSP………...23
2.2.2. Ambient concentrations of PAHs………...……….24
2.2.3. Ambient concentrations of NPAHs………..….…..28
2.2.4. PAH and NPAH correlation with LG………...….…..30
2.2.5. Evaluation of emission sources by diagnostic ratios using NPAHs…...….…..34
2.2.6. Secondary formation of NPAHs……….……...…..35
2.2.7. Health risk assessment………....……....….36
ii
2.2.7.1. Carcinogenic risk……….36
2.2.7.2. Mutagenicity……….……...……38
2.3. Conclusions……….……..………40
Appendix A: PAHs and NPAHs analysis.………..……...…….….41
Appendix B: Levoglucosan analysis.………..……...…….….43
Appendix C: PM10 monitoring at the Air Quality Monitoring (AQM) stations…...……..….44
Appendix D: Total PAHs concentration in Chiang Mai and other cities in Southeast Asia...46
References………....…47
Acknowledgements………..………56
iii
List of Tables
1.1. Sixteen priority PAHs were classified by IARC in comparing those by the DHHS
and the US EPA………..………..……..3 1.2. Physical-chemical characteristics of some PAHs………...………6 1.3. The highest level of PM10 in Chiang Mai Province………...…………...11 2.1. Meteorological parameters, and concentrations of collected PM and forest fires…...….22 2.2. Concentrations (mean ± SD) of LG, PAHs, and NPAHs in the dry, transition,
and wet seasons……….25 2.3. Correlation coefficients of PAHs and NPAHs with LG in the dry and wet seasons…....31 2.4. Correlation coefficients among the concentrations of individual and total
PAHs and NPAHs and between PAHs and NPAHs in the dry season……….……32 2.5. Correlation coefficients among the concentrations of individual and total
PAHs and NPAHs and between PAHs and NPAHs in the wet season……….……33 2.6. PAH and NPAH toxic equivalent factors (TEFs)………...…..37 2.7. Indirect and direct-acting mutagenicity of PAHs and NPAHs…….……...……..………38
iv
List of Figures
1.1. Chemical structure of US EPA 16 PAHs………...………….4
1.2. Pyrosynthesis of PAHs starting with ethane……….………...………...5
1.3. Gas phase reaction of 2-NFR………...………...…7
1.4. Map of Chiang Mai and Chiang Mai – Lamphun basin………...……….10
1.5. ASRs of lung cancer by region in northern Thailand, 2003-2007, compared to Japan…11 1.6. The structures of targeted 10 PAHs in this research………...…..…13
1.7. The structures of targeted 19 NPAHs in this research………...…...…14
2.1. High volume air sampler………...………17
2.2. HPLC-FL system for PAHs analysis………...………….19
2.3. HPLC-CL system for NPAHs analysis………...………..21
2.4. Monthly concentration of TSP (mean ± SD)………...……….24
2.5. Monthly concentrations (mean ± SD) of PAHs, NPAHs, and LG. Each bar represents the mean concentrations of the total PAHs or NPAHs. The line plot connects the mean concentrations of LG………..26
2.6. Monthly composition profiles of PAHs. The numbers under the bars denote the percentage of each compound in the total concentration……….26
2.7. Monthly diagnostic ratios of [9-NA]–[1-NP], [1-NP]–[Pyr], and [BaP]–[BghiPe]…..…27
2.8. Monthly composition profiles NPAHs. The numbers in the bars denote the percentage of each compound in the total concentration………...….29
2.9. Resonant structures of Ant………...….30
2.10. Monthly concentration of 2-NFR, 2-NP and [2-NFR]/[2-NP] ratio………...…....36
2.11. Total carcinogenic risk calculated from the atmospheric concentrations of eight PAHs and five NPAHs………..37
2.12. Monthly indirect-acting mutagenicity of PAHs and direct-acting mutagenicity of NPAHs calculated from the atmospheric concentrations of all PAHs and NPAHs…...39
v
List of Abbreviations
Ant Anthracene
AP Aminopyrene
APAH Aminopolycyclic aromatic hydrocarbon AQM Air quality monitoring
ASR Age standardized rate BaA Benz[a]anthracene BaP Benzo[a]pyrene BbF Benzo[b]fluoranthene BghiPe Benzo[ghi]perylene BkF Benzo[k]fluoranthene
BSTFA N,O-Bis(trimethylsilyl) trifluoroacetamide
Chr Chrysene
CL Chemiluminescence
CMPHO Chiangmai Provincial Public Health Office DAP Diaminopyrene
DBA Dibenz[a,h]anthracene DCM Dichloromethane
DHHS The Department of Health and Human Services DMSO Dimethyl sulfoxide
DNP Dinitropyrene FL Fluorescence Flu Fluoranthene
GC Gas Chromatography
HPLC High Performance Liquid Chromatography
IARC The International Agency for Research on Cancer IDP Indeno[1,2,3-cd]pyrene
LG Levoglucosan
MS Mass Spectrometry
NA Nitroanthracene
NBaA Nitrobenz[a]anthracene NBaP Nitrobenzo[a]pyrene NC Nitrochrysene
vi NF Nitrofluorene
NFR Nitrofluoranthene NP Nitropyrene
NPAH Nitropolycyclic aromatic hydrocarbon NPer Nitroperylene
NPh Nitrophenanthrene
NPL The National Priorities List NTP Nitrotriphenylene
PAH Polycyclic aromatic hydrocarbon PCD Pollution Control Department PM Particulate matter
Pyr Pyrene
rev. Revertants
SD Standard deviation
TCPO bis(2,4,6-trichlorophenyl)oxalate TEFs Toxic equivalent factors
TEOM Tapered element oscillating microbalance TMCS Trimethylchlorosilane
TSP Total suspended particulate matter
US EPA United States Environmental Protection Agency VOC Volatile organic compounds
vii
Abstract
Chiang Mai and several other provinces in northern Thailand have been annually facing air pollution problems during the dry season. The levels of airborne particulate matter (PM) increase in the season and often exceed the standard level in Thailand. Biomass burning is expected as a main contributor to the high PM concentrations. PM contains many inorganic and organic hazardous compounds. Among them, polycyclic aromatic hydrocarbons (PAHs) and nitropolycyclic aromatic hydrocarbons (NPAHs) are of great concern because of their toxicity (carcinogenicity or mutagenicity) to human. However, the contribution of biomass burning to PAHs and especially NPAHs remains unclear. This study reports atmospheric levels and distribution profiles of PAHs and NPAHs in Chiang Mai, Thailand. Ten PAHs, 19 NPAHs, and levoglucosan, a marker for biomass burning, were quantified in total suspended particulates collected in Chiang Mai during the dry, transition, and wet seasons in 2010.
PAHs and NPAHs were analyzed by HPLC with florescence and chemiluminescence detections, respectively. In addition, LG was analyzed by GC-MS after derivatization with a silylating reagent. The concentrations of PAHs and NPAHs in the dry season were significantly higher than those in the wet season. The [Benzo[a]pyrene (BaP)]–
[benzo[ghi]perylene (BghiPe)] ratio, as an indicator of traffic, and the correlations of PAHs and NPAHs with LG showed that biomass burning significantly contributes to air pollution in the dry season. We proposed 9-nitroanthracene (9-NA) as a marker of biomass burning and the [9-NA]–[1-nitropyrene (1-NP)] ratio as a new indicator for assessing the contribution of biomass burning. The analysis using the markers indicated that biomass burning was a major source of PAHs and NPAHs in the dry season, whereas vehicle exhaust was the main contributor in the wet season. The high carcinogenic risks in the dry season correlate with more harmful air conditions during this season. Thus, it is important to control biomass burning to reduce air-pollution-related health risks during the dry season in northern Thailand. These results should be useful in controlling and managing air pollution in Thailand.
Chapter 1 Introduction
1.1. Background information
Air pollution, both indoors and outdoors, is a major environmental health problem affecting everyone in developed and developing countries alike. Air pollution occurs when the air contains gases, dust, fumes or odor in amounts that could be harmful to the health or comfort of humans and animals or could cause damage to plants and buildings. The substances that cause air pollution are called pollutants. There are two types of air pollutants.
Primary air pollutants are emitted directly from the sources such as carbon monoxide (CO) and sulfur dioxide (SO2). Secondary air pollutants are formed by chemical or physical transformations in the atmosphere such as ozone (O3), nitrate (NO3-
) and sulfate (SO42-
).
United States Environmental Protection Agency (US EPA) has established air quality standards for six common air pollutants to protect public health and the environment. These pollutants include carbon monoxide, ozone, lead, nitrogen dioxide, sulfur dioxide and particulate matter.
1.1.1. Particulate matter (PM)
One of the most serious pollutants is PM. PM is a complex mixture of solid and liquid particles that are suspended in air. These particles typically consist of a mixture of inorganic and organic chemicals including carbon, sulfates, nitrates, metals, acids, and semi-volatile compounds.
Air quality standards for PM in the United States were expressed some decades ago in terms of the mass of total suspended particulate matter (TSP) which represent the sum of all the suspended particles in the atmosphere. The standard was then changed to mass of suspended PM less than 10 µm in size, commonly called PM10, and was more recently was modified to PM less than 2.5 µm in diameter, PM2.5. Particle size distributions of atmospheric PM and chemical compounds in PM are very important with regard to the influence of PM on human health, because particle size controls the deposition behavior of PM in respiratory organ. Coarse particles are mainly deposited in the extrathoracic region, while PM2.5 can reach the pulmonary alveoli (Kawanaka et al., 2008). PM2.5 has greater numbers and greater surface area than PM10 of the same mass, and is generally considered to be more toxic.
2
Numerous studies have found associations between exposure to PM and adverse health effects (Brunekreef and Holgate, 2002; Bernstein et al., 2004; Rojas-Martinez et al., 2007;
Sehlstedt et al., 2007). The health effects of PM are likely to depend on several factors, including the size and composition of the particles, the level and duration of exposure, and age and sensitivity of the exposed person. Symptoms of exposure may include a sore throat, persistent cough, burning eyes, wheezing, shortness of breath and tightness of chest. Chronic exposure to particles contributes to the risk of developing cardiovascular and respiratory diseases as well as lung cancer. Turner et al. (2011) observed a total of 1,100 lung cancer deaths during the 26-year follow-up period. Each 10 µg/m3 increase in PM2.5 concentrations was associated with a 15-27% increase in lung cancer mortality.
1.1.2. Toxicity of polycyclic aromatic hydrocarbons (PAHs) and nitropolycyclic aromatic hydrocarbons (NPAHs)
PM contains many inorganic and organic species, many of which can adversely affect human health. Among them, polycyclic aromatic hydrocarbons (PAHs) and nitropolycyclic aromatic hydrocarbons (NPAHs) are of great concern because of their toxicity (carcinogenicity or mutagenicity) to humans (Ames et al., 1975). PAHs are a group of organic compounds that consist of two or more benzene rings fused together in a variety of ways as linear, angled or clustered structures. NPAHs are nitro-derivatives of PAHs, which contain two or more fused aromatic rings and one or more nitro groups. They are ubiquitous environmental pollutants and form by the incomplete combustion of organic materials. The major sources to the environment include fossil fuel, coal, wood, and industrial processes.
PAHs are emitted directly from combustion sources whereas NPAHs are both primary emitted and secondarily formed by gas phase reactions in the atmosphere (Albinet et al., 2008b).
The International Agency for Research on Cancer (IARC) has classified benzo[a]pyrene (BaP) in Group 1 (carcinogenic to humans), 1-nitropyrene (1-NP) in Group 2A (probably carcinogenic to humans) and 1,3-, 1,6- and 1,8-dinitropyrene (1,3-, 1,6- and 1,8-DNP) in Group 2B (possibly carcinogenic to humans) (IARC, 2013). PAH derivatives such as hydroxylated PAHs (OHPAHs) and quinoid PAHs (PAHQs) also have estrogenic/antiestrogenic or antiandrogenic activities (Kizu et al., 2000; Hayakawa et al., 2011).
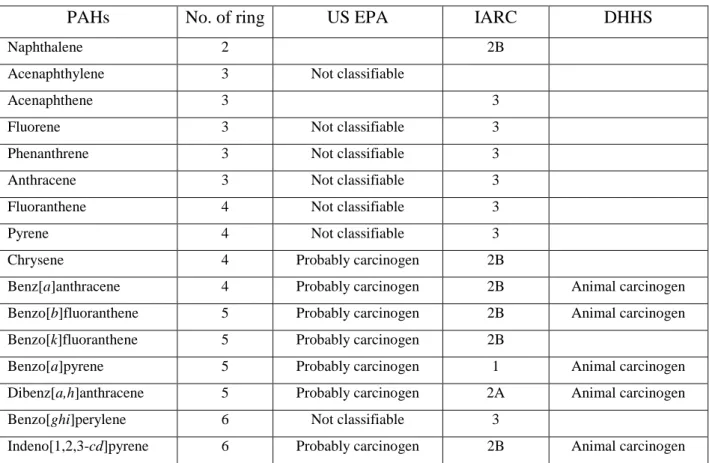
PAHs are classified as carcinogenic materials by many organizations including US EPA, IARC, and the Department of Health and Human Services (DHHS). Table 1.1 shows the
3
carcinogen classification of 16 priority PAHs by the IARC, compared to classifications by the US EPA and DHHS. Many toxicity studies reported that BaP has the highest carcinogenic potency with long-term persistency in the environment. Schulte et al., (1994) found a significant increase in all lung tumors and a dose-dependent increase in malignant lung tumors for mice exposed to PAH-enriched exhausts containing BaP of 0.05 or 0.09 mg/m3. In general, PAHs with high molecular weights are often more carcinogenic than those with low molecular weights (Yang et al., 2005).
Table 1.1. Sixteen priority PAHs were classified by IARC in comparing those by the DHHS and the US EPA.
PAHs No. of ring US EPA IARC DHHS
Naphthalene 2 2B
Acenaphthylene 3 Not classifiable
Acenaphthene 3 3
Fluorene 3 Not classifiable 3
Phenanthrene 3 Not classifiable 3
Anthracene 3 Not classifiable 3
Fluoranthene 4 Not classifiable 3
Pyrene 4 Not classifiable 3
Chrysene 4 Probably carcinogen 2B
Benz[a]anthracene 4 Probably carcinogen 2B Animal carcinogen
Benzo[b]fluoranthene 5 Probably carcinogen 2B Animal carcinogen
Benzo[k]fluoranthene 5 Probably carcinogen 2B
Benzo[a]pyrene 5 Probably carcinogen 1 Animal carcinogen
Dibenz[a,h]anthracene 5 Probably carcinogen 2A Animal carcinogen
Benzo[ghi]perylene 6 Not classifiable 3
Indeno[1,2,3-cd]pyrene 6 Probably carcinogen 2B Animal carcinogen
http://cdn.intechopen.com/pdfs/11767/InTech-Sources_distribution_and_toxicity_of_polyaromatic_hydrocarbons_pahs_in_particulate_matter.pdf
IARC classification: Group 1 (carcinogenic), 2A (probably carcinogenic), 2B (possibly carcinogenic), 3 (not classifiable).
1.1.3. Sources, formation and properties of PAHs
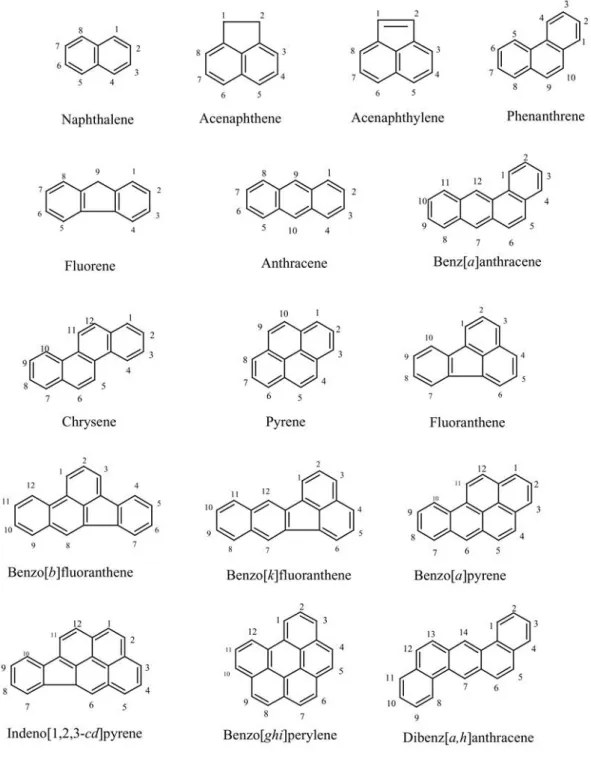
PAHs are emitted to the environment through natural processes (e.g. volcanoes and forest fires) and anthropogenic sources (e.g. burning of wood, vehicles and factories) (Chang et al., 2006 and Ravindra et al., 2008). There are more than 100 different PAHs. PAHs generally occur as complex mixtures (for example, as part of combustion products such as soot), not as single compounds. US EPA has designed 16 PAH compounds as priority pollutants (Fig.
4
1.1). These 16 PAHs were chosen to be included in the priority list because (1) more information is available on these than on the others; (2) they are suspected to be more harmful than some of the others, and they exhibit harmful effects that are representative of the PAHs in general; (3) there is a greater chance for exposure to these PAHs than to the others; and (4) of all the PAHs analyzed, these were the PAHs identified at the highest concentrations at the National Priorities List (NPL) hazardous waste site.
Fig. 1.1. Chemical structure of US EPA 16 PAHs.
5
PAHs may be synthesized from saturated hydrocarbons under oxygen-deficient conditions.
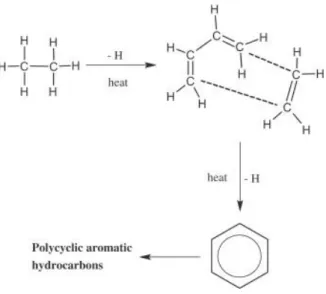
Pyrosynthesis and pyrolysis are two main mechanisms that can explain the formation of PAHs (Ravindra et al., 2008). Low hydrocarbons form PAHs by pyrosynthesis. When the temperature exceeds 500 °C, carbon-hydrogen and carbon-carbon bond are broken to form free radicals. These radicals combine to acetylene which further condenses with aromatic ring structures, which are resistant to thermal degradation. Fig. 1.2 illustrates the formation of such rings starting with ethane. The tendency of hydrocarbons to form PAH structure by pyrosynthesis varies in the order—aromatics > cycloolefins > olefins > parafins (Manahan, 1994). The types of PAHs produced in pyrolysis considerably with temperature. At high temperature and under anaerobic conditions, as in cooking process, the products are relatively simple mixture of low molecular weight PAHs lacking alkyl substituents. At moderate temperature, the product mixtures are more complex containing substantial amounts of alkyl- substituted and unsubstituted PAHs. At low temperature, methyl and other alkyl-substituted polyarenes become predominant products (Harvey, 1998).
Fig. 1.2. Pyrosynthesis of PAHs starting with ethane (Ravindra et al., 2008).
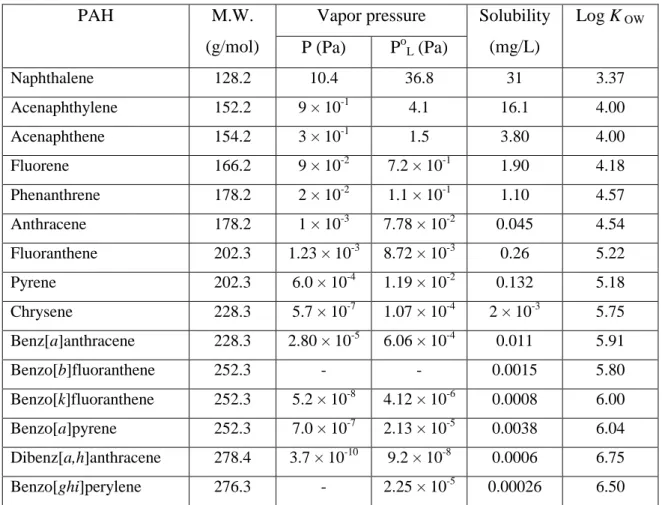
The movement of PAHs in the environment depends on properties such as their solubility in water and their volatility. PAHs have low solubility in water (Table 1.2) as expected from their nonpolar character. These decrease dramatically in going from the 2- and 3-ring PAHs (e.g., naphthalene, with a solubility of 31 mg/L) through the 4-ring semi-volatile compounds (e.g., fluoranthene, with a solubility of 0.26 mg/L) to 5-ring PAHs (BaP, with a solubility of only 0.0038 mg/L). The partitioning of semi-volatile PAHs between gas and particle phases
6
depends on their vapor pressure (Table 1.2) and the ambient temperature (Tsapakis and Stephanou, 2005). PAHs with two or three rings, which have relatively high vapor pressure, are mainly associated with the gas phase. Four ring PAHs exist in both the gas and particle phases whereas PAHs with five rings or more, which have low vapor pressure, are mostly bound to particle.
Table 1.2. Physical-chemical characteristics of some PAHs.
PAH M.W.
(g/mol)
Vapor pressure Solubility (mg/L)
Log K OW
P (Pa) PoL (Pa)
Naphthalene 128.2 10.4 36.8 31 3.37
Acenaphthylene 152.2 9 × 10⁻¹ 4.1 16.1 4.00
Acenaphthene 154.2 3 × 10⁻¹ 1.5 3.80 4.00
Fluorene 166.2 9 × 10⁻² 7.2 × 10⁻¹ 1.90 4.18
Phenanthrene 178.2 2 × 10⁻² 1.1 × 10⁻¹ 1.10 4.57
Anthracene 178.2 1 × 10⁻³ 7.78 × 10⁻² 0.045 4.54
Fluoranthene 202.3 1.23 × 10⁻³ 8.72 × 10⁻³ 0.26 5.22
Pyrene 202.3 6.0 × 10⁻⁴ 1.19 × 10⁻² 0.132 5.18
Chrysene 228.3 5.7 × 10⁻⁷ 1.07 × 10⁻⁴ 2 × 10⁻³ 5.75
Benz[a]anthracene 228.3 2.80 × 10⁻⁵ 6.06 × 10⁻⁴ 0.011 5.91
Benzo[b]fluoranthene 252.3 - - 0.0015 5.80
Benzo[k]fluoranthene 252.3 5.2 × 10⁻⁸ 4.12 × 10⁻⁶ 0.0008 6.00
Benzo[a]pyrene 252.3 7.0 × 10⁻⁷ 2.13 × 10⁻⁵ 0.0038 6.04
Dibenz[a,h]anthracene 278.4 3.7 × 10⁻¹⁰ 9.2 × 10⁻⁸ 0.0006 6.75
Benzo[ghi]perylene 276.3 - 2.25 × 10⁻⁵ 0.00026 6.50
P is Vapor Pressure, PoL is Subcooled Liquid Vapor Pressures, Log KOW is Logarithm of Octanol/Water Partition Coefficient (Pitts and Pitts, 2000).
1.1.4. Sources, formation and properties of NPAHs
NPAHs occur in the environment as a mixture together with parent PAHs and hundreds of other organic compounds. The ambient concentrations of NPAHs are usually much lower than those of PAHs. NPAHs are present in the atmosphere from primary sources and gas- phase reactions of the parent PAHs in the atmosphere. NPAHs are emitted from various primary combustion sources such as diesel exhaust (Paputa-Peck et al., 1983; Schuetzle et al., 1982), gasoline exhaust (Gibson, 1982), coal combustion (Hattori et al., 2007; Tang et al., 2005, 2011) and biomass burning (Ding et al., 2012; Shen et al., 2012).
7
NPAHs directly emitted by combustion sources are formed via electrophilic nitration of PAHs in the presence of nitrogen dioxide (NO2) (Nielsen, 1984). The most abundant NPAH directly emitted from diesel exhaust is 1-nitropyrene (Paputa-Peck et al., 1983; Bamford et al., 2003b). Other NPAHs such as 9-nitroanthracene (Paputa-Peck et al., 1983; Bamford et al., 2003b), 3-nitrofluoranthene and 7-nitrobenz[a]anthracene (Pitts and Pitts, 2000; Bamford et al., 2003b), 6-nitrochrysene, 6-nitrobenzo[a]pyrene (Kawanaka et al., 2008; Zwirner-Baier and Neumann, 1999) and 1,3- , 1,6- and 1,8-dinitropyrene (Bamford et al., 2003b) were also detected in diesel exhaust.
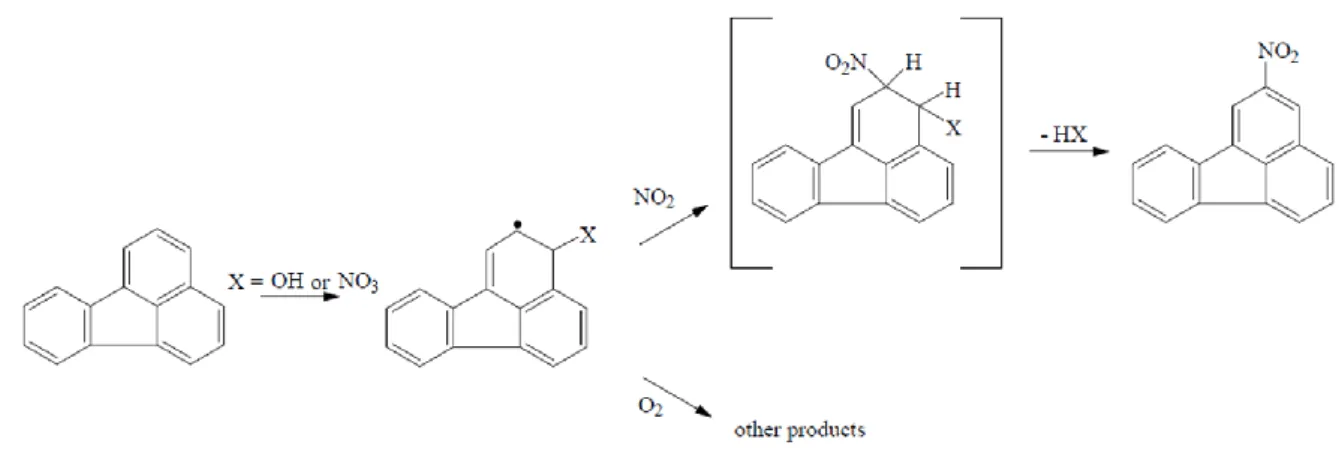
In contrast, gas phase reactions of the parent PAHs are initiated by hydroxyl (OH) radicals during the day and by nitrate (NO3) radicals in the presence of NOx during the night (Arey et al., 1986; Atkinson and Arey, 1994). The radical initiated reactions are postulated to proceed through initial addition of either the OH radical or the NO3 radical to the position with the highest electron density in the PAH molecule (e.g., the one position for pyrene and the three positions of fluoranthene) (Fig. 1.3). This is followed by the addition of NO2 at the ortho- position and subsequent loss of water or nitric acid to form 2-nitrofluoranthene (2-NFR) or 2- nitropyrene (2-NP) (Arey et al., 1986). These two NPAHs have not been identified in diesel exhaust or other combustion products. In addition to gas phase reactions, laboratory studies have reported NPAH production via heterogeneous reactions (Pitts et al., 1985; Kamens et al., 1990).
Fig. 1.3. Gas phase reaction of 2-NFR.
NPAH are more hydrophilic and have lower vapor pressure than their parent PAHs. A part of NPAHs are also volatile or semi-volatile organic compounds. NPAHs with two aromatic rings were detected only in the vapor phase, and three-ring NPAHs were found in both the
8
gas and particle phases in the atmosphere. On the other hand, NPAHs with four or more rings were mainly distributed in particle phase (Dimashki et al., 2000).
The increased attention to NPAHs, particularly in the environmental analytical community, is due to their persistence in the environment and higher mutagenic and carcinogenic properties of certain compounds compared to their parent PAHs (Lewtas et al., 1990; Durant et al., 1996). Although at lower concentrations compared to PAHs, in recent years it has become well-established that certain NPAHs exhibit high direct-acting mutagenic potency in a microbial mutagenicity bioassays (Pitts et al., 1978) and in a forward mutation assay based on human cells (Durant et al., 1996). Furthermore, NPAHs can account for a significant fraction of the direct-acting mutagenic compounds present in extracts of ambient PM (Wang et al., 1980; Pitts et al., 1982), and their persistence in the particle phase may result in human exposure through inhalation. These concerns have stimulated research into the primary sources, fate, and transport of these contaminants in the atmosphere.
1.1.5. Biomass burning
Biomass burning is the largest source of primary PM and the second largest source of trace gases (e.g. NO, NO2, CO, CO2, SO2, NH3, CH4) in the global atmosphere (Yokelson et al., 2011). In addition, it entails the emissions of volatile organic compounds (VOC) and PAHs, many of which are toxic and some known or suspected carcinogens. Biomass burning aerosol may have a significant impact on regional air quality, visibility, cloud processes, human health, global and regional climate (Adler et al., 2011).
The wood combustion process can be summarized briefly as follows. When heating wood, its constituents start to be hydrolyzed, oxidized, dehydrated, and pyrolyzed with increasing temperature to form combustible volatiles, tarry substances, and highly reactive carbonaceous char (Shafizadeh, 1984). At the ignition temperature of the volatiles and tarry substances, exothermic reactions known as combustion begin (Skaar, 1984). Resinous compounds and decomposition products of cellulose, hemicelluloses, and lignin, together with water vapor are stripped off, and then undergo both partial to complete combustion in the flaming zone.
During the flaming combustion, char formation continues until the combustible volatile flux drops below the minimum level required for the propagation of a flame. During the smoldering process, enough heat is produced to propagate the charring process as well as the release of additional volatile wood decomposition products.
Total global PAH emission was estimated to be 520 Gg in 2004, among which 80% was from developing countries and 73.7% was from biofuel and wildfire (Zhang and Tao, 2009).
9
Forest fires are the major type of biomass burning in Southeast Asia (Chang and Song, 2010).
It has caused severe concerns about health effects due to the high PAH content (Simoneit, 2002). Therefore, it is important to assess the level of PAHs and their derivatives from biomass burning.
Water-soluble potassium is a common inorganic tracer for biomass burning source (Duan et al., 2004), but it has also contributions from sea salt and soil dust. In recent year, levoglucosan (1,6-Anhydro-β-D-glucose, LG) are increasingly employed as a marker of biomass burning (Puxbaum et al., 2007; Wang et al., 2007; Lanz et al., 2008). LG originates from the pyrolysis of cellulose and hemicelluloses, the main building material of wood, at temperatures higher than 300oC (Zhang et al., 2008). LG has been considered as an excellent tracer of biomass-burning sources (Puxbaum et al., 2007; Mochida et al., 2010). LG is emitted in large quantities; is stable in the atmosphere; and is specific to the thermal breakdown of cellulose.
1.2. Air pollution in Thailand
Emission of air pollutants in the Southeast Asia region has been rapidly increasing, resulting from population growth, rapidly economic development, and the associated systems of energy consumption and production. The potential for trans-boundary air pollution problems in the region is also greatly due to high emissions and the proximity of many of the major industrial and urban centers such as Bangkok, Hanoi, Kuala Lumpur, Singapore and Jakarta (He et al., 2010). In addition, biomass burning in Southeast Asia occurs in a vast region including Thailand, Vietnam, Indonesia, Malaysia, Philippines, Singapore, Taiwan, Myanmar, Laos and Cambodia (Reid et al., 2013). This biomass burning produces high levels of haze, especially in the dry season (Reid et al., 2013; He et al., 2010). Northern Thailand has been facing air pollution in the dry season almost every year (Chantara, 2012).
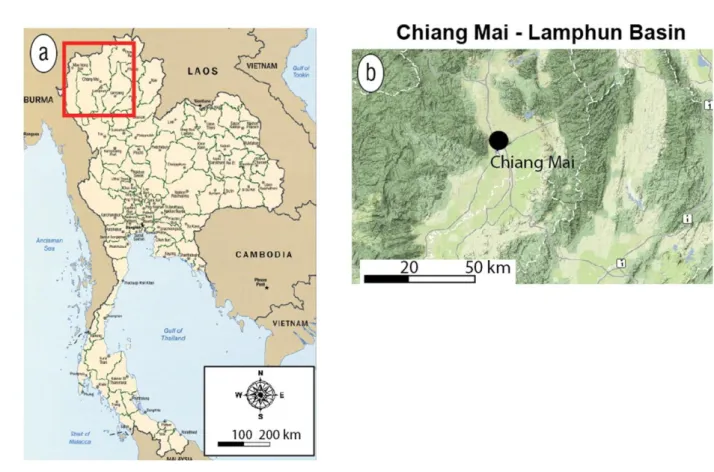
Bangkok is the capital and the most populous city of Thailand. The severe air pollution in Bangkok is mainly due to vehicles and factories. Bangkok is situated in the plain and near the sea promoting air pollutants dispersion. Northern Thailand, especially Chiang Mai has also suffered badly from air pollution due to biomass burning during dry season. Chiang Mai (18°47′ N and 98°59′ E) is the largest city in northern Thailand with a population of more than 1.6 million. It is located in the Chiang Mai–Lamphun basin at a height of 310 m above sea level and covers an area of approximately 20,107 km2 (Fig. 1.4). The geographical and meteorological conditions contribute to the high levels of PM in the air of Chiang Mai (Chantara, 2012; Wiriya et al., 2013). Chiang Mai is located in basin and is surrounded by
10
mountain resulting non-dispersion and accumulation of air pollutants. Haze problem in Chiang Mai has been classified as “serious” and “urgent” by Thai governments since 2003.
Recently, the problem has become worse than ever that affects to human health, environment as well as economy. In the city, the PM10 concentration increases at the beginning of the dry season (December), peaks in March, and decreases by the end of April (Pengchai et al., 2009). During the dry season of the past several years, the daily average concentrations of PM10 often exceeded the Thai ambient air quality standard of 120 µg/m3 (Table 1.3). More importantly, many consecutive days with high PM10 level resulted in haze-related health threats to the residents from February to April every year (Chantara, 2012). Not only biomass burning but also vehicle emissions was expected as the main contributions to the critical levels of air pollutants in Chiang Mai. The Public Health Ministry of Thailand has reported increased respiratory diseases and cardiovascular problems in people living in this area (Pengchai et al., 2009). A research carried out in Bangkok, Chiang Mai, and Tokyo has revealed that the levels of carcinogenic PAHs in Chiang Mai were higher than those in Tokyo and Bangkok (Matsushita et al., 1987).
Fig. 1.4. Map of Chiang Mai and Chiang Mai – Lamphun basin.
11
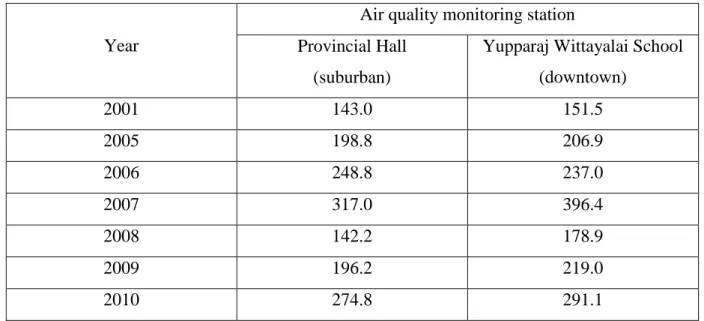
Table 1.3. The highest level of PM10 in Chiang Mai Province.
Year
Air quality monitoring station Provincial Hall
(suburban)
Yupparaj Wittayalai School (downtown)
2001 143.0 151.5
2005 198.8 206.9
2006 248.8 237.0
2007 317.0 396.4
2008 142.2 178.9
2009 196.2 219.0
2010 274.8 291.1
http://aqnis.pcd.go.th/data/yearly
Fig. 1.5. ASRs of lung cancer by region in northern Thailand, 2003-2007, compared to Japan.
*The incidence is in 2008.
The highest incidence of lung cancer has been recognized in the Northern Thailand (Wiwatanadate, 2011). During 2003-2007, the total number of new lung cancers was 15,604 cases, 9,603 in males and 6,001 in females. The Age standardized rates (ASRs) of lung cancer in northern region were higher than those in the entire Thailand (Fig. 1.5). In
38.7
26.8
30.0
36.8
48.4
38.5
13.3 12.1
16.7
24.6 25.4 24.9
0 10 20 30 40 50 60
Japan* Thailand* Northern Chiang Mai Lampang Lamphun
ASR (per 100,000)
Region Male Female
12
particular, Lampang, Lamphun and Chiang Mai were the three highest provinces in this region. The ASR in males of Japan was comparable with those of Chiang Mai and Lamphun but was lower than Lampang. However, the ASRs in females of three provinces are higher than that of Japan. Although smoking is the major cause of lung cancer, this factor alone could not explain the high incidence in northern Thailand. Wiwatanadate (2011) postulated that indoor radon and air pollution might be the other risk factors. Therefore, it is important to assess air pollution and know the level of air pollutants in Chiang Mai.
1.3. Purpose of this study
Chiang Mai and several other provinces in northern Thailand have been annually facing air pollution problems during the dry season. In the season, biomass burning was expected as the main contributors to the critical levels of air pollutants. However, the contribution of biomass burning to PAHs and especially NPAHs remains unclear. This study reports atmospheric levels and distribution profiles of PAHs and NPAHs in Chiang Mai, Thailand, and discusses their possible emission sources and health risks. The results are expected to facilitate air pollution management in northern Thailand.
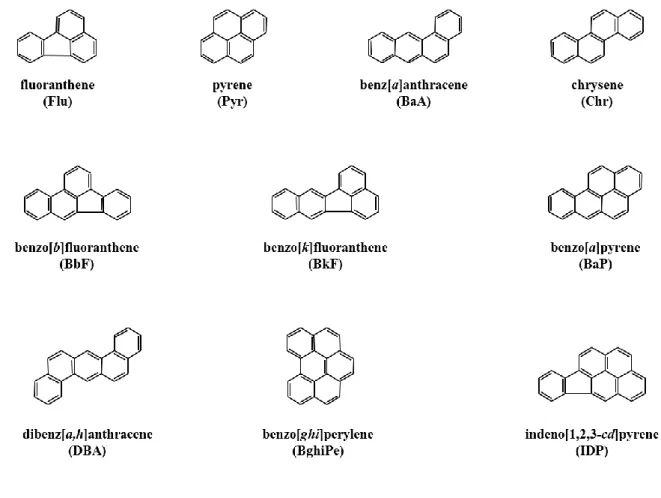
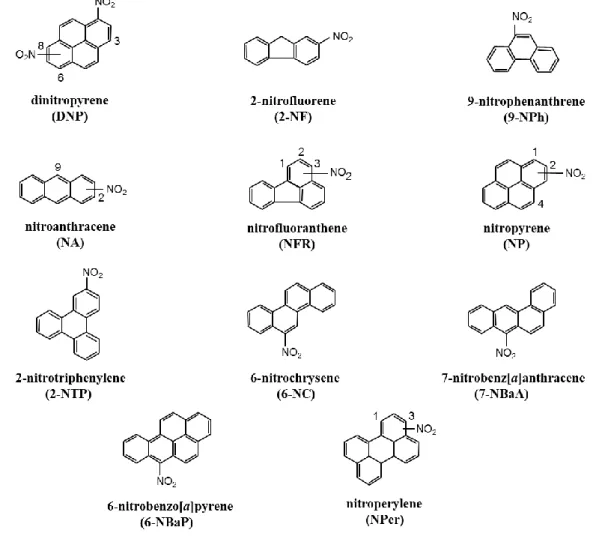
Since the recognized carcinogenic PAHs and NPAHs are mostly associated with particle phase, only particle-bound PAHs and NPAHs were selected for analysis in this study. The structures of 10 PAHs targeted for analysis by this research are shown in Fig. 1.6. In addition, Fig. 1.7 shows the structures of targeted 19 NPAHs.
13
Fig. 1.6. The structures of targeted 10 PAHs in this research.
14
Fig. 1.7. The structures of targeted 19 NPAHs in this research.
15
Chapter 2
Influence of Biomass Burning on the Levels of Atmospheric Polycyclic Aromatic Hydrocarbons and their Nitro Derivatives
in Chiang Mai, Thailand
Air quality in Chiang Mai has become a major concern and has been steadily deteriorating over the past ten years, especially in the dry season. A large amount of PM containing hazardous chemicals was emitted to the atmosphere. The most severe PM pollution was observed in March 2007, with the highest concentration of 383 µg/m3 on March 14, exceeding the 24 h average standard level in Thailand (120 µg/m3). The number of patients with respiratory problems recorded in 23 Chiang Mai public hospitals was significantly larger in March 2007 than that in March 2006 and March 2008 (CMPHO, 2008).
In recent years, increasing attention has been paid to PAHs and NPAHs because of their toxicity (carcinogenicity or mutagenicity) to humans (Ames et al., 1975). Atmospheric PAH levels and their sources in Thailand were reported in several previous studies. In Bangkok, vehicle emissions were identified as the major source of PAHs in urban areas (Kim Oanh et al., 2000; Boonyatumanond et al., 2007). In Chiang Mai, nearly all studies found PAHs in the ambient air of urban areas, and the diagnostic ratios revealed that vehicle emissions might be the main source of PAHs (Chantara and Sangchan, 2009; Pengchai et al., 2009).
Although NPAHs are generally present at low concentrations in the atmosphere compared to their parent PAHs (Feilberg et al., 2001; Bamford and Baker, 2003a), they have been recognized as direct-acting mutagens and carcinogens, which are more toxic than their parent PAHs (Durant et al., 1996; Albinet et al., 2008a). Thus, the analysis of NPAHs in emission sources and in ambient air is important. Atmospheric NPAHs have been reported in Europe (Dimashki et al., 2000; Feilberg et al., 2001), USA (Zielinska et al., 1989; Bamford and Baker, 2003a), and East Asia (Tang et al., 2005; Hayakawa et al., 2007). However, few studies have been conducted in Southeast Asia, Singapore (Ang et al., 1987), and Vietnam (Hien et al., 2007; Pham et al., 2012). To the best of our knowledge, there have been no reports on atmospheric NPAH concentrations in Thailand.
The purpose of this study is to investigate the occurrence and profiles of PAHs and NPAHs in Chiang Mai, to understand the emission sources and to assess health risks. Chiang Mai should be a representative sampling site to assess the air pollution in northern Thailand that
16
has similar geography and situation. The results are expected to facilitate air pollution management in northern Thailand.
2.1. Methods
2.1.1. Sampling
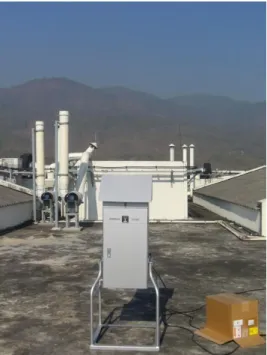
PM samples were collected at the rooftop of a nine-story building at the Faculty of Science in Chiang Mai University (ca. 32 m in height). The sampling location as a representative sampling site to assess the general air pollution in Chiang Mai was chosen by avoiding the direct effects of particular sources such as vehicle exhaust and biomass burning. The site is about 4 km away from the downtown area, is far from roads with heavy traffic and is surrounded by student housing (Fig. C). According to the Chiang Mai Provincial Land Transport Office, the average number of registered gasoline and diesel engine vehicles in Chiang Mai in 2010 was 5,069,466 (78.5%) and 1,391,066 (21.5%), respectively. Total suspended particulates (TSP) were collected using quartz fiber filters (2500QAT-UP, Pall, NY, USA) and a high-volume air sampler (Model HV700F, Sibata Sci. Tech., Saitama, Japan) at a flow rate of 700 L/min for 23 h (Fig. 2.1). We collected samples for seven consecutive days during the dry season [Feb 24–March 2, March 24–30, and April 24–30], the transition period (May 17–23), and the wet season [Aug 21–27 and Sept 8–14] of 2010.
For the wet season, there were 6 and 7 rainy days in Aug and Sept, respectively. The filters were equilibrated in desiccators at room temperature for at least 24 h and weighed before and after sample collection. The filters were stored at −20°C for six months until analyzed.
17
Fig. 2.1. High volume air sampler.
2.1.2. Reagents
The EPA 610 PAH mixture including fluoranthene (Flu), pyrene (Pyr), benz[a]anthracene (BaA), chrysene (Chr), benzo[b]fluoranthene (BbF), benzo[k]fluoranthene (BkF), BaP, dibenz[a,h]anthracene (DBA), benzo[ghi]perylene (BghiPe), and indeno[1,2,3-cd]pyrene (IDP) was purchased from Sigma–Aldrich (St. Louis, MO, USA). 2-Nitrofluorene (2-NF); 2- and 9-nitroanthracene (2- and 9-NA); 1-, 2-, and 4-nitropyrene (1-, 2-, and 4-NP); 2- nitrotriphenylene (2-NTP); 2- and 3-nitrofluoranthene (2- and 3-NFR); 3-nitroperylene (3- NPer); 1,3- and 1,6-dinitropyrene (1,3- and 1,6-DNP); and LG and N,O-Bis(trimethylsilyl) trifluoroacetamide (BSTFA) with 1% trimethylchlorosilane (TMCS) as a silylating agent were also supplied by Sigma–Aldrich. 1,8-Dinitropyrene (DNP), 1-nitrofluoranthene (1- NFR), 6-nitrochrysene (6-NC), 7-nitrobenz[a]anthracene (7-NBaA), 6-nitrobenzo[a]pyrene (6-NBaP), and 1-nitroperylene (1-NPer) were obtained from Chiron AS (Trondheim, Norway). 9-Nitrophenanthrene (9-NPh) was purchased from AccuStandard, Inc. (New Haven, CT, USA). Two deuterated PAHs (BaA-d12 and BaP-d12), 6-nitrochrysene-d11 (6-NC- d11), and LG-13C6 were obtained from the Cambridge Isotope Lab. Inc. (Andover, MA, USA).
All solvents and other chemicals were high performance liquid chromatography (HPLC) or analytical-reagent grade.
18 2.1.3. Sample preparation
A quarter of the filter samples was thoroughly cut into small pieces and placed in a flask.
After adding the internal standard (BaA-d12, BaP-d12, 6-NC-d11, and LG-13C6) to correct analytical variability, the cut filters were ultrasonically extracted twice with 40 mL of dichloromethane (DCM) for 20 min. The extract was passed through a filter paper. After adding 100 µL of dimethyl sulfoxide (DMSO) into the combined extract, centrifugal evaporation was carried out until the DCM was completely evaporated. The resulting DMSO solution was mixed with 900 µL of ethanol, and the solution was then filtered through a membrane filter (HLC-DISK 3 with pore size of 0.45 µm, Kanto Chemical Co., Inc., Tokyo, Japan). A 20 µL and 100 µL aliquot of the filtered solution was subjected to HPLC for detecting PAHs and NPAHs, respectively. For LG analysis using GC-MS, the derivatization of LG was carried out according to a reported method with minor modifications (Hsu et al., 2007). An adequate volume (10 µL) of the ethanol extract was evaporated to dryness, and then the residue was derivatized by adding 10 µL of pyridine, 10 µL of 1,4-dithioerythritol (5 mM), 20 µL of silylating agents and 50 µL of toluene. The reaction mixture was heated at 80oC for 60 min. After cooling, 10 µL of 1-phenyldodecane (0.1 mM) as a syringe spike was added to the derivatized solution.
2.1.4. Analysis
The 10 PAHs were determined by using HPLC with fluorescence detection (HPLC-FL) without modification (Toriba et al., 2003). The system consisted of two HPLC pumps (LC- 10A), a fluorescence detector (RF-10A), a system controller (SCL-10A), a degasser (DGU- 14A), an auto sample injector (SIL-10A) and a column oven (CTO-10AS) (all from Shimadzu, Kyoto, Japan). PAHs were separated using a guard column (Inertsil ODS-P, 10 × 4.0 mm i.d., 5µm, GL Sciences, Tokyo, Japan) and an analytical column (Inertsil ODS-P, 250
× 4.6 mm i.d., 5µm, GL Sciences) with acetonitrile/water gradient and fluorescence detection (Fig. 2.2).
19 Fig. 2.2. HPLC-FL system for PAHs analysis.
The 19 NPAHs were analyzed using HPLC with chemiluminescence (CL) detection. The system consists of five HPLC pumps (LC-20AD), a system controller (CBM-20A), a degasser (DGU-20A5), an auto sample injector (SIL-20AC), a column oven (CTO-20AC) (all from Shimadzu, Kyoto, Japan), and a CL detector (S-3400, Soma Optics Ltd., Tokyo, Japan). The NPAHs were purified using a clean-up column (Cosmosil πNAP, 50 mm × 4.6 mm i.d. 5µm, Nacalai Tesque, Kyoto, Japan) with its guard column (10 mm × 4.6 mm i.d.), and were then reduced to their amino derivatives by using a reduction column (NPpak-RS, 10 mm × 4.0 mm i.d. JASCO, Tokyo, Japan) under 80°C. The mobile phase in the clean-up and reduction columns was acetate buffer (pH 5.5)–ethanol (5/95, v/v) at a flow rate of 0.2 mL/min. Only a fraction of the amino derivatives was trapped on the concentration column (Spheri-5 RP-18, 30 mm × 4.6 mm i.d. 5 µm, Perkin Elmer, MA, USA) by using a switching
20
valve. The concentrated fraction was applied to two separation columns (Cosmosil 5C18-MS- II, 150 mm × 3.0 mm i.d. 5 µm and Cosmosil 5C18-AR-II, 250 mm × 3.0 mm i.d. 5 µm, both from Nacalai Tesque) in tandem. All columns, except for the reduction column, were maintained at 20°C. The mobile phase in the separation columns was a gradient elution of 10 mM imidazole buffer (pH 7.6) and acetonitrile at a flow rate of 0.5 mL/min. The eluted fraction from the separation columns was mixed with the CL reagents and detected by the CL detector. The CL reagent solutions were acetonitrile solutions containing 0.02 mM bis(2,4,6- trichlorophenyl)oxalate and 15 mM hydrogen peroxide at a flow rate of 0.5 mL/min (Fig.
2.3).
The HPLC system was carried out by using the procedure described in a previous study with some modifications (Tang et al., 2005). To improve selectivity for NPAHs, the clean-up column was changed from a basic column with octadecyl silica (ODS) to the column (πNAP) with naphtylethyl group bonded silica. Ethanol percentage in the mobile phase for the clean- up and reduction column increased with the change of the clean-up column. The combination of a monomeric ODS column (Cosmosil 5C18-MS-II) and a polymeric ODS column (Cosmosil 5C18-AR-II) enabled us to separate 2-NFR and 2-NP. To decrease acetonitrile consumption, we used the separation columns with smaller internal diameter than the previous paper and decreased the flow rates of the mobile phase for the separation columns and of the CL reagent.
LG analysis was carried out according to a reported method with minor modifications (Hsu et al., 2007). The derivatized samples were applied to gas chromatography coupled with mass spectrometry (GC-MS). The Agilent 6890N Network Gas Chromatograph was fitted with a DB-5MS column (30 m × 250 µm i.d., 0.25 µm film thickness). The Agilent 5975B inert MSD mass spectrometer was operated in electron impact mode (EI). Helium was used as the carrier gas, at a flow rate 1.0 mL/min. The injector temperature was set at 250°C. The column temperature was programmed as follows: initial temperature of 70°C, hold for 1 min, ramp at 20.0°C/min to 300°C, hold for 2 min. The MS ion source temperature was set at 230°C. The derivatized LG was injected 1 µL, under splitless mode. LG quantification was performed in selected ion monitoring mode (SIM), with specific fragment ions at m/z 333.
21 Fig. 2.3. HPLC-CL system for NPAHs analysis.
22
Table 2.1. Meteorological parameters, and concentrations of collected PM and forest fires.
Meteorological conditions a, b TSP a Forest fire c
Temperature (°C)
Pressure (hPa)
Relative humidity (%)
Wind speed (km/h)
Precipitation
(mm) (µg/m3)
Frequency (time)
Burned area (km2) Feb 25.5 ± 0.4 1013.6 ± 1.4 43.6 ± 3.9 18.8 ± 3.6 0.0 ± 0.0 93.5 ± 19.6 991 11.50 March 28.2 ± 0.7 1013.9 ± 2.0 51.0 ± 5.4 30.2 ± 13.9 0.0 ± 0.0 125.0 ± 37.6 659 7.05 April 30.8 ± 0.7 1013.0 ± 1.0 51.4 ± 3.3 38.7 ± 16.3 0.5 ± 0.9 80.8 ± 9.4 371 4.31
May 30.6 ± 0.8 1010.2 ± 1.1 60.0 ± 4.3 28.3 ± 5.9 0.3 ± 0.7 27.5 ± 5.5 14 0.11
Aug 26.8 ± 1.0 1009.4 ± 1.3 82.3 ± 7.1 20.4 ± 5.9 12.7 ± 15.0 25.1 ± 6.4 No data d No data Sept 26.8 ± 1.7 1010.4 ± 1.1 81.6 ± 7.2 29.9 ± 7.4 15.9 ± 13.7 22.0 ± 5.1 No data No data
a All meteorological and TSP data represent mean ± SD during the sampling period (7 days/month).
b Data from the Northern Meteorological Center; http://www.cmmet.tmd.go.th/index1.php
c Monthly forest fires in Chiang Mai and Lamphun in 2010: Data from the Protected Area Regional Office 16, Natural Park, Wildlife and Plant Conservation Department, Thailand.
http://www.fca16.com/upload/files/forestfire/09022556.pdf
d It means almost 0.
23 2.2. Results and discussion
2.2.1. Ambient concentrations of TSP
Meteorological conditions during the sampling period (7 days/month) and the concentrations of the collected TSP are shown in Table 2.1. As shown in Table 2.1 and Fig.
2.4, the TSP concentrations in the dry season (Feb–April) were considerably higher than those in the wet season (Aug–Sept), which is in agreement with previous study in Chiang Mai (Pengchai et al., 2009). This distinctly high concentration of PM in the dry season has been recognized as a unique seasonal pattern in northern Thailand. The TSP concentrations of this study were correlated with real-time PM10 at Provincial Hall in suburban (r = 0.888, p < 0.01) and Yupparaj Wittayalai School in downtown (r = 0.900, p < 0.01) sites from the Pollution Control Department (PCD), Ministry of Natural Resources and Environment, Thailand (Fig.
C.). The PM10 concentrations during the 7-day sampling period at the PCD monitoring sites showed similar transition of the concentrations to their monthly PM10 data (Table C).
Therefore, the chosen sampling site can be used to assess the general air quality in Chiang Mai. The elevated PM concentrations during the dry season are attributed to (a) extensive biomass burning due to forest fires and agricultural activities under dry climate conditions, (b) stable meteorological conditions, and (c) the geographical features of Chiang Mai- Lamphun basin surrounded by mountains (Fig. C) (Chantara, 2012). In 2010, the frequency of forest fires and the burned area in Chiang Mai and Lumphun were particularly high in the dry season (Table 2.1). Although farmers burn agricultural debris to prepare the land for cultivation after harvesting, a research concerning biomass open burning using remote sensing data indicated that the amount of burned biomass from forest fires in Thailand (58,880,000 tons) was significantly higher than that from agricultural burning (866,368 tons) (Garivait, 2008). Emission inventory conducted by the Pollution Control Department for the city of Chiang Mai (Muang district) in 2000 showed that 700 tons of the total PM were emitted, of which 89% came from forest fires, 5.4% from solid waste burning, 2.6% from mobile sources, 2.3% from agriculture residue field burning, 0.08% from industry and 0.56%
from other sources (Kim Oanh and Leelasakultum, 2011). The stagnant air resulting from high air pressure, calm winds, and a vertical temperature inversion, as well as low levels of precipitation, is responsible for the scarce dispersion and prolonged suspension of PM containing atmospheric pollutants in the atmosphere. The basin architecture also promotes the accumulation of PM during the dry season.
24 Fig. 2.4. Monthly concentration of TSP (mean ± SD).
2.2.2. Ambient concentrations of PAHs
In this study, we focused on 10 PAHs that have four to six rings and are distributed mostly in the particle phase, and on the 16 PAHs identified as priority pollutants by US EPA. The mean concentrations of the total and individual PAHs in the TSP samples are shown in Table 2.2. As shown in Fig. 2.5, a clear seasonal variation in PAH concentrations was observed over the study period, with significantly higher concentrations in the dry season (Feb >
March > April) than in the wet season (Aug and Sept). The total atmospheric PAH concentrations in Chiang Mai were lower than those measured in Bangkok, Thailand (Boonyatumanond et al., 2007), and Ho Chi Minh City and Hanoi, Vietnam (Hien et al., 2007; Pham et al., 2012) (Table D). The chosen sampling site was located in a suburban area and was away from public roadways, whereas the previously reported sampling sites were located in urban areas with high traffic density, resulting in sampling sites closer to PAH sources than this study.
0 20 40 60 80 100 120 140 160 180
Feb March April May Aug Sept
TSP (µg/m3)
Month
Dry Transition Wet