熊本大学学術リポジトリ
Ppastic deformation of beams i steel
moment‑resistant frames subjected to strong earthquakes
journal or
publication title
Proccedings of 4th International Conference on Advances in Steel Structures
volume 1
page range 203‑208
year 2005‑06
その他の言語のタイ トル
強地震動を受ける鋼モーメント抵抗骨組における梁 部材の塑性変形
URL http://hdl.handle.net/2298/11389
PLASTIC DEFORMATION OF BEAMS IN STEEL MOMENT-RESISTANT FRAMES SUBJECTED
TO STRONG EARTHQUAKES
NAKAHARA Hiroaki
1, YAMANARI Minoru
2and OGAWA Koji
21
Graduate School of Science and Technology, Kumamoto University
2
Department of Architecture, Faculty of Engineering, Kumamoto University 2-39-1 Kurokami, Kumamoto 860-8555 Japan
ABSTRACT
This study is concerned with the demand for ductility of beams in steel moment-resistant frames. Numerical response analysis was carried out for 15 frames against a variety of ground motions. This paper describes the magnitude of plastic deformation introduced into beam-ends. The purpose of this study is to deduce the demand for ductility of beams. Maximum plastic rotation, maximum increment of plastic rotation during a half-cycle of vibration, and the range of variable plastic rotation are considered as the parameters that repre- sent the magnitude of plastic deformation. The results are summarized as formulas to predict those param- eters based on maximum story drift angles.
KEYWORDS
Beams, steel moment-resistant frames, earthquake response, maximum plastic rotation, maximum story drift angles, ductility demand, performance-based design
1. INTRODUCTION
The Hyogoken-Nanbu (Kobe) earthquake (1995) caused serious damage to modern steel building struc- tures. Among various types of damage observed, fractures at welded beam-to-column connections in mo- ment-resistant frames posed one of the most serious concerns for the structural engineering community.
This had led to urgent research efforts on quantification of (plastic) rotations demanded of beam-ends and beam-to-column connections when steel moment frames are subjected to large earthquakes. Performance- based design has also been explored extensively since those earthquakes. Therefore, it is considered that specifying maximum story drift angles as a desired value of the design at first stage of the design will be common in the future.
It is obvious that various structural properties such as building height, strength and stiffness distributions
along the height, column-to-beam relative strength, also significantly affect earthquake responses (maxi-
mum story drifts and beam rotations of steel moment frames). However, if the relationship between maxi-
mum story drift angles and the plastic deformation introduced into beam-ends can be clarified, the demand
for ductility of beams can be known at the stage that maximum story drift angles was specified. Then, in this
study, based on the result of earthquake response analysis for row-and-middle rise standard steel moment- resistant frames, the authors determined the relationship between maximum story drift angles and the plastic deformation introduced into beam-ends.
2. OUTLINE OF ANALYSIS
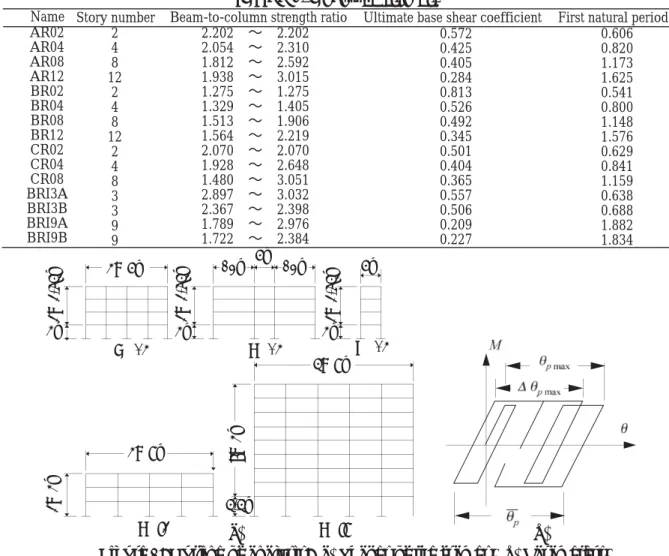
Analyzed frames are shown in TABLE 1. All frames are steel moment-resistant frames consisting of rectan- gular hollow section steel columns and wide-flange steel beams. The shapes of the frames are shown in Figure 1(a). There are two-, eight-, and twelve-story frames in AR and BR besides four-story frame shown in figure 1(a). These frames are the same in the number of spans and span length. There are two-, and eight- story frames in CR besides four-story frame shown in figure 1(a). These frames are also the same in the number of spans and span length. There are two kinds of frames, A and B, in BRI3 and BRI9. These frames are the same in the number of story, story height, in the number of spans, and span length, respectively, but different a designer.
Suites of ground motions used in the FEMA/SAC project (3) were used for the dynamic response analysis of the frames. They were the two sets of 20 records that represent probabilities of excess of 10 and 2 per cent in 50 years in the U.S. Los Angeles area, denoted as the 10/50 and 2/50 record sets.
A program code developed by the third author Ogawa was used for the analysis. In this study, three values shown in Figure 1(b) were chosen as the parameters that represent the magnitude of plastic deformation of beams. That is, maximum plastic rotation ( θ
p max), maximum increment of plastic rotation during a half- cycle of vibration ( ∆ θ
p max), and the range of variable plastic rotation ( θ
p). However, in this study, maxi- mum plastic rotation ( θ
p max) is considered to be the most important parameter, and responses are arranged about beam-ends occurred the largest maximum plastic rotation among beam-ends in each story in each analysis.
TABLE 1. Analyzed frames.
Figure 1: Outline of analysis: (a) Shapes of the frames, (b) Parameters.
(a) (b)
Name Beam-to-column strength ratio AR02
AR04 AR08 AR12 BR02 BR04 BR08 BR12 CR02 CR04 CR08 BRI3A BRI3B BRI9A BRI9B
2 4 8 12
2 4 8 12
2 4 8 3 3 9 9
0.572 0.425 0.405 0.284 0.813 0.526 0.492 0.345 0.501 0.404 0.365 0.557 0.506 0.209 0.227
0.606 0.820 1.173 1.625 0.541 0.800 1.148 1.576 0.629 0.841 1.159 0.638 0.688 1.882 1.834 2.202 〜 2.202
2.054 〜 2.310 1.812 〜 2.592 1.938 〜 3.015 1.275 〜 1.275 1.329 〜 1.405 1.513 〜 1.906 1.564 〜 2.219 2.070 〜 2.070 1.928 〜 2.648 1.480 〜 3.051 2.897 〜 3.032 2.367 〜 2.398 1.789 〜 2.976 1.722 〜 2.384
Story number Ultimate base shear coefficient First natural period
AR04 BR04 CR04
BRI3 BRI9
4@6m 12m 6m
12m 6m
5@9m 4m
4@9m
3@4m 5.5m 8@4m
4m [email protected] 4m [email protected]
[email protected]
3. RELATIONSHIP BETWEEN R
maxAND θ
p max3.1 Maximum plastic rotation θ
p maxThe relationship between a mean value of maximum story drift angles above and below each floor level ( R
max) and maximum plastic rotation ( θ
p max) is shown in Figure 2. According to Figure 2, R
maxis almost upper limit of θ
p max. Especially, in large deformation region, it is recognized that R
maxtends to become good approximate values of θ
p max. On the other hand, in the range that R
maxis less than about 0.02, θ
p maxis very scattered and although R
maxtends to become upper limit of θ
p max, R
maxcannot become the approxi- mate values of θ
p max. On the basis of a method proposed in a Reference (1), in the range that R
maxis comparatively small,
preθ
p max(approximate values of θ
p max) should be expressed by using R
max.
pre
θ
p max= 3
2 ( R
max– R
y) (1)
In which R
yis the story drift angles when plastic hinges are first formed at beam-ends under an earthquake.
Eqn.1 is introduced by the assumption that deformations progress in a state that plastic hinges are formed at only one end of beams. If the deformations become large and plastic hinges are formed at both ends of beams, although Eqn.1 cannot be used, θ
p maxis able to be approximated by R
maxin the range that R
maxis large as shown in Figure 2. The approximate values of the largest maximum plastic rotation in each story (
preθ
p max) are able to be expressed.
pre
θ
p max= min { 3
2 ( R
max– R
y) , R
max} (2)
The relationship between the approximate values (
preθ
p max) and responses ( θ
p max) is shown in Figure 3.
According to Figure 3, the relationship between the approximate values of Eqn.2 (
preθ
p max) and responses ( θ
p max) is settled in the narrow band. In addition, although not shown in Figure 2, 3, the largest values in each story of analysis results ( θ
p max) were almost occurred by negative bending that upper flanges are
Figure 2: Relationship between R
maxand θ
p max: (a) 10/50; (b) 2/50.
Figure 3: Relationship between
preθ
p maxand θ
p max: (a) 10/50, (b) 2/50.
0.04 0.03 0.02 0.01
0 0 0.01 0.02 0.03 0.04 0.1 0.08 0.06 0.04 0.02 0
0 0.02 0.04 0.06 0.08 0.1
(a) (b)
0.04 0.03 0.02 0.01
0 0 0.01 0.02 0.03 0.04 0.1 0.08 0.06 0.04 0.02 0
0 0.02 0.04 0.06 0.08 0.1
(a) (b)
subjected to tension force. The case that plastic rotation of positive bending that bottom flanges are sub- jected to tension force was greater than plastic rotation of negative bending was only 20 analysis results among 3600 all analysis results. As the cause that plastic rotation of negative bending was greater than plastic rotation of positive bending, effects of bending moment occurred by static vertical load are consid- ered.
3.2 Maximum story drift angles of positive bending
Most of maximum plastic rotation ( θ
p max) examined for the foregoing paragraph is the maximum plastic rotation of negative bending ( θ
p–max).
θ
p max ~θ
p–max(3) On the other hand, many of brittle fractures at beam-ends observed in the Hyogoken-Nanbu (Kobe) earth- quake were occurred at the bottom flanges, which are considered by positive bending. Here the relationship between the largest values in each story of plastic rotation of the negative bending ( θ
p–max) and the largest values in each story of plastic rotation of positive bending ( θ
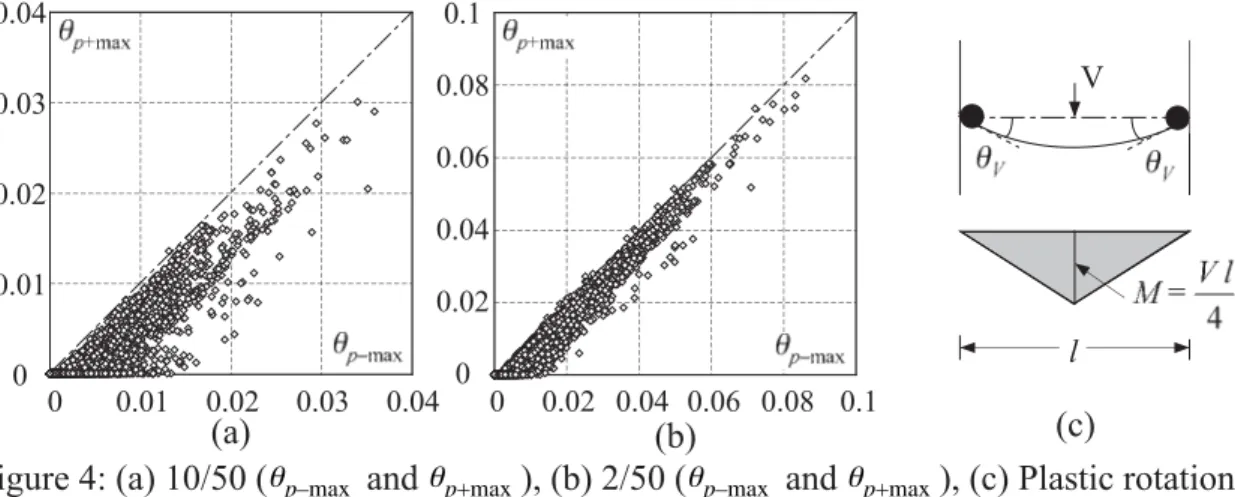
p+max) is examined. However, although the reasons that the brittle fractures at beam-ends tend to occur at the bottom flanges are effects of floor slabs, in this analysis, effects of floor slabs on beam stiffness and strength are neglected. The relationship between
θ
p–maxand θ
p+maxin each story in all analysis results is summarized in Figure 4(a), (b). Although it is obvious that θ
p–maxtends to become larger than θ
p+maxas shown in Figure 4(a), (b), even if θ
p+maxbecomes large, it is not recognized that the difference of θ
p–maxand θ
p+maxextends.
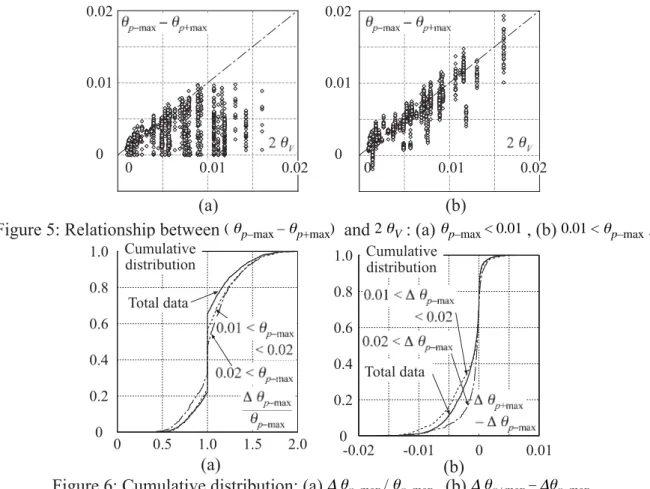
If plastic deformations occurred at both ends of beams under concentrated loading are assumed to corre- spond to the rotation of a simple beam ( θ
V) as shown in Figure 4(c). Namely,
θ
V= V l
2