AAPS PharmSciThech
BRIEF TECHNICAL NOTE
Brain microdialysis study of vancomycin in the cerebrospinal fluid after intracerebroventricular administration in mice
Yusuke Miura, Yuki Fuchigami, Sakiko Nomura, Koyo Nishimura, Masayori Hagimori and Shigeru Kawakami*
Department of Pharmaceutical Informatics, Graduate School of Biomedical Sciences, Nagasaki University, 1-7-1 Sakamoto, Nagasaki-shi, Nagasaki 852-8588, Japan
Running head
PK of vancomycin after i.c.v. injection
*Corresponding author: Shigeru Kawakami
Address: 1-7-1 Sakamoto, Nagasaki-shi, Nagasaki 852-8588, Japan E-mail: [email protected]
Phone: +81-95-819-8563
Fax: +81-95-819-8563
Brain microdialysis study of vancomycin in the cerebrospinal fluid after intracerebroventricular administration in mice
Abstract
Vancomycin (VCM) is an important antibiotic for treating methicillin-resistant Staphylococcus aureus (MRSA) infections. To treat bacterial meningitis caused by MRSA, it is necessary to deliver VCM into the meninges, but the rate of VCM translocation through the blood-brain barrier is poor. Additionally, high doses of intravascularly (i.v.) administered VCM may cause renal impairments. Thus, VCM is sometimes administered intracerebroventricularly (i.c.v.) for clinical treatment.
However, information on the VCM pharmacokinetics in cerebrospinal fluid (CSF) after i.c.v. administration is lacking. In the present study, we evaluated the VCM
pharmacokinetics in the CSF and systemic circulation after i.c.v. compared to that after i.v. administration, using the brain microdialysis method in mice. VCM administered via i.c.v. showed a highly selective distribution in the CSF, without migration to
systemic circulation. Moreover, to assess renal impairments after i.c.v. administration of VCM, we histologically evaluated damage to the mouse kidney by hematoxylin and eosin staining. No significant morphological change in the kidney was observed in the i.c.v. administration group compared to that in the i.v. administration group. Our results demonstrate that i.c.v. administration of VCM can be partially prevented from entering the systemic circulation to prevent renal impairments caused by VCM.
Keywords
intracerebroventricular administration; vancomycin; microdialysis; pharmacokinetics
Introduction
Vancomycin (VCM) is an antibiotic specifically used to treat methicillin-resistant Staphylococcus aureus (MRSA) infections. For bacterial meningitis caused by MRSA, it is necessary to deliver VCM into the meninges. In contrast, patients are often
administered VCM intravenously (i.v.). However, the rate at which VCM translocates into the brain is low, with only 1–5% of VCM delivered into the cerebrospinal fluid (CSF) because of the blood-brain barrier (BBB) (1,2). Additionally, increasing the i.v.
dosage to improve CSF translocation can increase the risk of renal impairments, a common adverse event associated with VCM (3–6). Therefore, intracerebroventricular (i.c.v.) injection of VCM can be used for selective administration into the CSF to avoid the poor translocation through the BBB. It has been reported that i.c.v. injection of VCM is safe and effective for treating bacterial meningitis caused by MRSA (1).
However, few studies have examined the pharmacokinetics of VCM in the CSF after i.c.v. administration.
We have been studying a brain microdialysis method (7) and clarified the time-course brain pharmacokinetics after active delivery (8). In the present study, we hypothesized that microdialysis can be used to evaluate the effectiveness and the relationship between pharmacokinetics and nephrotoxicity of i.c.v. injection of VCM.
We assessed the time-course pharmacokinetics of VCM in the CSF after i.c.v. injection and compared the results to those for i.v. injection. To assess the risk of renal
impairment, we examined the time-course blood concentration of VCM after i.c.v. and i.v. injection. Moreover, we evaluated renal impairment after one-week administration of VCM by hematoxylin and eosin (HE) staining.
Material and Methods Animals
Male ddY mice (27–34 g) (Japan SLC, Shizuoka, Japan) were raised in a breeding room (12-h light-dark cycle; 25 ± 1°C) with free access to feed and water. All experiments were executed under the Regulations of the Animal Care and Use Committee of Nagasaki University.
Drug preparation
VCM hydrochloride (Wako Pure Chemical Industries, Osaka, Japan) was dissolved in artificial cerebrospinal fluid (aCSF) (for i.c.v. injection) or saline (for i.v. injection) and administered to mice at 30 mg/kg. To evaluate renal impairment after one-week
administration, 100 mg/kg of VCM in aCSF (i.c.v. injection) or saline (i.v. injection) was used.
Brain microdialysis
Brain microdialysis was performed as our previous report (8). After fixation of mice, A-I-4-01 probe (Eicom Corporation, Kyoto, Japan) with a 1-mm and 50-kDa-cutoff regenerated cellulose membrane was inserted into the left lateral ventricle of mice (coordinate: A, –0.3; L, +1.0; H, –3.2 mm from Bregma). After 60-min stabilization, VCM was administered (i.c.v. or i.v.) at 30 mg/kg. The VCM recovery rate of the probes from standard solution was 0.52 ± 0.18% (n=10).
Blood sampling and preparation
Blood was mixed with 1.25 U/µL of heparin sodium (Mochida Pharmaceutical, Tokyo, Japan) (1:1, v/v %) and centrifuged at 1000 ×g (4°C). The mixture of 60 µL of plasma (three-fold diluted with saline) and 120 µL of methanol (Kanto Chemical, Tokyo, Japan) were centrifuged at 2000 ×g (4°C). The supernatant was analyzed by high-performance liquid chromatography with ultraviolet detection (HPLC-UV) analysis.
Histological evaluation of mice kidney
VCM was administered (i.c.v. or i.v.) at 100 mg/kg to mice 7 times at 24-h intervals.
Twenty-four hours after the final administration, HE staining was performed on sliced kidneys.
HPLC analysis
The HPLC system consisted as previously reported (8). Detection wavelength was set at
205 nm (10). VCM was separated in a mixture of 50 mM phosphate ammonium buffer
(pH 2.2) and acetonitrile (88:12, v/v %) at a flow rate of 0.36 mL/min, using Wakopak
Handy-ODS column (Wako Pure Chemical Industries).
Pharmacokinetic parameters and statistical analysis
Pharmacokinetic parameters were calculated by moment analysis. Statistical analysis was executed with JMP
®Pro 11.2.0 (SAS Institute, Cary, NC). P<0.05 was considered to indicate a significant difference.
Results and Discussion
Time-course VCM concentration in CSF
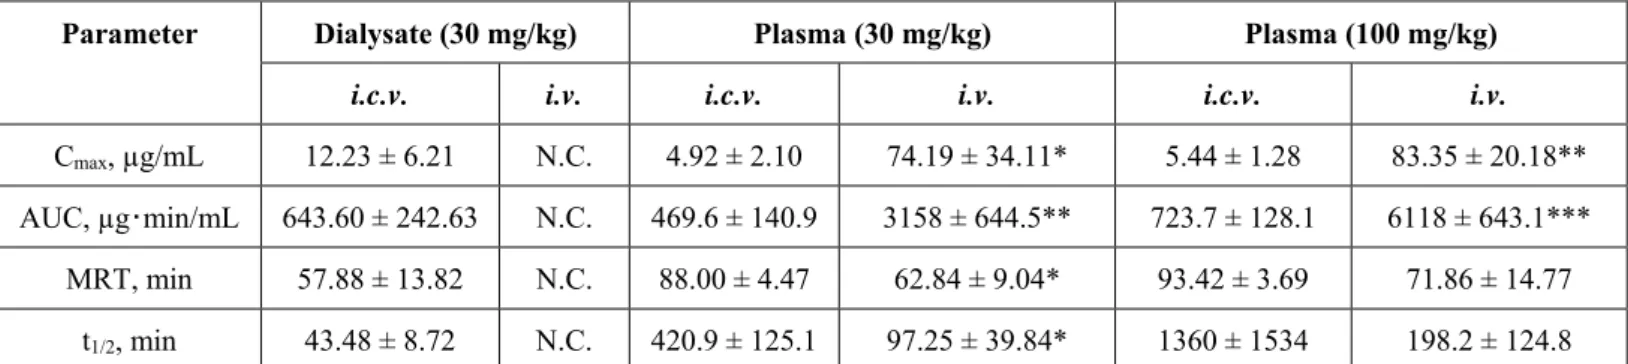
Figure 1a shows the time-course concentration of VCM in the dialysates after i.c.v. and i.v. administration (30 mg/kg) (n=3) and pharmacokinetic parameters are shown in Table 1. For i.c.v. administration, the peak concentration was increased at the first time point, then decreased over time. In contrast, after i.v. administration, VCM was not detected in the CSF at any time points. This result agrees with those of Pfausler et al. (1) and suggests that i.v. administration of VCM does not easily migrate into CSF.
Additionally, after i.c.v. administration, VCM was rapidly eliminated from the CSF.
Because VCM has both a time-dependent bactericidal action and a long-lasting effect (11), it may be necessary to retain VCM longer in CSF for the effective treatment of bacterial meningitis by MRSA. We believe that the pharmacokinetic data in this study showed can be useful for the clinical use of i.c.v. administration of VCM.
Time-course VCM concentration in plasma
After i.c.v. and i.v. administration (30 mg/kg), VCM concentration in the
plasma was quantitated at 6 time points (n=3) (Figure 1b). For i.v. administration, the
peak concentration was observed at the first point (5 min), after which the concentration
decreased over time. In contrast, for i.c.v. administration, the VCM concentration
remained low and constant. Moreover, the VCM concentration in the CSF decreased
rapidly after i.c.v. administration (Figure 1a). These results suggest that migration from
the CSF to systemic circulation is poor and VCM is eliminated from the CSF. This may
be because the inner wall of the cerebral ventricle is composed of ependymal cells,
which do not always form tight junctions with other cells (12). Therefore, VCM
administered into the CSF may translocate to the brain parenchyma. Additionally, the
VCM pharmacokinetics in CSF may be explained by bulk flow, which is the flow of
CSF from the brain to the spinal cord (13,14). Thus, VCM administered into the CSF
may have translocated to the brain parenchyma and/or spinal cord, not the systemic circulation.
Renal impairments after i.c.v. or i.v. administration of VCM
Renal impairments were histologically evaluated by HE staining of the mouse kidneys after one-week VCM administration (100 mg/kg) (Figure 3). No significant morphological change in the kidney was observed between the control group and i.c.v.
administration group. In contrast, in the i.v. administration group, renal tubular dilation and cellular infiltration into the interstitium were observed. To confirm these results, the VCM concentration in the plasma over time after i.c.v. and i.v. administration (100 mg/kg) was evaluated at 6 time points (n=3) (Figure 2). The time-course concentration (Figure 2) showed good agreement with the HE staining results (Figure 3). Additionally, the result of HE staining after i.v. administration of VCM agreed well with those of a study evaluating nephrotoxicity when VCM was repeatedly administered for 3–14 days (15). Therefore, this result suggests that i.c.v. administration of VCM does not cause renal impairments in the same dose that nephrotoxicity appeared after i.v. administration.
Thus, when VCM is administered i.c.v., the dose can be increased without causing adverse effects. VCM administered via i.c.v. can be effective for treating bacterial meningitis caused by MRSA.
Conclusion
In this study, we clarified the pharmacokinetics of VCM in the CSF after i.c.v.
administration, using microdialysis. VCM administered via i.c.v. showed a highly selective distribution in the CSF, without migration to systemic circulation and renal impairments.
Acknowledgements
This work was a partly supported by JSPS KAKENHI Grant Number 16K18862.
References
(1) Pfausler B, Spiss H, Beer R, Kampl A, Engelhardt K, Schober M, et al. Treatment of staphylococcal ventriculitis associated with external cerebrospinal fluid drains: a
prospective randomized trial of intravenous compared with intraventricular vancomycin therapy. J Neurosurg. 2003;98:1040–4.
(2) Wang Q, Shi Z, Wang J, Shi G, Wang S, Zhou J. Postoperatively administered vancomycin reaches therapeutic concentration in the cerebral spinal fluid of neurosurgical patients. Surg Neurol. 2008;69:126–9.
(3) Lodise TP, Lomaestro B, Graves J, Drusano GL. Larger vancomycin doses (at least four grams per day) are associated with an increased incidence of nephrotoxicity.
Antimicrob Agents Chemother. 2008;52:1330–6.
(4) Costa e Silva VT, Marçal LJ, Burdmann EA. Risk factors for vancomycin nephrotoxicity: still a matter of debate*. Crit Care Med. 2014;42:2635–6.
(5) Chavada R, Ghosh N, Sandaradura I, Maley M, Van Hal SJ. Establishment of an AUC
0-24Threshold for Nephrotoxicity Is a Step towards Individualized Vancomycin Dosing for Methicillin-Resistant Staphylococcus aureus Bacteremia. Antimicrob Agents Chemother. 2017;61:1–8.
(6) Barceló-Vidal J, Rodríguez-García E, Grau S. Extremely high levels of vancomycin can cause severe renal toxicity. Infect Drug Resist. 2018;11:1027–30.
(7) Fuchigami Y, Fu X, Ikeda R, Kawakami S, Wada M, Kikura-Hanajiri R, et al.
Evaluation of the neurochemical effects of methoxetamine using brain microdialysis in mice. Forensic Toxicol. 2015;33:374–9.
(8) Miura Y, Fuchigami Y, Hagimori M, Sato H, Ogawa K, Munakata C, et al.
Evaluation of the targeted delivery of 5-fluorouracil and ascorbic acid into the brain with ultrasound-responsive nanobubbles. J Drug Target. 2018;26:684–91.
(9) Kawai S, Takagi Y, Kaneko S, Kurosawa T. Effect of Three Types of Mixed Anesthetic Agents Alternate to Ketamine in Mice. Exp Anim. 2011;60:481–7.
(10) Usman M, Hempel G. Development and validation of an HPLC method for the determination of vancomycin in human plasma and its comparison with an
immunoassay (PETINIA). Springerplus. 2016;5:124.
(11) Ambrose PG, Bhavnani SM, Rubino CM, Louie A, Gumbo T, Forrest A, et al.
Pharmacokinetics-pharmacodynamics of antimicrobial therapy: it’s not just for mice
anymore. Clin Infect Dis. 2007;44:79–86.
(12) Spassky N, Merkle FT, Flames N, Tramontin AD, García-Verdugo JM,
Alvarez-Buylla A. Adult ependymal cells are postmitotic and are derived from radial glial cells during embryogenesis. J Neurosci. 2005;25:10–8.
(13) Rosenberg GA, Kyner WT, Estrada E. Bulk flow of brain interstitial fluid under normal and hyperosmolar conditions. Am J Physiol. 1980;238:F42-9.
(14) Pullen RG, DePasquale M, Cserr HF. Bulk flow of cerebrospinal fluid into brain in response to acute hyperosmolality. Am J Physiol. 1987;253:F538–45.
(15) Takigawa M, Masutomi H, Kishimoto Y, Shimazaki Y, Hamano Y, Kondo Y, et al.
Time-Dependent Alterations of Vancomycin-Induced Nephrotoxicity in Mice. Biol
Pharm Bull. 2017;40:975–83.
Legend to Figures
Figure 1 (a) Time-course vancomycin (VCM) concentration in the dialysates from the mouse brain after intracerebroventricular (i.c.v.) and intravenous (i.v.) administration (30 mg/kg). The VCM concentrations in dialysates after i.v. administration were below the limit of quantitation at all time points. (b) Time-course VCM concentration in the mouse plasma after i.c.v. and i.v. administration (30 mg/kg). (a, b) Data are expressed as the mean ± standard deviation (n=3). *P<0.05, **P<0.01, and ***P<0.001 by Student’s t-test. N.D., not detected.
Figure 2 Time-course VCM concentration in the mouse plasma after i.c.v. and i.v.
administration (100 mg/kg). (a–c) Data are expressed as the mean ± standard deviation (n=3). *P<0.05 and **P<0.01 by Student’s t-test.
Figure 3 Histological assessment of mouse kidneys with hematoxylin and eosin (HE) staining. Doses for i.c.v. and i.v. administration were 100 mg/kg with one-week
administration. Slides from both the cortex and medulla are shown for each group. Scale
bar: 50 µm.
Parameter Dialysate (30 mg/kg) Plasma (30 mg/kg) Plasma (100 mg/kg)
i.c.v. i.v. i.c.v. i.v. i.c.v. i.v.
Cmax, µg/mL 12.23 ± 6.21 N.C. 4.92 ± 2.10 74.19 ± 34.11* 5.44 ± 1.28 83.35 ± 20.18**
AUC, µg・min/mL 643.60 ± 242.63 N.C. 469.6 ± 140.9 3158 ± 644.5** 723.7 ± 128.1 6118 ± 643.1***
MRT, min 57.88 ± 13.82 N.C. 88.00 ± 4.47 62.84 ± 9.04* 93.42 ± 3.69 71.86 ± 14.77 t1/2, min 43.48 ± 8.72 N.C. 420.9 ± 125.1 97.25 ± 39.84* 1360 ± 1534 198.2 ± 124.8