Abstract : Entropy is a nonlinear method for quantifying the regularity and order of a system. Entropy was originally born from thermodynamics and is now used in various fields, such as statistical mechanics and information ethics. Approximate Entropy (ApEn) is an index that has been developed to quantify the complexity of data over time. This study aimed to use ApEn measurement to clarify the relationship between the regularity of the respiratory waveform and ventilation parameters for humans in a resting state. The 5 minutes resting respiratory metabolism of thirteen healthy participants was measured, including respiratory rate (RR), tidal volume (V T ), minute ventilation (V
・E ), end-tidal oxygen concentration (E T O 2 ), end-tidal carbon dioxide concentration (E T CO 2 ), end-tidal carbon dioxide tension (P ET CO 2 ), inspiration time (T I ), expiration time (T E ), and respiration time (T TOT ), and the ventilatory response to end-tidal carbon dioxide tension (V
・E /P ET CO 2 ) was calculated. ApEn values and ventilation parameters were examined using Pearson's product-moment correlation coefficient. The ApEn value of the respiratory waveforms of participants was 0.291 ±0.050 (mean ±SD) ; these values were positively correlated with T I , T E , T TOT , E T O 2 , and P ET CO 2 , and negatively correlated with RR, E T CO 2 , and V
・E /P ET CO 2 . There were no correlations with V T or V
・E . The results revealed a correlation between ApEn values and RR, T I , T E , and T TOT . The respiratory waveform of a person with fast respiration and a high respiration rate was regular. The correlation between the regularity of the respiratory waveform and P ET CO 2 and V
・E /P ET CO 2 showed that those with regular respiratory waveforms had increased sensitivity to CO 2 and were in a respiratory state close to hyperventilation. Those with regular respiratory waveforms at rest may have unconsciously felt breathless due to anxiety. The fact that no correlation was observed between V T and V
・E supports the notion that the regularity of the respiratory waveform is not determined by ventilation volume but by respiration rate.
key words:respiratory waveform, regularity, Approximate Entropy, hyperventilation
1)Graduate School of Health Sciences, Tokyo Ariake University of Medical and Health Sciences. E-mail address:[email protected]
2)Tokyo Ariake University of Medical and Health Sciences.
3)Kurashiki University of Science and the Arts.
Ⅰ.Introduction
Breathing is an important behavior in life-sustaining activities and is performed by an individual approximately 20,000 times a day. It is widely known that the main function of respiration is to inhale oxygen and exhale carbon dioxide to sustain life. This life-sustaining respiration, called metabolic respiration, is governed by the respiratory center in the medulla and pons of the brainstem. However, in addition to metabolic respiration, behavioral respiration occurs in response to activity in
the upper center of the brain 1, 2) . Behavioral respiration, unlike metabolic respiration, is respiration that can vary voluntarily, such as during pronunciation and deep breathing. Furthermore, in recent years, reports of emotional breathing affected by various emotions out of this action of breathing have been made 2) . The center of emotional respiration is in the limbic amygdala 3, 4)
and responds to emotional changes such as happiness, sadness, and fear. In other words, respiration is generated and maintained by metabolic respiration that mainly maintains homeostasis, as well as behavioral respiration
Takuma Miyashita 1) Koki Takahashi 2)
Chihiro Edamatsu 3) Ikuo Homma 2)
Regularity of Respiratory Waveform Depends on
Ventilation Parameters
that can be intentionally fluctuated and emotional respiration that responds to changes in emotions, and always undergoes complex fluctuations.
It is known that time-series data of biological signals fluctuate due to various factors. Considering the characteristics of such time-series data, as it is difficult to determine the average or standard deviation of the data, it is desirable to use a nonlinear approach 5) . Entropy is a nonlinear method for quantifying the regularity and order of a system. Entropy was originally born from thermodynamics and is now used in various fields such as statistical mechanics and information ethics.
Approximate Entropy (ApEn) is an index that has been developed to quantify the complexity of data over time, and it was adapted to the clinical physiology field and to heart rate data by Pincus 5) . ApEn research reports were used by Pincus et al. 6) . They showed that although heart rates of deceased infants with Sudden Infant Death Syndrome were within a normal range, their rates were less variable than that of healthy infants, and thus, they reported that SIDS had some relation to heart rate variability by means of ApEn. Ryan et al. 7) report that heart rate variability becomes regular with age, and it is more regular in men than women. Shin et al. 8) used ApEn to determine that changes in heart rate variability and atrial fibrillation precede spontaneous seizures.
According to these reports, it is clear that ApEn is a method that can be used to quantify the regularity of heart rate variability, and that heart rate variability changes regularly with disease and aging. Respiration is a complex biological signal similar to heart rate variability. Therefore, we believe that it is also possible to evaluate the regularity of the respiratory waveform using ApEn. However, few reports have used ApEn for respiratory analysis, and it is not clear if there is regularity in the respiratory waveform. We performed measurements in healthy adults to clarify whether regular respiratory waveforms have regularity in a resting state and how they relate to ventilation parameters.
Ⅱ.Materials and Methods 1)Participants
Thirteen healthy participants (8 males) aged from 20 to 22 years were included in this study. None of the participants had any psychiatric, neurological, or pulmonary disorders. The mean age ±SD was 21.0±0.7 years, height was 163.1 ±8.4 cm, and weight was 57.1
±11.6 kg. All participants provided written informed
consent, and the study was approved by the Ethics Committee of Tokyo Ariake University of Medical and Health Sciences (Approval number : Tokyo Ariake University of Medical and Health Sciences Ethics Approval No. 287).
2)Methods
(1)Measurement of respiratory metabolism
In the sitting position, each participant's respiratory metabolism was measured for 5 minutes using a facemask connected to a respiratory monitor (AE- 100i, Minato Medical ; Osaka, Japan). The room temperature was maintained at 26.8 ±0.7 ℃. After the participants remained quiet, respiratory rate (RR), tidal volume (V T ), minute ventilation (V
・E ), end-tidal oxygen concentration (E T O 2 ), end-tidal carbon dioxide concentration (E T CO 2 ), end-tidal carbon dioxide tension (P ET CO 2 ), inspiration time (T I ), expiration time (T E ) and respiration time (T TOT ) were measured breath by breath for 5 minute. V
・E /P ET CO 2 was calculated as a ventilatory response to end-tidal carbon dioxide tension. All respiratory data were stored on a laptop computer. The data obtained from the respiratory monitor were analyzed for the average value for 5 minutes of measurement.
(2)Acquisition of Respiratory Waveforms
Flow waveforms from a respiratory monitor were inputted to a laptop computer via an A/D converter
(PowerLab, ADInstruments ; Sydney, Australia)
and recorded by analysis software (LabChart7, ADInstruments). Of the recorded 5-minute flow waveforms, 10 waveforms free of artifacts such as body motion were arbitrarily selected from 5 locations, and the ApEn of each was calculated. The average value of ApEn at the five locations was used for analysis.
(3)Calculation of ApEn value
ApEn is affected by the number of waveforms and the number of data included in the time-series data, and so when calculating it is necessary to complete the number of waveforms and the number of data among the selected data 9) . Therefore, in this study, the number of waveforms was set to flow waveforms for 10 breaths, and the number of data was re-sampled to 1500 using cubic spline interpolation in MATLAB7
(MathWorks ; Natick, MA) to unify the number of
data. When calculating ApEn values, it is necessary
to set m, which determines the vector space, and r, which plays a role in reducing the effects of noise. In this study, we set m = 2 and r = 0.15SD based on the report of Abe et al. 9) . The formula for calculating the ApEn value is shown below.
ApEn (m, r, N)=φ(m, r, N)−φ(m+1, r, N)
The lower limit of the ApEn value is 0, the ApEn value of regular time-series data such as a sine curve shows a value close to 0, and conversely, random time-series data without regularity shows a high value.
In the setting of ApEn value calculation in this study, the ApEn value of a sine curve (0.25 Hz) was 0.181, and the ApEn value of a uniform random number created by spreadsheet software (Microsoft Office Excel, Microsoft ; Redmond, WA) was 1.360 (Fig. 1).
(4)Data Analysis
The measured data were expressed as mean ± standard deviation. All statistical analyses were performed with a commercially available statistical package (JMP Pro14.2.0, SAS Institute ; Cary, NC).
The relationship between the ApEn value of the respiratory waveform and each ventilation parameter was examined using Pearson's product-moment correlation coefficient. A p-value of < 0.05 was considered statistically significant.
Ⅲ.Results
The ApEn value of participants’ respiratory waveforms was 0.291 ±0.014. The mean values for each of the ventilation parameters are shown in Table 1.
1)Relationship to Respiratory Rate
There was a negative correlation between ApEn values and RR of the respiratory waveform (Fig. 2-A).
A positive correlation was observed with T I , T E , and T TOT (Fig. 2-B, C, D). Short breathing time in a participant's respiratory rate often indicated a regular respiratory waveform.
2)Relationship to Ventilation
No significant correlation was found between the ApEn value of respiratory waveforms and V T and V
・E
(Fig. 3).
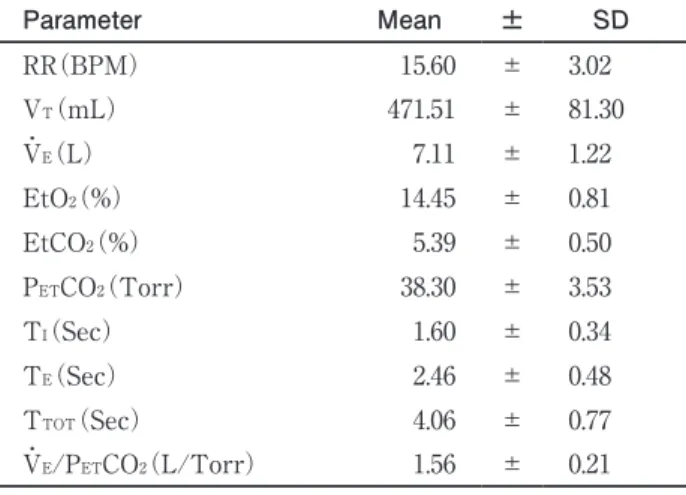
Table 1
.Subject’s respiratory parametersParameter Mean ± SD
RR(BPM) 15.60 ± 3.02
V
T(mL) 471.51 ± 81.30
V
・(L)
E7.11 ± 1.22
EtO (%)
214.45 ± 0.81
EtCO (%)
25.39 ± 0.50
P
ETCO (Torr)
238.30 ± 3.53
T (Sec)
I1.60 ± 0.34
T (Sec)
E2.46 ± 0.48
T
TOT(Sec) 4.06 ± 0.77
V
・E/P
ETCO (L/Torr)
21.56 ± 0.21
Values are mean±SDRR, respiratory rate per minute ; VT, tidal volume ; ETO2, end- tidal oxygen ; ETCO2, end-tidal carbon dioxide ; PETCO2, partial pressure of end-tidal carbon dioxide ; TI, inspiratory time ; TE, expiratory time ; TTOT, total respiratory time ; V・E/PETCO2, ventilatory response to end-tidal carbon dioxide tension.
Fig.1
ApEn value of Sine wave(A) and uniform random number data(B).ApEn value of sine wave was 0.181 and uniform random number sata was 1.360.
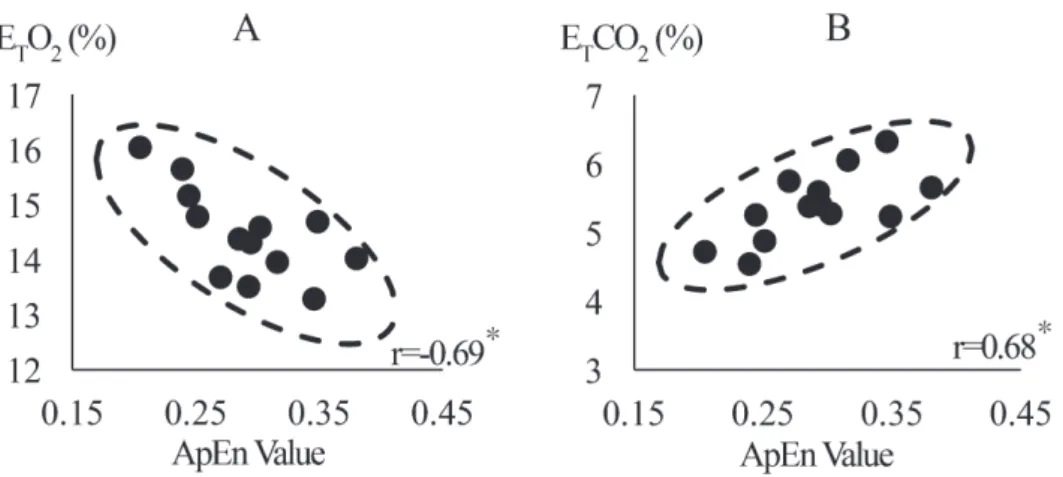
3)Relationship with End-Tidal Gas Concentration ApEn values and E T O 2 showed a negative correlation ; ApEn values and E T CO 2 and P ET CO 2 showed positive correlations (Fig. 4). A high E T O 2 concentration with a
low CO 2 concentration indicated that there was strong regularity in the respiratory waveform.
Fig.2
The relationships between ApEn Value, RR, TI, TE, TTOTAA linear plot of ApEn value and RR. A significant negative correlation was observed (r=-0.79, p<0.05). B linear plot of ApEn value and TI. A significant positive correlation was observed (r=0.75, p<0.05). C linear plot of ApEn value and TE. A significant positive correlation was observed (r=0.73, p<0.05). D linear plot of ApEn value and TTOT. A significant positive correlation was observed (r=0.79, p<0.05).
Fig.3
The relationships between ApEn Value, V・E, VTA linear plot of ApEn value and V・E. No significant correlation was observed. B linear plot of ApEn value and VT. No significant correlation was observed.
4)Relationship with Ventilatory Response to End- Tidal Carbon Dioxide Tension
ApEn values and P ET CO 2 showed a positive correlation
; ApEn values and V
・E /P ET CO 2 showed a negative correlation (Fig. 5). This indicates that those who are sensitive to CO 2 have higher respiratory waveform regularity.
Ⅳ.Discussion
1)ApEn Value of a Respiratory Waveform
The average ApEn value of the participants’
respiratory waveforms was 0.291 ±0.050. Since the ApEn value varies depending on calculation settings, there are relative differences between the obtained data and, as such, this value is not considered to be
the absolute value of the regularity 9) . The respiratory waveform obtained in this study was more disordered than the sine curve (0.181) and more regular than the uniform random number (1.360), indicating that the respiratory waveform had some regularity. The regularity of heart rate variability has been reported to become more regular with aging 6, 7) . It has been reported that the heart rate variability coefficient decreases linearly as the autonomic nervous activity decreases with aging 10) . When the time-series data of the biological response shows a regular appearance, this may represent a unique state that is not easily affected by disturbance, and a highly regular respiratory waveform is considered to be a breathing state that is not easily affected by disturbance.
Fig.4
The relationships between ApEn Value, ETO2, ETCO2A linear plot of ApEn value and ETO2. A significant negative correlation was observed (r=-0.69, p<0.05). B linear plot of ApEn value and ETCO2. A significant positive correlation was observed (r=0.68, p<0.05).
Fig. ApEn value vs PETCO2,V・E/PETCO2
Fig.5
The relationships between ApEn Value, PETCO2, V・E/PETCO2A linear plot of ApEn value and PETCO2. A significant negative correlation was observed (r=0.68, p<0.05). B linear plot of ApEn value and V・E/PETCO2. A significant positive correlation was observed (r=-0.68, p<0.05).
2)Regularity of Respiratory Waveform, Respiratory Rate, and End-Tidal Gas Concentration
The main findings obtained in this study were that those with high respiratory rates had low ApEn values, while those with low respiratory rates had high ApEn values. This means that the breathing waveform of a person with a high respiration rate is regular. When the respiration rate is high, the respiration time is short, and when the respiration rate is low, the respiration time is long. If the minute ventilation is constant, the respiration rate is high, and the respiration time is short, it means that the tidal volume is low. If the minute ventilation is constant and the tidal volume is small, the proportion of dead space occupied by each tidal volume increases and the alveolar ventilation volume decreases.
Oxygen that is not involved in gas exchange increases at the end of expiration due to increased dead space volume. In other words, in this study, high end-tidal O 2 concentrations and low end-tidal CO 2 concentrations of participants in this study were caused by tachypnea. The regularity of the respiratory waveform was not correlative with minute ventilation, tidal volume statistically. From this, it became clear that the influence of the respiratory waveform on respiration rate and time was strong.
3) Regularity of Respiratory Waveform and Ventilatory Response to End-Tidal Carbon Dioxide Tension P ET CO 2 and arterial blood carbon dioxide partial pressure are very similar, so P ET CO 2 is used as a parameter to estimate arterial blood carbon dioxide partial pressure. An increase in P ET CO 2 indicates hypoventilation, and a decrease in P ET CO 2 indicates hyperventilation. Since the respiratory waveform of a person with a low P ET CO 2 value was regular, it is suggested that the respiratory waveform may be regular while breathing state was close to hyperventilation in this study. V
・E /P ET CO 2 is an index which indicates sensitivity to CO 2 in the respiratory center. Itakura et al. 11) examined V
・E /P ET CO 2 in patients with hyperventilation syndrome using closed-circuit rebreathing. He reported that healthy subjects had a high V
・E /P ET CO 2 value. He also reported that patients with hyperventilation syndrome increased their respiratory rate rather than tidal volume during CO 2 rebreathing. We revealed that the respiratory waveform was regular in the participants whose V
・E / P ET CO 2 value was high and who were sensitive to CO 2 . In general, hyperventilation syndrome, also called anxiety- related dyspnea and tachypnea, and ventilation attacks caused by anxiety, cause decreased arterial blood carbon
dioxide partial pressure, respiratory alkalosis due to an increase in pH, and increased sympathetic nervous function. Hyperventilation leads to a gradual respiratory change in excessively stressful situations. To breathe more air, breathing becomes faster which leads to a stuffy sensation in the air passages as if the intake of enough air is not allowed. The resulting physical symptoms include numbness and increased anxiety, turning into a vicious cycle of hyperventilation. In other words, hyperventilation and anxiety are considered to be closely related. In this study, participants with very regular respiratory waveforms may have unconsciously felt stuffy or anxious because they had a high respiratory rate, increased CO 2 sensitivity, and were breathing close to hyperventilation.
4)Relationship Between Breathing and Anxiety
Regarding individual anxiety and respiratory rates,
Kato et al. 12) reported that those with an increased
respiratory rate in a resting state had high levels of
anxiety. The amygdala is the emotional respiratory
center which increases the respiratory rate due to
anxiety, which is a respiratory control mechanisms 3, 4) .
It is well known that patients with hyperventilation
syndrome or panic disorder have high levels of anxiety,
increased respiratory frequency, and persistent
decreases in arterial and alveolar CO 2 concentrations 13) .
In this study, we also observed that participants with
high respiratory rates whose breathing was close to
a hyperventilation state had low ApEn values. This
suggests that those with a negative emotional state
may have increased respiratory waveform regularity
due to emotional respiration. Higher regularity (more
stability in the pattern of breaths taken) can lead to
rhythmic breathing and may prevent the loss of energy
for breathing. However, shallow and fast breathing
increases dead space and decreases alveolar ventilation,
which is inefficient ventilation from the viewpoint of
substantial ventilation efficiency. For example, during
exercise, the respiratory rate increases with the
operation time and load and the dead space ventilation
rate decreases, thereby decreasing the dead space
ventilation rate (dead space volume / tidal volume) 14) .
Also, when performing continuous exercises, such as
walking, running, or cycling at a constant rate, the
respiratory rate and respiratory cycle are affected
by the exercise cycle, and the synchronization of
exercise rhythm and respiratory rhythm (Locomotor
Respiratory Coupling : LRC) is known to occur 15,16) .
This LRC has effects such as a decrease in oxygen intake 17) and a reduction in dyspnea 18) because an increase in respiratory rate is important for improving ventilation efficiency during exercise. For these respiratory responses during exercise, an increase in respiratory rate is appropriate, but in this study, the measurements were done while the participants were at rest. People whose respiration rate is high at rest may try to breathe well with good ventilation efficiency while the regularity of their respiration waveform increases due to an unconscious feeling of breathlessness and to preventing energy loss in breathing.
These findings suggest that the regularity of the respiratory waveform may be related to the respiratory rate and end-tidal gas concentration. Moreover, it is suggested that breathing with a sense of annoyance or anxiety at rest could result in breathing with high regularity of the waveform, or rhythmic breathing that is hardly affected by disturbance.
Ⅴ.Conclusions
The ventilation parameters and the regularity of the respiratory waveform in a resting breathing state of thirteen participants were examined. The results showed that the respiratory rate and respiratory waveform regularity are closely related. This suggests that the regularity of the respiratory waveform may increase as the respiratory rate increases and with a hyperventilation state.
Conflicts of Interest
The authors declare that there is no conflict of interest regarding the publication of this paper.
References
1)Shea SA. Behavioural and arousal-related influences on breathing in humans. Experimental physiology. 1996;81(1):1-26.
2)Homma I, Masaoka Y. Breathing rhythms and emotions.
Experimental physiology. 2008;93(9):1011-1021.
3)Adolphs R, Tranel D, Damasio H et. al. Impaired recognition of emotion in facial expressions following bilateral damage to
the human amygdala. Nature. 1994;372(6507):669-672.
4)Morris JS, Friston KJ, Buchel C et al. A neuromodulatory role for the human amygdala in processing emotional facial expressions. Brain : a journal of neurology. 1998;121 (Pt 1): 47-57.
5)Pincus SM. Approximate entropy as a measure of system complexity. Proceedings of the National Academy of Sciences of the United States of America. 1991;88(6):2297-2301.
6)Pincus SM, Goldberger AL. Physiological time-series analysis : what does regularity quantify? The American journal of physiology. 1994;266(4 Pt 2):H1643-1656.
7)Ryan SM, Goldberger AL, Pincus SM et. al. Gender- and age- related differences in heart rate dynamics : are women more complex than men? Journal of the American College of Cardiology. 1994;24(7):1700-1707.
8)Shin DG, Yoo CS, Yi SH et al. Prediction of paroxysmal atrial fibrillation using nonlinear analysis of the R-R interval dynamics before the spontaneous onset of atrial fibrillation. Circulation journal : official journal of the Japanese Circulation Society.
2006;70(1):94-99.
9)Abe M, Yamada N. Quantifying the regularity of time-series data : Application of approximate entropy to human movement analysis. Japanese Journal of Biomechanics in Sports & Exercise.
1998;2(2):82-91.
10)Takada H, Okino K, Niwa Y et. al. An Evaluation method for heart rate variability, by using acceleration plethysmography.
Health & Prom. 2004;31(4):547-551.
11)Itakura K, Suzuki Y, Mikami K et. al. Ventilatory response to carbon dioxide in patients with hyperventilation syndrome.
Japanese Journal of Psychosomatic Medicine. 1983;23(4):
329-336.
12)Kato A, Takahashi K, Homma I. Relationships between trait and respiratory parameters during quiet breathing in normal subjects. The journal of physiological sciences. 2018;68(4): 369-376.
13)Masaoka Y, Jack S, Warburton CJ et. al. Breathing patterns associated with trait anxiety and breathlessness in humans.
The Japanese journal of physiology. 2004;54(5):465-470.
14)Sun XG, Hansen JE, Garatachea N et. al. Ventilatory efficiency during exercise in healthy subjects. American journal of respiratory and critical care medicine. 2002;166
(11):1443-1448.
15)Bechbache RR, Duffin J. The entrainment of breathing frequency by exercise rhythm. The Journal of physiology.
1977;272(3):553-561.
16)Siegmund GP, Edwards MR, Moore KS et. al. Ventilation and locomotion coupling in varsity male rowers. Journal of applied physiology (Bethesda, Md : 1985). 1999;87(1):
233-242.
17)Bernasconi P, Kohl J. Analysis of co-ordination between breathing and exercise rhythms in man. The Journal of physiology. 1993;471:693-706.
18)Takano N, Deguchi H. Sensation of breathlessness and respiratory oxygen cost during cycle exercise with and without conscious entrainment of the breathing rhythm.
European journal of applied physiology and occupational physiology. 1997;76(3):209-213.