Japan Advanced Institute of Science and Technology
JAIST Repository
https://dspace.jaist.ac.jp/Title
Vortex slush regime in the Josephson vortex phase
diagram of 60-K YBa_2Cu_3O_〈7-δ〉 single
crystals
Author(s)
Naito, Tomoyuki; Iwasaki, Hideo; Nishizaki,
Terukazu; Haraguchi, Seiya; Kawabata, Yuuya;
Shibata, Kenji; Kobayashi, Norio
Citation
Physical Review B, 68(22): 224516-1-224516-6
Issue Date
2003-12-29
Type
Journal Article
Text version
publisher
URL
http://hdl.handle.net/10119/4610
Rights
T. Naito, H. Iwasaki, T. Nishizaki, and N.
Kobayashi, S. Haraguchi, Y. Kawabata, K. Shibata,
Physical Review B , 68(22), 2003,
224516-1-224516-6. Copyright 2003 by the American Physical
Society.
http://link.aps.org/abstract/PRB/v68/e224516
Description
Vortex slush regime in the Josephson vortex phase diagram of 60-K
YBa
2Cu
3O
7À␦single crystals
Tomoyuki Naito,1,*Hideo Iwasaki,1Terukazu Nishizaki,2Seiya Haraguchi,1 Yuuya Kawabata,1 Kenji Shibata,2 and Norio Kobayashi2
1School of Materials Science, Japan Advanced Institute of Science and Technology (JAIST), Tatsunokuchi 923-1292, Japan 2Institute for Materials Research, Tohoku University, Sendai 980-8577, Japan
共Received 7 December 2002; revised manuscript received 24 July 2003; published 29 December 2003兲 We have studied the Josephson vortex phase diagram of 60-K YBa2Cu3O7⫺␦single crystals by measuring the in-plane resistivity. We find that the phase transition of the Josephson vortices in high magnetic fields above 60 kOe is a two-stage process which consists of first-order vortex liquid-to-slush and second-order vortex slush-to-glass transitions, while a single second-order vortex liquid-to-glass transition is observed in low magnetic fields below 50 kOe. The obtained results show that the vortex slush appears as the intermediate regime between the ordinary vortex liquid and glassy phases in the Josephson vortex system.
DOI: 10.1103/PhysRevB.68.224516 PACS number共s兲: 74.25.Qt, 74.25.Fy, 74.72.Bk
I. INTRODUCTION
In the mixed state of high-temperature superconductors, the vortex phase diagram for a magnetic field applied parallel to the ab plane (H储ab) is still unclear, in contrast to that for the H储c axis. For H储ab, since the so-called Josephson vor-tices 共JV’s兲 are formed between the neighboring supercon-ducting layers, their phase transition is significantly affected by the layered structure. In the 90-K phase of YBa2Cu3O7⫺␦ 共YBCO兲 single crystals, the in-plane resistivity experiments
by Kwok et al.1 showed that a first-order transition is sup-pressed by intrinsic pinning2 and the possibility of a transi-tion between the vortex smectic and liquid phases on the analogy of that between the nematic and smectic-A phases in liquid crystals.3 Later, motivated by Ref. 1, Balents and Nelson4 theoretically revealed that the second-order vortex liquid-to-smectic transition occurs between the liquid and solid phases and predicted the complex behavior of this tran-sition line as a result of the commensurability effect of the vortex density with the interlayer distance. Experiments in 90-K YBCO by Grigera et al.5 and results of a computer simulation by Laguna et al.6 supported this scenario by ob-serving a two-step transition.
In oxygen deficient YBCO single crystals, Gordeev et al.7 observed a vertical and oscillating melting line characterized by a jump in the in-plane resistivity and attributed it to the appearance of the smectic phase. It seems that there is a resistive tail below the jump; however, they did not discuss the lower transition between the smectic and solid phases. Lundqvist et al. also reported similar vertical transition lines for such materials from both the in-plane8and out-of-plane9 resistivity measurements. Only a single resistive transition was found in both results, demonstrating the absence of an intermediate region like the smectic phase. On the other hand, the vortex slush regime, which was reported by Wor-thington et al.10for H储c in proton irradiated 90-K YBCO, is well known as an intermediate phase between vortex liquid and vortex glass. In Ref. 10, the authors found a two-stage transition comprised of discontinuous and continuous behav-iors and interpreted it as follows: upon cooling the liquid
undergoes a first-order transition into slush, and the slush freezes into the vortex glass phase via a second-order transi-tion. For H储ab, such a regime has not been experimentally observed, but was theoretically confirmed by Ikeda.11 Con-sequently, in oxygen deficient YBCO, although several ex-perimental observations which indicate transitions of the JV’s have been reported, the nature of those transitions seems not to be settled.
In this paper, we report the JV phase diagram in 60-K YBCO single crystals. We find a two-stage resistive transi-tion consisting of both the jump and continuous behaviors in high magnetic fields above 60 kOe and show that the two transitions consist of first-order liquid-to-slush and second-order slush-to-glass. On the other hand, the liquid directly freezes into glass via a second-order transition in low mag-netic fields below 50 kOe. Our findings are evidence that the vortex slush regime exists in the JV phase diagram.
II. EXPERIMENT
YBCO single crystals were grown by a self-flux method in yttria crucibles.12 Twinned 60-K phase crystals were ob-tained by annealing at 680 °C for 1 week in 1 bar flowing oxygen gas, followed by quenching in liquid nitrogen. The superconducting transition temperature Tcdefined at the zero
resistivity is 62.4 K. The sample dimensions are 0.8⫻0.6
⫻0.2 mm3. The in-plane resistivity is measured by a
con-ventional dc four-probe method with a typical current density
J of 0.6 A/cm2 in magnetic fields up to 150 kOe. The sample position is adjusted with the angle resolution of ⬃0.01°, where the angle is defined between the magnetic-field di-rection and the ab plane; the current didi-rection is always per-pendicular to the former. The experimental configuration is schematically illustrated in the inset of Fig. 1. The aniso-tropic parameter ␥(⫽ab/c) of the crystal is determined to be⬃17 from scaling the set of the() curves measured in several magnetic fields up to 90 kOe by the reduced field,
Hred⫽H( sin2⫹␥⫺2cos2)1/2, based on the effective mass model,13whereabandcare the coherence length in the ab plane and along the c axis direction, respectively.
III. RESULTS
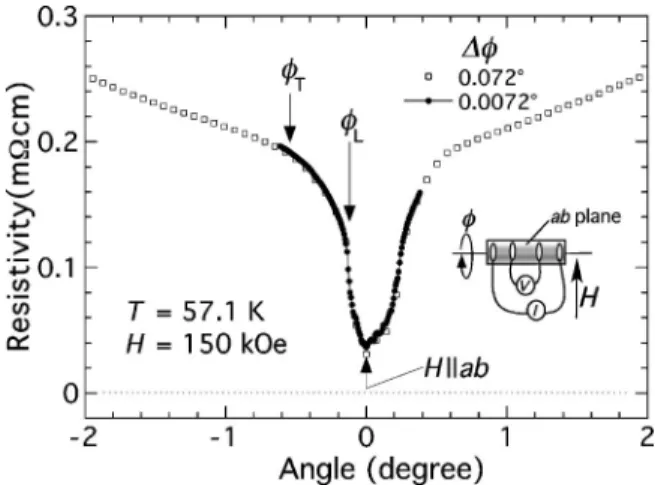
Figure 1 shows the angular dependence of the resistivity
() at H⫽150 kOe and T⫽57.1 K near H储ab. The angle at the resistivity minimum indicating H储ab is defined as
⫽0°. The resistivity linearly depends on at high angles. Below a certain angle, indicated as兩T兩⬃0.6°, the resistivity starts to deviate from its linear behavior and rapidly de-creases, indicating that the vortices begin to be confined be-tween the layers. A sharp dip appears below 兩L兩⬃0.15°, demonstrating the lock-in transition. The specific angles L
andTare the so-called lock-in and trapping angles, respec-tively.
Figure 2 shows the temperature dependence of the resis-tivity (T) at ⫽0° in several magnetic fields up to 150 kOe. In high magnetic fields above 60 kOe, the(T) curves represent a two-stage transition; upon cooling, they first
show a somewhat sharp jump toward nonzero resistivity and next a gradual temperature dependence accompanied by a continuous transition. On the other hand, in low magnetic fields below 50 kOe, the (T) curves show only a continu-ous transition. The inset of Fig. 2 demonstrates the (T) curves for several current densities of 0.6, 1.2, and 2.0 A/cm2 at 130 kOe. In the low-resistivity regime below 10⫺3 m⍀ cm, one can find a slight nonlinear 共non-Ohmic兲 behavior among the curves. However, this feature is caused by only the (T) curve at 2.0 A/cm2. Futhermore, the other curves for 0.6 and 1.2 A/cm2, show a similar temperature
dependence. Thus we consider that the current density of 0.6 A/cm2 typically used here gives a linear共Ohmic兲 resis-tivity.
Figure 3 shows the temperature dependence of the resis-tivity for⫽0.6°, just above the trapping angle, in magnetic fields up to 150 kOe. The anomalous feature as observed for
⫽0° completely disappears, and only a continuous
transi-tion occurs.
The discontinuous transition temperature for ⫽0° in high magnetic fields is defined as the temperature at which FIG. 1. Angular dependence of the resistivity() at T⫽57.1
K and H⫽150 kOe near H储ab, where the angle is defined be-tween the magnetic field and ab plane. The specific anglesTand
Lrepresent the so-called trapping and lock-in angles, respectively. A schematic picture of the experimental configuration is shown in the inset; the current direction is always perpendicular to the magnetic-field direction.
FIG. 2. Temperature dependence of the resistivity for ⫽0° (H储ab) in several magnetic fields of 0, 2, 5, and from 10 to 150 kOe in intervals of 10 kOe. Inset shows the (T) curves for several current densities of 0.6, 1.2, and 2.0 A/cm2at H⫽130 kOe.
FIG. 3. Temperature dependence of the resistivity for⫽0.6° in several magnetic fields up to 150 kOe.
FIG. 4. The main panel shows the resistivity-temperature de-rivative d/dT versus T plot for⫽0° in several magnetic fields above 70 kOe. The first-order transition temperature TFOT,
indi-cated by the arrow, is defined at the peak temperature. The inset shows the (T) curves at 50, 60, 70, 80, and 90 kOe; the arrows here also indicate TFOT.
TOMOYUKI NAITO et al. PHYSICAL REVIEW B 68, 224516 共2003兲
the temperature derivative of the resistivity d/dT becomes a maximum, as shown in Fig. 4. The jump width tends to sharpen with increasing magnetic field and becomes the nar-rowest at 150 kOe. Below 80 kOe, the d/dT peak is ob-scure; however, the discontinuous feature seems to still sur-vive down to 60 kOe, as seen in the inset of Fig. 4. Although resistivity is not a thermodynamic quantity, its jump is ob-served at the well-defined first-order melting transition probed by the thermodynamic measurements.14Furthermore, Nishizaki et al.15 found a similar two-stage resistive transi-tion for H储c in optimally doped YBCO and confirmed that the incomplete resistivity jump is attributed to the first-order transition, based on the observation of the magnetization jump at the same point. Therefore we regard the discontinu-ous transition observed here as first order and denote the transition temperature as TFOT.
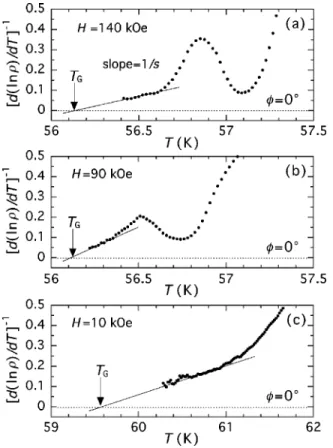
The continuous transition means that the vortex phase transition is second-order vortex liquid-to-glass; several glass phases,16,17which depend on the type of dominant pin-ning center, are possible. The theories11,16,17describing such a transition give the relation of the linear resistivity to the temperature in the critical region as follows: (T)⬀(T
⫺TG)s. This was originally proposed by Fisher et al.16in the
vortex glass theory, where TGis a glass transition
tempera-ture and s is a critical exponent. The details of s vary with the type of glass phase, for instance, s is(z⫺d⫹2) in Ref. 16, where z and , respectively, are the dynamic and static ex-ponents and d is the system dimension. As already confirmed in the inset of Fig. 2, the resistivity data obtained here belong
to the linear regime. Using this relation therefore we esti-mated the TGand s values from a straight line extrapolation
to the temperature axis and the inverse of the slope in the
关d( ln)/dT兴⫺1vs T plot, respectively, regardless of the glass types. Typical data for ⫽0° are shown in Figs. 5共a兲–5共c兲. As seen in Figs. 5共a兲 and 5共b兲, in the intermediate and high magnetic fields, the linear part of the plot which represents the critical region is quite narrow. However, it seems that this does not affect the determination of the TGvalue. Actually, the TGvalues are determined with very small uncertainly; for
instance, the obtained TGvalues for H⫽140 and 90 kOe are
of 56.13⫾0.04 K and 56.10⫾0.02 K, respectively. On the other hand, the critical region is relatively wide in the low magnetic fields; at H⫽10 kOe the obtained TGvalue is of 59.58⫾0.02 K, as demonstrated in Fig. 5共c兲. We note that the
TGfor H⫽60 and 70 kOe cannot be estimated in our experi-mental window. This seems to be caused by the fact that the very small difference between the TFOTand the temperature
at the zero-resistiviy transition smears out the critical region;
FIG. 5. The 关d( ln )/dT兴⫺1 versus T plots near the liquid-to-glass transition temperature TG at ⫽0° for several magnetic
fields;共a兲 H⫽140 kOe, 共b兲 90 kOe, and 共c兲 10 kOe.
FIG. 6. Magnetic-field dependence of the critical exponent s for both⫽0° 共closed circles兲 and 0.6° 共open triangles兲.
FIG. 7. Magnetic field versus temperature phase diagram. The closed circles represent the first-order transition line for⫽0°. The arrows indicate the commensurate field. The open squares represent the second-order liquid-to-glass transition line for⫽0°. The open triangles and thin broken line represent the vortex glass transition line for⫽0.6° and 90° (H储c) 共Ref. 18兲, respectively.
thus, we do not discard the occurrence of the second-order liquid-to-glass transition there. Figure 6 shows the magnetic field dependence of s for both⫽0° and 0.6°. The former is classified into three distinct regions; we will try to explain this nonuniversal behavior later. On the other hand, the latter monotonically decreases with increasing magnetic field.
Figure 7 shows the magnetic field versus temperature phase diagram of 60-K YBCO near H储ab; HFOT(T) and
HG(T) correspond to TFOT(H) and TG(H), respectively. The
first-order transition line HFOT(T) for⫽0° is almost
inde-pendent of the temperature and obviously oscillates between 60⭐H⭐ 120 kOe. This line suddenly appears at around 60 kOe and survives up to the highest magnetic field achieved in our facilities, therefore we can recognize that the lower critical point HFOT
lcp
exists at or below 60 kOe, but we do not know where the upper one HFOTucp is located. The second-order transition line HG(T) for ⫽0° below 50 kOe
monotoni-cally depends on temperature with the empirical power-law dependence as⬀(1⫺T/Tc)1.7, which has behavior similar to that for H储c.18However, it is also vertical above 50 kOe and oscillates between 80⭐H⭐130 kOe. Above 130 kOe, it be-gins to deviate from the HFOT(T) line without the oscillation.
One can easily find the intermediate region between the
HFOT(T) and HG(T) lines. For ⫽0.6°, on the other hand,
the obtained HG(T) line shows a monotonic power-law de-pendence as⬀(1⫺T/Tc)1.9without the vertical and oscillat-ing behaviors, strongly indicatoscillat-ing that such anomalous fea-tures are truly intrinsic phenomena of the JV system.
IV. DISCUSSION
A. Nature of the first-order transition forÄ0° As seen in the H⫺T phase diagram, although the lower critical point HFOTlcp is obviously in the liquid region, the up-per one HFOTucp is beyond our experimental window. To clarify the nature of the first-order transition, we first examined whether HFOTucp exists in finite temperature. The flexibility of the JV’s configuration along the c axis tends to decrease with increasing magnetic field due to the layered structure of the crystal, giving rise to the fact that the configuration is domi-nated by the interaction of the JV’s in the same layer. Such an effect prevents the JV’s from constructing a lattice, i.e., the first-order transition tends to be suppressed with increas-ing magnetic field. This picture is supported by the results of the Monte Carlo simulation performed by Hu and Tachiki19 who found the critical point of the phase transition in the JV system at a certain magnetic field given as 0/2
冑
3␥l2,where0is the flux quantum and l is the interlayer spacing. In 60-K YBCO, the first-order phase transition is expected to disappear at around 253 kOe using this relation with the values of␥⫽17 and l⫽11.8 Å. Furthermore, the upper criti-cal end point of the first-order transition line was found in the JV phase diagram theoretically achieved in Ref. 11. Therefore it becomes clear that the HFOT(T) line is in the
liquid region, meaning that the two kinds of liquids must exist above and below it.
The incomplete resistivity jump strongly indicates that positional short-range ordered JV’s exist below the line,
be-cause the resistivity should jump to the zero resistivity if the positional order is long range, as observed at the first-order melting transition for H储c.14Worthington et al.10previously found a similar two-stage resistive behavior for H储c in proton-irradiated 90-K YBCO and introduced the concept of vortex slush to explain the intermediate regime between the two transitions; the validity of this idea has been confirmed by a number of studies which include experiments,15 theories,11,20 and Monte Carlo simulation.21 In this regime, the vortices are thought to have a short-range translational order but no long-range phase order,10i.e., the vortex slush is a kind of vortex liquid; thus, this picture is in good agree-ment with the fact that the HFOT(T) line lies in the liquid regime. Moreover, in both reported experiments,10,15 the lower temperature region below the gradual transition is the vortex glass phase, which also significantly resembles our results. Although the previous reports10,15,20,21 were mostly about the configuration for H储c, Ikeda recently theoretically predicted that the vortex slush regime also appears for
H储ab,11which strongly supports our results.
One can notice that the oscillating HFOT(T) line relates to
the commensurability between a period of the JV’s configu-ration and the interlayer spacing. Ikeda and Isotani22actually predicted an oscillating first-order melting transition line in the disorder-free JV system as a result of the fact that a successive structural phase transition23 occurs as a function of the magnetic field. They predicted that such a sequence of the structural transitions would be found between the com-mensurate and incomcom-mensurate lattices. Since the melting temperature Tmis determined by the robustness of the lattice
against the thermal fluctuation, the former Tmis expected to be higher than the latter one, resulting in oscillation of the melting line. In this study therefore it seems that the com-mensurate lattice appears at around 70 and 120 kOe, as ex-pressed by arrows in Fig. 7. According to Ref. 22, two types of commensurate states appear. One is an ordinary lattice defined by the integer w, which describes the ratio between the period of a lattice and the interlayer spacing 关i.e., the (w⫺1)l layers exist between the layers occupied by the JV’s兴; e.g., in a w⫽1 lattice, a vacant layer without vortices is absent. Such an integer lattice is naturally expected to be strongly pinned by intrinsic pinning, because each vortex exists just in the middle of the adjacent layers. A lattice with a fraction w is also possible, where an integer lattice and an unpinned lattice, which is composed of the vortices located not in the middle of the neighboring layers, coexist; however, such a fractional lattice is easily destroyed by the disorders in the crystals. Thus it is adequate here that we consider integer lattices. The commensurability condition22of the in-teger lattice is theoretically given as pw2/⫽
冑
3 or 1/冑
3, where p(⫽2l2␥H/0) is the dimensionless magnetic field.Using values of ␥⫽17 and l⫽11.8 Å, this relation with w
⫽2 and 3 gives a commensurate field of 63 and 84 kOe,
respectively, so that these obtained values can explain one of the commensurate magnetic fields at around 70 kOe. On the other hand, we cannot find any commensurate integer lattice at around 120 kOe. Recently, Ikeda24 precisely re-examined the structure of the JV lattice at around p⯝1 and considered the special w⫽1 lattices which are created by rotating the
TOMOYUKI NAITO et al. PHYSICAL REVIEW B 68, 224516 共2003兲
basis vectors a1 and a2 of the ordinary integer lattices
counter-clockwise by an angle in the ac plane. Here, the component of the c-axis direction of the rotated basis vectors
a1c() and a2c() must satisfy the following condition:
M a1c()⫽Na2c()⫽MNl, where M and N are positive inte-gers. Such rotated lattices were named ( M ,N) lattices; their commensurability condition24 is given as p⫽
冑
3/( M2⫹N2⫺MN). According to the computed results in Ref. 24,
the commensurate field of the 共3, 1兲 state is 107 kOe, and this structure is stable in the wide field range between 101 and 134 kOe, therefore the commensurate field at around 120 kOe seems to come from the appearance of the共3, 1兲 lattice. The oscillating behavior above 120 kOe is obscure in com-parison with that below 110 kOe, because commensurability effects have a tendency to disappear as the flexibility of the JV configuration along the c axis direction diminishes.
A similar vertical and oscillating transition line defined by the resistivity jump was previously reported by Gordeev
et al. in oxygen deficient YBCO.7 They interpreted that the latter feature comes from the appearance of the vortex smec-tic phase, because the vortex liquid-to-smecsmec-tic transition line was predicted to oscillate as a result of the commensurability effect by Balents and Nelson theoretically.4 According to Ref. 4, the vortices in the smectic phase have a positional ordering along the c axis but not one in the ab planes, just like an ordinary liquid; i.e., the vortex smectic phase is also a kind of liquid. Although this picture seems to explain our results, we cannot accept it for the following reason. The authors of Ref. 4 predicted that the liquid-to-smectic transi-tion is second-order, which is evidently contradicted by the nature of the resistivity jump found here.
Recently, in oxygen deficient YBCO single crystals with
Tc⫽59.6 and 60.6 K, Lundqvist et al.9found the single ver-tical transition line characterized by a sharp drop in the out-of-plane resistivity. Although they did not describe the de-tailed nature of the JV transition, as mentioned above, such a complete resistivity drop means that the liquid phase freezes not into slush, but into lattice, via the first-order transition upon cooling. On the other hand, they also obtained nearly field-independent liquid-to-glass transition lines from the in-plane resistivity measurements8 in several oxygen deficient YBCO single crystals which are not the identical samples of Ref. 9. It is well known that the first-order transition of vor-tices can be observed in clean crystals and that it is destroyed by a pinning effect, which leaves us with a question about the quality of both our sample and theirs. However, both crystals have almost the same quality, judging from the su-perconducting transition width ⌬Tc in the zero magnetic field; both transition widths are about 2 K. Let us now con-sider the difference between our results and those of Ref. 9 in terms of the experimental configuration. Under the H储ab and I储c condition, the Lorentz force FL moves the JV’s along the layer, so that the intrinsic pinning is not effective. On the other hand, it naturally becomes the most effective under a typical configuration of the in-plane resistivity mea-surement(H⬜I). Therefore it seems valid that the anisotropy of the pinning strength induced by the FL direction causes
such a change in the vortex phase transition. Moreover, a
similar phenomenon can be found in the vortex phase dia-gram of optimally doped YBCO for H储c,15 where the first-order vortex lattice melting transition in the low magnetic fields changes to the first-order liquid-to-slush transition in the high magnetic fields, which is thought to come from the increase in the effectiveness of the pinning disorder with increasing magnetic field. Next, we consider why the first-order transition was not detected in Ref. 8. In 90-K YBCO,15,25the slight increase of the amount of oxygen va-cancy, which lowers the Tcbut hardly affects the⌬Tc, easily
destroys the first-order transition. Thus we speculate that the amount of pinning disorders, which do not explicitly contrib-ute to the ⌬Tc, but affects the vortex phase transition, in samples of Ref. 8 is greater than that in ours.
B. Nature of the second-order transition forÄ0° The oscillation of the HG(T) line seems to synchronize to
that of the HFOT(T) line, meaning that the glass transition temperature also is elevated by the commensurability effect, i.e., the intrinsic pinning grows stronger. This picture is very similar to the Bose glass transition,17 which has been ob-served for H储c in crystals with correlated disorders such as twin planes26 and columnar defects;27 the Bose glass transi-tion temperature tends to increase when the pinning effect strengthens. The nonsuperconducting layers act as a corre-lated pinning center if the intrinsic pinning is effective, mak-ing the Bose glass phase possible; the small s values in this region also support this possibility 共see next paragraph兲. Above 130 kOe, the HG(T) line does not oscillate and mono-tonically deviates from the HFOT(T) line, which represents
the fact that the commensurability effect is almost negligible in high magnetic fields, as found for the HFOT(T) line in the
same magnetic-field range.
We consider the nonuniversality of the critical exponent s, to clarify any doubt about the occurrence of the second-order liquid-to-glass transition. In the low magnetic fields below 50 kOe, the s value is 5.9⫾1.4, which is consistent with the reported values of s⫽6⫺8 共Ref. 14兲 in the vortex glass tran-sition. Therefore, in this region, the vortex glass transition undoubtedly occurs. The s value abruptly jumps to the smaller class of 1.3–2.9 between 80⭐H⭐120 kOe. A simi-lar small s value has been found in the Bose glass transition, for instance, s⫽2.8⫾0.2 in twinned 90-K YBCO,26 s⫽3.5
⫾0.5 in Bi-2212 with columnar defects,27 and s⫽2.6 in the
results of the Monte Carlo simulation.28 Thus the small s value in the intermediate magnetic fields supports the Bose glass transition, as discussed in the preceding paragraph. In the high magnetic fields above 130 kOe, the s value belongs to the larger class of 5– 8 again, therefore the glass phase is expected to be not Bose glass, but vortex glass. This is con-sistent with the fact that the commensurability effect is weak in this region. Consequently, we conclude that the continuous transition observed here represents that the vortex slush or liquid freezes into the glassy phase via a second-order tran-sition upon cooling, even though the critical behavior is non-universal.
V. CONCLUSION
We have studied the Josephson vortex phase diagram on 60-K YBCO single crystals by measuring the in-plane resis-tivity. We found that a two-stage phase transition, consisting of a first-order liquid-to-slush and a second-order slush-to-glass transitions, occurs in high magnetic fields above 60 kOe, and that the single second-order liquid-to-glass transi-tion occurs in low magnetic fields below 50 kOe. Our results demonstrate that the vortex slush regime exists as the inter-mediate phase between the glassy and the ordinary liquid phases in the Josephson vortex phase diagram.
ACKNOWLEDGMENTS
The authors would like to thank R. Ikeda and X. Hu for their helpful discussions, and H. Kita, H. Komatsu, I.Kimura, T. Horigome, and M. Uno for assisting with the experiments. We also would like to acknowledge J. A. Steeh for reviewing and editing this paper. The experiments were in part per-formed at the High Field Laboratory for Superconducting Materials, IMR, Tohoku University and at Low Temperature Science Division, Center for Low Temperature Science, To-hoku University. One of the authors 共T.N.兲 was financially supported by a Grant for Basic Science Research Projects
共Grant No. 000539兲 from the Sumitomo Foundation.
*Electronic address: [email protected]
1W. K. Kwok, J. Fendrich, U. Welp, S. Fleshler, J. Downey, and G. W. Crabtree, Phys. Rev. Lett. 72, 1088共1994兲.
2
M. Tachiki and S. Takahashi, Solid State Commun. 70, 291 共1989兲; 72, 1083 共1989兲.
3P. G. de Gennes, Solid State Commun. 10, 753共1972兲.
4L. Balents and D. R. Nelson, Phys. Rev. Lett. 73, 2618共1994兲; Phys. Rev. B 52, 12 951共1995兲.
5S. A. Grigera, E. Morre, E. Osquiguil, G. Nieva, and F. de la Cruz, Phys. Rev. B 59, 11 201共1999兲.
6M. F. Laguna, D. Dominguez, and C. A. Balseiro, Phys. Rev. B 62, 6692共2000兲.
7S. N. Gordeev, A. A. Zhukov, P. A. J. de Groot, A. G. M. Jansen, R. Gagnon, and L. Taillefer, Phys. Rev. Lett. 85, 4594共2000兲. 8B. Lundqvist O¨ . Rapp, and M. Andersson, Phys. Rev. B 62, 3542
共2000兲.
9B. Lundqvist O¨ . Rapp, M. Andersson, and Yu. Eltsev, Phys. Rev. B 64, 060503共2001兲.
10T. K. Worthington, M. P. A. Fisher, D. A. Huse, J. Toner, A. D. Marwick, T. Zabel, C. A. Feild, and F. Holtzberg, Phys. Rev. B 46, 11 854共1992兲.
11R. Ikeda and H. Adachi, J. Phys. Soc. Jpn. 69, 2993共2000兲. 12
T. Naito, T. Nishizaki, Y. Watanabe, and N. Kobayashi, in Ad-vances in Superconductivity IX, edited by S. Nakajima and M. Murakami共Springer-Verlag, Tokyo, 1997兲, p. 601.
13G. Blatter, V. B. Geshkenbein, and A. I. Larkin, Phys. Rev. Lett. 68, 875共1992兲.
14For a review, T. Nishizaki and N. Kobayashi, Supercond. Sci. Technol. 13, 1共2000兲, and references therein.
15T. Nishizaki, K. Shibata, T. Sasaki, and N. Kobayashi, Physica C 341–348, 957共2000兲; K. Shibata, T. Nishizaki, T. Sasaki, and N. Kobayashi, Phys. Rev. B 66, 214518共2002兲.
16M. P. A. Fisher, Phys. Rev. Lett. 62, 1415共1989兲; D. S. Fisher, M. P. A. Fisher, and D. A. Huse, Phys. Rev. B 43, 130共1991兲. 17D. R. Nelson and V. M. Vinokur, Phys. Rev. Lett. 68, 2398
共1992兲; Phys. Rev. B 48, 13 060 共1993兲.
18
T. Naito, H. Iwasaki, T. Nishizaki, K. Shibata, and N. Kobayashi 共unpublished兲.
19X. Hu and M. Tachiki, Phys. Rev. Lett. 85, 2577共2000兲. 20R. Ikeda, J. Phys. Soc. Jpn. 65, 3998共1996兲.
21Y. Nonomura and X. Hu, Phys. Rev. Lett. 86, 5140共2001兲. 22R. Ikeda and K. Isotani, J. Phys. Soc. Jpn. 68, 599共1999兲. 23L. Bulaevskii and J. R. Clem, Phys. Rev. B 44, 10 234共1991兲. 24R. Ikeda, J. Phys. Soc. Jpn. 71, 587共2002兲.
25A. I. Rykov, S. Tajima, F. V. Kusmartsev, E. M. Forgan, and Ch. Simon, Phys. Rev. B 60, 7601共1999兲.
26S. A. Grigera, E. Morre, E. Osquiguil, C. Balseiro, G. Nieva, and F. de la Cruz, Phys. Rev. Lett. 81, 2348共1998兲.
27W. S. Seow, R. A. Doyle, Y. Yan, A. M. Campbell, T. Mochiku, K. Kadowaki, and G. Wirth, in Critical Currents in Superconduct-ors, edited by T. Matsushita and K. Yamafuji共World Scientific, Singapore, 1996兲, p. 149.
28J. Lidmar and M. Wallin, Europhys. Lett. 47, 494共1999兲.
TOMOYUKI NAITO et al. PHYSICAL REVIEW B 68, 224516 共2003兲