Japan Advanced Institute of Science and Technology
JAIST Repository
https://dspace.jaist.ac.jp/
Title
A new marketing methodology by integrating brain measurement, eye tracking, and questionnaire analysis
Author(s) Suzuki, Yoshihiko; Shirahada, Kunio; Kosaka, Michitaka; Maki, Atsushi
Citation 2012 9th International Conference on Service Systems and Service Management (ICSSSM): 770-773
Issue Date 2012-07
Type Conference Paper
Text version author
URL http://hdl.handle.net/10119/10919
Rights
This is the author's version of the work. Copyright (C) 2012 IEEE. 2012 9th International Conference on Service Systems and Service
Management (ICSSSM), 2012, 770-773. Personal use of this material is permitted. Permission from IEEE must be obtained for all other uses, in any current or future media, including
reprinting/republishing this material for
advertising or promotional purposes, creating new collective works, for resale or redistribution to servers or lists, or reuse of any copyrighted component of this work in other works.
A new marketing methodology by integrating
brain measurement, eye tracking, and
questionnaire analysis
Yoshihiko Suzuki, Kunio Shirahada, and
Michitaka Kosaka School of Knowledge Science
Japan Advanced Institute of Science and Technology Nomi City, Japan
Atsushi Maki Hitachi Ltd., Japan
Soto-Kanda, Chiyoda-ku, Tokyo, Japan
Abstract— This paper proposes a new marketing methodology
that is achieved by integrating brain measurement, eye tracking, and questionnaire analysis. Questionnaire analysis has conventionally been used in marketing applications. Recently, brain science and eye tracking analysis have been the focus of intensive research and are now being applied in various fields. Questionnaire data, brain measurement data, and eye tracking data have different characteristics. We expect that by integrating such different information acquired through multi-sensor observation, more useful information for marketing can be obtained. This new idea was applied in an analysis of TV commercial (CM) videos, and the relationship between brain activity and eye movements obtained by clustering questionnaire data was analyzed for target customers. The effectiveness of this methodology is demonstrated.
Keywords—neural science; brain measurement; marketing; neural marketing;
I. INTRODUCTION
Neural science and technology has recently been applied to address social and business problems, and neural marketing is an important application field of neural science. In neural marketing, human brain measurement data or eye tracking data, which are obtained from unconscious human activities, are utilized to analyze human interests or attitudes about target products or services. Various methods such as functional magnetic resonance imaging (fMRI) and near-infrared spectroscopy (NIRS) are used to measure brain activity. The cost of such equipment has been decreasing due to advances in technology, and the application of such brain measurement systems is therefore expanding from medical usage to fields such as business and marketing. Research has been published,
for example, on branding analysis of coca-cola and pepsi-cola [1] and on the evaluation of Website effectiveness of a hot spring spa hotel that were carried out by measuring brain activity [2].
Incidentally, 20-50% of “Brain measurement” is said to be related to vision processing, thus vision processing in the human brain are deeply related. In particular, television commercial (CM) videos and advertising images provide information through visible media. Therefore, the combination of brain measurement and eye tracking measurement seems to provide useful information for evaluating their marketing effect. What part of an advertising image do people pay attention to, and how are their brains activated? This relationship seems to be important to analyze the effect of CM videos and advertising images.
This paper proposes a new methodology to evaluate the effectiveness of CM videos or advertising images by combining brain activity measurement data, eye tracking data, and questionnaire data. The conventional methodology for evaluating these effects uses only questionnaire data. By combining human biological measurement data and questionnaire data in the proposed methodology, we can evaluate them more precisely from both objective and subjective viewpoints. Moreover, the effectiveness of the proposed methodology is demonstrated through an experiment using real CM video data.
II. NEWMETHODOLOGYOFINTEGRATINGNIRS, EYETRACKING,ANDQUESTIONNAIREDATA
Figure 1 New methodology for strategic marketing Fig. 1 shows the proposed methodology for evaluating CM video or advertising images by integrating NIRS, eye tracking, and questionnaire data. In this methodology, a CM video is shown to an examinee. Then the brain activity of his response to the video is measured by using NIRS, and his point of gaze is measured by using the eye tracking system. Also, a questionnaire is answered after the experiment. The questions in the questionnaire cover the examinees’ age, sex, frequency of product usage, and other relevant details. The proposed methodology aims to obtain new findings by combining different types of data, in this case, brain measurement data, eye tracking data, and questionnaire data. Several techniques can be used to process these different data, for example, data clustering and time series data analysis. Determining the optimal combination of techniques is a topic requiring further study.
The proposed methodology is similar to a multi-sensor integration system, which integrates different types of sensor data in order to estimate the target’s state more precisely [3].
se Target state Sensor #1 Sensor #3 Sensor #4 Sensor #N Sensor #2 Integration of
various type sensors for identifying Target state
Figure 2 Multi-sensor integration system
III. EXPERIMENTTOEVALUATETHEPROPOSED METHODOLOGY
A. Outline of experiment using CM video
The proposed methodology was applied in the following experiment using a NIRS system and an eye tracking system to evaluate the marketing effectiveness of a CM video. (1) Experimental system
An optical topography device (Hitachi ETG-4000) was used
for the NIRS measurements, and an eye-tracking system (Tobii T60; Tobii Technology AB) was used to track subjects’ eye movements in this experiment. The ETG-4000 has 46 channels for measuring points and a 10-Hz measurement interval [4][5]. The experimental system is shown in Fig. 3
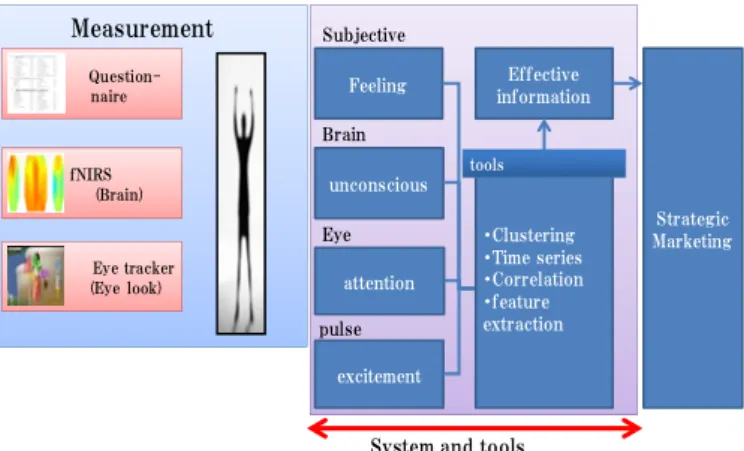
Measurement Question-naire Eye tracker (Eye look) fNIRS (Brain) Feeling unconscious attention excitement Effective information ・Clustering ・Time series ・Correlation ・feature extraction Strategic Marketing tools Subjective Brain Eye pulse
System and tools
Figure 3 Experimental system (2) CM video data and experiment procedure
This experiment consisted of showing examinees four different videos, A, B, C, and D, of one drink product. CM videos A and C are popular CM videos in which a famous actress promotes the target product. CM videos B and D, in which the actress does not appear, are new videos that are not as popular as the others. There were two scenarios in this experiment; in one, video C was shown after video A, and in the other, video D was shown after video B to the examinees. Each CM video was 15 seconds long, and there was a 30-second rest after every CM video was shown. Each display was executed three times. The experimental flow is shown in Fig. 4.
Figure 4 Experimental flow (3) Examinees
A total of 30 people, 10 men and 20 women, participated in this experiment. They were selected randomly and were all living in Kanazawa city near the JAIST institute. The average age was 38.8 years old.
B. Data analysis Several methods can be used to analyze brain measurement data. Fig. 5 shows an image of measurement data; this image is referred to as a heat map. In the image, red indicates high activity, and blueindicates low activity in the brain.
(1) Questionnaire analysis
Questionnaire data are subjective and conscious data. It is very important to write questions that make it possible to glean findings from questionnaire analysis. The topics of the questions in this experiment consisted of the following information:
・personal characteristics: age, sex, ・preferences regarding the target drink ・frequency of buying the target drink ・recognition of each CM video ・preference for each CM video
The recognition results for the CM data are presented in Table 1. The high recognition results indicate that CM video A had a rate of 76.7(%), CM video C was 63.3(%), CM video D was 60(%), and CM video B was 50(%). The two CM videos that showed the famous actress had higher rates than the other two CM videos. Also, the men’s recognition of A and C was higher than the women’s.
Fig. 5 Heat map of brain measurement data
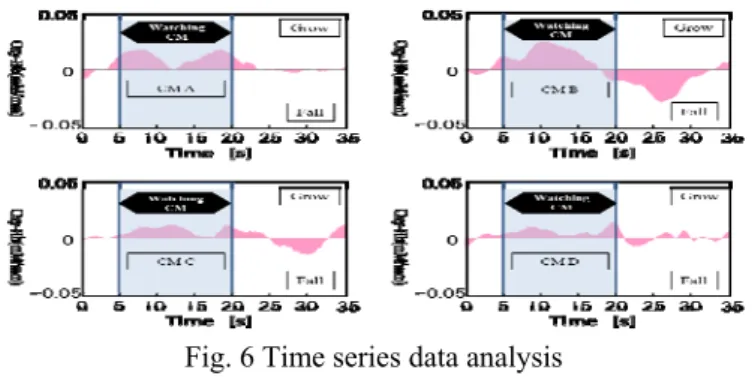
Another analysis method is a time series analysis. Fig. 6 shows an example of time series data in which all measurement data are averaged. This figure shows the changes in brain activity. The high activity in the brain seems to correspond to the examinees’ interest in the scene of the target CM video. These are unconscious data.
TABLE 1. RECOGNITION RATIO OF CM DATA
The cognitive situation(%) A B C D
High hypothesize 76.7 50.0 63.3 60.0
Middle hypothesize 13.3 16.7 23.3 26.7
Low hypothesize 10.0 33.3 13.3 13.3
The preference results of the CM data are given in Table 2. Preferences of CM data indicate that the first is A, the second B, the third C, and the fourth C. CM videos A and C, which feature the famous actress, were higher than those for B and D. Men’s preference for A and C was higher than women’s.
TABLE 2. PREFERENCE OF CM DATA
Fig. 6 Time series data analysis
Relative ranking(%) A B C D 1 43.3 13.3 33.3 10.0 2 30 23.3 36.7 10.0 3 13.3 46.7 13.3 25.7 4 13.3 16.7 16.7 53.3 Average ranking 2.0 2.7 2.1 3.2
C. Eye tracking data
The eye-tracking system can track human eye movements by tracking corneal reflections. The device manufacturer, Tobii Technology, explains that the system can create reflection patterns on the cornea of the eyes by irradiating the subject’s eyes with near-infrared illuminators and then register the image of the user’s eyes. Image processing is used to find the eyes, thereby identifying the correct reflections from the illuminators and their exact positions.
In this experiment, the obtained data were clustered by using software for analyzing eye tracking data: 「 Tobii Studio」. An example of clustering data is shown in Fig. 7. This figure shows which parts of the CM video examinees paid most attention to.
(2) Brain measurement data
Changes in cerebral blood volume and oxygen saturation can be estimated using NIRS. This technique is a graphical tool for measuring hemoglobin concentration in the brain. The examinee wears a probe set that irradiates and detects near-infrared rays. The probe can measure brain activity from many points. The NIRS data contain various kinds of noise such as high frequency noise and low frequency bias. Therefore, these noise effects were removed by using software for brain measurement data analysis「POTATO_ver3.7」developed by Hitachi.
(4) The preference for the target drink influenced the examinees’ brain activity. In particular, examinees who had a high preference for the drink showed a high preference for CM videos A and C, in which the famous actress appeared.
Fig. 7 Clustering eye-tracking data
C. Future work
This research is in its initial stages. Many issues need to be addressed in order to use it in real marketing applications. The following topics are issues for future research.
(1) Selecting NIRS channels: There are many channels in NIRS. Each channel measures a different part of the brain. The activity in each part is different from other areas. Therefore, we should choose suitable channels for analyzing various characteristics as responses to CM videos or advertising images. More knowledge of brain science is required to do this research.
IV. INTEGRATIONOFDIFFERENTTYPESOFDATA A. Combined brain measurement and eye tracking
An image that integrates the brain measurement data in Fig. 6 and the eye tracking data in Fig. 7 is shown in Fig. 8. This figure shows the changes in the relationship between the brain activity and the part of the CM video examinees paid a lot of attention to. If examinees are clustered by using questionnaire data, then a Fig. 8 image can be obtained for each cluster. These data reveal the characteristics of unconscious data for the target CM video.
(2) Systematizing methodologies and tools: The strategic marketing system shown in Fig. 1 is our research target. To achieve this, methodologies and tools related to this research should be systematized. Also, the effectiveness should be demonstrated through many experiments by using different kinds of video data /advertising image data and various types of examinees.
V. CONCLUSION
This paper presented a new marketing methodology that involves integrating brain measurement data, eye tracking data, and questionnaire data. The effectiveness of the proposed methodology was demonstrated through an experiment using CM videos. This research has just started, and many issues still need to be addressed to utilize the proposed methodology in real business applications. However, the application of neural science to marketing is expected to bring new insights on customer preferences and behaviors.
Fig. 8 Combination of brain measurement and eye tracking
B. New findings through this experiment
REFERENCES
The following new findings were obtained through this
experiment. (1) M. M. Samuel, L. Jian, and T. Damon, et al.: “Neural correlates of behavioral preference for culturally familiar drinks,” Neuron, Vol. 44, pp. 379-387 (2004).
(1) The brain activity toward the target videos differed between men and women. Male examinees paid more attention to the scenes with the actress, and their brain activity at that time seemed to be highly activated.
(2) K. Shirahada, S. Imoto, M. Kosaka, and T. Katsura: ”Near-infrared spectroscopy approach for web based service marketing,” PICMET 2010 Proceedings, pp. 572-578 (2010).
(3) M. Kosaka, S. Miyamaoto, and H. Ihara: ”A track correlation algorithm for multi-sensor integration,” AIAA Journal of Guidance, Control and Dynamics, Vol. 10, No. 2, pp. 166-171 (1987).
(2) Most of all examinees were looking at similar parts in CM videos but their brain activities were different depending on customers’ clusters obtained from questionnaire analysis.
(4) M. Peña, A. Maki, D. Kovac̆ić, G. Dehaene-Lambertz, H. Koizumi, F. Bouquet, and J. Mehler, “Sounds and silence: An optical
topography study of language recognition at birth,” Proceedings of the National Academy of Sciences of the United States of America, Vol. 100, No. 20, pp. 11702-11705, 2003.
(3) The effectiveness of CM videos with and without sound was compared in this experiment. The difference between the two cases was especially noticeable in the male examinees.
(5) R. Kennan, D. Kim, A. Maki, H. Koizumi, and T. Constable, “Non-invasive assessment of language lateralization by transcranial near infrared optical topography and functional MRI,” Human Brain Mapping, Vol. 16, No. 3, pp. 183-189.