Control of the Transition between Ni-C and Ni-SIa States by the Redox State of the Proximal Fe-S Cluster in the Catalytic Cycle of [NiFe] Hydrogenase
10
0
0
全文
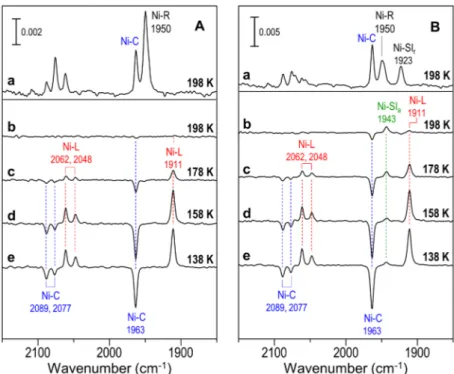
(2) COMMUNICATION [NiFe] hydrogenase from DvMF[8c] and Ralstonia eutropha H16,[8e] showing formation of the Ni-L state by light irradiation. Under N2 atmosphere, in addition to the 1911-cm-1 νCO band, a positive νCO band was observed at 1943 cm-1 in the light-minus-dark difference spectra of the H2-activated state (Figure 2B). The value of 1943 cm-1. the light-minus-dark difference spectra (Figure 2B, curve b). The lightinduced FT-IR spectrum changed back to the initial spectrum (spectrum before irradiation) when light irradiation was stopped under both H2 and N2 atmospheres at 198 K, and no intensity change was observed for the νCO and νCN bands of the Ni-L and Ni-SIa states in the difference (after-minus-before) spectra between the spectra after and before irradiation (all spectra were measured in the dark) (Figures S1 and S2 in the Supporting Information). However, the positive νCO and νCN bands of the Ni-L state were observed in the afterminus-before difference spectra under N2 atmosphere at 138 and 158 K. These results show that the Ni-L state was trapped at low temperatures. The νCO band of the Ni-SIa state was also observed in the afterminus-before difference spectra at 138–178 K (Figure S2 in the Supporting Information), showing that the Ni-SIa state was also trapped at low temperatures. By increasing the measurement temperature, the intensities of the νCO bands of the Ni-L and Ni-SIa states in the after-minus-before difference spectra began to decrease from those of the corresponding bands in the light-minus-dark difference spectra. The intensity of the 1911-cm-1 νCO band of the Ni-L state began to decrease at a lower temperature (~158 K) compared to that of the 1943-cm-1 νCO band of the NiSIa state (~178 K) (Figure S2 in the Supporting Information), showing that the Ni-L state was less stable against temperature. The intensity of the νCO band of the Ni-L state in the light-minus-dark difference spectra under N2 atmosphere increased Figure 2. FT-IR spectra of H2-activated [NiFe] hydrogenase from DvMF under (A) H2 and (B) N2 atmosphere at 138, 158, 178, and 198 K: (a) FT-IR spectra before light irradiation. (b–e) Difference with a decrease in temperature, whereas that of the (light-minus-dark) FT-IR spectra between the spectra with and without light irradiation. Ni-SIa state decreased (Figure 2B). These results indicate that the Ni-L state was converted efficiently to the Ni-SIa state under N2 atmosphere at higher temperatures such as 198 K, whereas a certain amount of the Ni-L state was trapped as an intermediate and could not convert to the Ni-SIa state at lower temperatures such as 138 K, although there are possibilities that the NiC state may have converted directly to the Ni-SIa state by light irradiation. It is noteworthy that no transition of the Ni-C state to the Ni-SIa state was observed with light irradiation under H2 atmosphere, although the transition was observed under N2 atmosphere (Figure 2). The percentage of the transition of the Ni-C state to the Ni-L state by light irradiation was similar under H2 and N2 atmosphere for each temperature studied (138–198 K) (Figure 3 and Figures S1 and S2 in the Supporting Information). According to the intensity change of the νCO band by light irradiation, the overall percentage of the Ni-C state Figure 3. Overall percentages of the Ni-C state converted by light irradiation under H2 (open square) and N2 (closed circle) atmospheres, together with the percentages of the converted by light irradiation at 198 K under H2 and N2 atmosphere Ni-C state converted to the Ni-L state (closed square) and Ni-SIa state (closed triangle) was ~3 % and ~18 %, respectively (Figure 3). The difference in the by light irradiation under N2 atmosphere. The Ni-C state converted only to the Ni-L transition efficiency (~15 %) of the Ni-C state under H2 and N2 state under H2 atmosphere. atmospheres corresponded well to the percentage of the Ni-C state converted to the Ni-SIa state under N2 atmosphere (~14 %). Although the Ni-L state was trapped and observed in the light-minus-dark corresponded well to the frequency of the νCO band of the Ni-SIa difference spectra at lower temperatures (138–178 K), the difference in [4b] state. These results indicate that the Ni-C state was converted also to the transition efficiency of the Ni-C state under H2 and N2 atmospheres the Ni-SIa state by the light irradiation under N2 atmosphere. also corresponded well to the percentage of the Ni-C state converted to Approximately 4 and 14 % of the Ni-C state was converted to the the Ni-SIa state under N2 atmosphere at lower temperatures (Figure 3). Ni-L and Ni-SIa states, respectively, by light irradiation under N2 Therefore, the percentage of the conversion of the Ni-C state increased atmosphere at 198 K, according to the intensities of the νCO bands in under N2 atmosphere compared to that under H2 atmosphere..
(3) COMMUNICATION It has been reported that the proximal [Fe4S4]p2+/+ cluster is reduced when the paramagnetic Ni-C state is generated in H2-activated [NiFe] hydrogenase under H2 atmosphere.[1d,10] Therefore, we measured the EPR spectra of [NiFe] hydrogenase from DvMF under H2 and N2 atmospheres to characterize the redox state of the proximal [Fe4S4]p2+/+ cluster under each condition. The Ni EPR signals of the Ni-C state of H2-activated [NiFe] hydrogenase were observed at gx = 2.197, gy = 2.144, and gz = 2.010 under H2 atmosphere at 50 K (Figure 4). The intensities of these Ni3+ signals increased when the atmosphere was changed from H2 to N2 at 50 K, owing to the increase in the amount of the Ni-C state (mainly due to the decrease in the amount of the Ni-R state). A broad signal of the reduced [Fe4S4]p/d+ clusters was also observed at g = 1.86 in the EPR spectra under both H2 and N2 atmospheres below 10 K.[10a-c] The intensity of the broad g = 1.86 signal in the spectra under N2 atmosphere was lower than that in the spectra under H2 atmosphere, suggesting a less amount of [Fe4S4]p2+/+ clusters were reduced in the Ni-C state under N2 atmosphere. Similar characteristics in the EPR signals have been reported for [NiFe] hydrogenase from D. gigas.[10d] Changing the atmosphere from H2 to N2 may shift the redox potential of the solvent (water) to a less negative redox potential, where the protons from the water act as oxidants.[10d] The distance between the Ni atom and the nearest Fe atom of the proximal [Fe4S4]p2+/+ cluster is 10.9 Å for [NiFe] hydrogenase from DvMF.[3] At a relatively high temperature (50 K), the spin relaxation of the [Fe4S4]p+ cluster was fast and averaged out, resulting in relatively sharped Ni signals in the EPR spectra. The spin-spin interaction between the paramagnetic Ni3+ site (S = 1/2) and paramagnetic reduced proximal [Fe4S4]p+ cluster (S = 1/2) in the Ni-C state causes broadening and splitting in the Ni signals at low temperatures.[1d,10] The Ni signals at gy = 2.144 and gz = 2.010 of the Ni-C state under H2 atmosphere at 50 K became broader at 20 K (Figure 4 and Figure S3 in the Supporting Information). The Ni signals at gx = 2.197 and gy = 2.144 of the Ni-C state under H2 atmosphere at 50 K split into two components at gx = 2.176 and 2.218 and gy = 2.106 and 2.182, respectively, at 10 K, and their intensities increased at 4 K. The Ni signal at gz = 2.010 at 50 K also split into four components at gz = 1.978, 1.994, 2.034, and 2.057, at 10 K, and their intensities also increased at 4 K. No un-split Ni signal was observed at gy = 2.144 and gz = 2.010 in the spectra under H2 atmosphere at 4 and 10 K. These results strongly indicate that almost all the proximal [Fe4S4]p2+/+ clusters in the Ni-C state were reduced under H2 atmosphere, where the [Fe4S4]p+ cluster spin-spin coupled with the Ni3+ center. Under N2 atmosphere, relatively sharp signals at gx = 2.197, gy = 2.144, and gz = 2.010 were detected for the Ni-C state at 20 K, indicating the presence of the oxidized [Fe4S4]p2+ clusters (Figure 4). At lower temperatures (T = 4 and 10 K), both un-split (gx = 2.197, gy = 2.144, and gz = 2.010) and split (gx = 2.176 and 2.218, gy = 2.106 and 2.182, and gz = 1.978, 1.994, 2.034, and 2.057) Ni signals were observed. We confirmed the presence of oxidized [Fe4S4]p2+ clusters in the Ni-C state under N2 atmosphere by the observation of the un-split signals. According to the intensity of the Ni signals at 4 K, about 15 % of the [Fe4S4]p2+/+ clusters in the Ni-C state were oxidized under N2 atmosphere. The amount of the oxidized [Fe4S4]p2+ clusters corresponded well to the percentage (~14 %) of the Ni-C state converted to the Ni-SIa state by light irradiation under N2 atmosphere at 198 K obtained by IR measurements (Figure 3). At 198 K, the Ni-L state is not trapped and can covert to the Ni-SIa state (Figure S2 in the Supporting Information). These results indicate that the transition of. the Ni-C state to the Ni-SIa state is related to the redox state of the [Fe4S4]p2+/+ cluster. Therefore, the redox state of the proximal [Fe4S4]p2+/+ cluster may control the transition of the Ni-C state to the Ni-SIa state. The transition of the Ni-C state to the Ni-SIa state produces a proton and an electron (Scheme 1).[1] The produced electron may be transferred to its redox partner cyt c3 through the proximal [Fe4S4]p2+/+ cluster. When the [Fe4S4]p2+/+ cluster is reduced ([Fe4S4]p+), it may not be able to receive an electron, and thus the transition of the Ni-C state to the Ni-SIa state is inhibited.. Figure 4. EPR spectra of reduced [NiFe] hydrogenase from DvMF under H2 (blue) and N2 (red) atmospheres at 4, 10, 20, and 50 K. The g-values of the [Fe4S4]p/d+ cluster and un-split Ni-C signals are shown in black and red broken lines, respectively. The gvalues of the split Ni-C signals are shown in cyan (gx), blue (gy), and dark blue (gz) broken lines. Measuring conditions: microwave frequency, 9.645 GHz; microwave power, 2 mT; modulation power, 100 KHz.. Scheme 1. Proposed catalytic cycle for [NiFe] hydrogenase..
(4) COMMUNICATION In [NiFe] hydrogenase, H2 is cleaved heterolytically by transition of the Ni-SIa state to the fully reduced Ni-R state (Ni2+) with a bridged Hand reduced [Fe4S4]p+ cluster (Scheme 1).[1d,11] By one electron oxidation of the Ni-R state, the Ni-C state (Ni3+) with a bridged H- and reduced [Fe4S4]p+ cluster is produced,[12] where the electron is transferred to cyt c3 through the [Fe4S4]p2+/+ cluster. A proton is generated by oxidation of H- at the NiFe site, resulting in the formation of the Ni-L state (Ni1+).[12] The produced proton is transferred to one of the Ni-coordinating, terminal cysteine (Cys546), as proposed by theoretical and Raman studies.[8e,13] The reaction is terminated at the Ni-L state when the [Fe4S4]p2+/+ cluster is reduced ([Fe4S4]p+). When the [Fe4S4]p+ cluster is oxidized to [Fe4S4]p2+, the Ni-L state may be converted to the Ni-SIa state by electron transfer from the Ni site to the [Fe4S4]p2+ cluster with release of the proton from Cys546, completing the H2 cleavage catalytic cycle. In the absence of H2, the Ni-SIa state is converted to the Ni-C state through the Ni-L state, when the [Fe4S4]p2+/+ cluster is reduced. Kampa et al. proposed that formation of the Ni−Fe bond is essential for generation of the Ni-L state, where the Ni−Fe bond increases the basicity of the active site.[13a] In conclusion, the Ni-L state of [NiFe] hydrogenase from DvMF is presumably an intermediate between the transition of Ni-C and Ni-SIa states. The transition occurred only when the [Fe4S4]p2+/+ cluster was oxidized and could accept an electron, showing that the redox state of the [Fe4S4]p2+/+ cluster may control the transition of the Ni-C state to the Ni-SIa state. These findings provide new insights into the mechanisms of the catalytic cycle of [NiFe] hydrogenases. Received: xxxx xx, 20xx Published online: xxxx xx, 20xx. Keywords: biocatalysis • [NiFe] hydrogenase • Fe-S cluster • FT-IR spectroscopy • EPR spectroscopy [1] a) P. M. Vignais, B. Billoud, Chem. Rev. 2007, 107, 4206-4272; b) A. L. De Lacey, V. M. Fernandez, M. Rousset, R. Cammack, Chem. Rev. 2007, 107, 43044330; c) W. Lubitz, E. Reijerse, M. van Gastel, Chem. Rev. 2007, 107, 43314365; d) W. Lubitz, H. Ogata, O. Rudiger, E. Reijerse, Chem. Rev. 2014, 114, 4081-4148; e) H. Ogata, W. Lubitz, Y. Higuchi, Dalton Trans. 2009, 7577-7587; f) T. Yagi, Y. Higuchi, Proc. Jpn. Acad. Ser. B 2013, 89, 16-33. [2] a) A. Volbeda, M. H. Charon, C. Piras, E. C. Hatchikian, M. Frey, J. C. Fontecilla-Camps, Nature 1995, 373, 580-587; b) J. W. Peters, W. N. Lanzilotta, B. J. Lemon, L. C. Seefeldt, Science 1998, 282, 1853-1858; c) T. Hiromoto, E. Warkentin, J. Moll, U. Ermler, S. Shima, Angew. Chem. Int. Ed. 2009, 48, 64576460. [3] a) Y. Higuchi, H. Ogata, K. Miki, N. Yasuoka, T. Yagi, Structure 1999, 7, 549556; b) H. Ogata, Y. Mizoguchi, N. Mizuno, K. Miki, S.-i. Adachi, N. Yasuoka,. T. Yagi, O. Yamauchi, S. Hirota, Y. Higuchi, J. Am. Chem. Soc. 2002, 124, 11628-11635. [4] a) R. P. Happe, W. Roseboom, A. J. Pierik, S. P. Albracht, K. A. Bagley, Nature 1997, 385, 126; b) C. Fichtner, C. Laurich, E. Bothe, W. Lubitz, Biochemistry 2006, 45, 9706-9716. [5] a) T. Yagi, J. Biochem. 1970, 68, 649-657; b) N. Yahata, T. Saitoh, Y. Takayama, K. Ozawa, H. Ogata, Y. Higuchi, H. Akutsu, Biochemistry 2006, 45, 1653-1662. [6] a) H. Ogata, S. Hirota, A. Nakahara, H. Komori, N. Shibata, T. Kato, K. Kano, Y. Higuchi, Structure 2005, 13, 1635-1642; b) M. van Gastel, M. Stein, M. Brecht, O. Schroder, F. Lendzian, R. Bittl, H. Ogata, Y. Higuchi, W. Lubitz, J. Biol. Inorg. Chem. 2006, 11, 41-51. [7] a) A. L. de Lacey, E. C. Hatchikian, A. Volbeda, M. Frey, J. C. Fontecilla-Camps, V. M. Fernandez, J. Am. Chem. Soc. 1997, 119, 7181-7189; b) A. Pardo, A. L. De Lacey, V. M. Fernandez, H.-J. Fan, Y. Fan, M. B. Hall, J. Biol. Inorg. Chem. 2006, 11, 286-306. [8] a) J. W. van der Zwaan, S. P. Albracht, R. D. Fontijn, E. C. Slater, FEBS Lett. 1985, 179, 271-277; b) C. Fichtner, M. van Gastel, W. Lubitz, Phys. Chem. Chem. Phys. 2003, 5, 5507-5513; c) P. Kellers, M. E. Pandelia, L. J. Currell, H. Gorner, W. Lubitz, Phys. Chem. Chem. Phys. 2009, 11, 8680-8683; d) M. Horch, L. Lauterbach, M. Saggu, P. Hildebrandt, F. Lendzian, R. Bittl, O. Lenz, I. Zebger, Angew. Chem. Int. Ed. 2010, 49, 8026-8029; e) E. Siebert, M. Horch, Y. Rippers, J. Fritsch, S. Frielingsdorf, O. Lenz, F. Velazquez Escobar, F. Siebert, L. Paasche, U. Kuhlmann, F. Lendzian, M.-A. Mroginski, I. Zebger, P. Hildebrandt, Angew. Chem. Int. Ed. 2013, 52, 5162-5165; f) M. E. Pandelia, H. Ogata, L. J. Currell, M. Flores, W. Lubitz, J. Biol. Inorg. Chem. 2009, 14, 1227-1241; g) H. Osuka, Y. Shomura, H. Komori, N. Shibata, S. Nagao, Y. Higuchi, S. Hirota, Biochem. Biophys. Res. Commun. 2013, 430, 284-288; h) A. Ciaccafava, C. Hamon, P. Infossi, V. Marchi, M. T. Giudici-Orticoni, E. Lojou, Phys. Chem. Chem. Phys. 2013, 15, 16463-16467. [9] M. Y. Darensbourg, E. J. Lyon, J. J. Smee, Coord. Chem. Rev. 2000, 206, 533561. [10] a) R. Cammack, D. S. Patil, E. C. Hatchikian, V. M. Fernandez, Biochim. Biophys. Acta 1987, 912, 98-109; b) B. Guigliarelli, C. More, A. Fournel, M. Asso, E. C. Hatchikian, R. Williams, R. Cammack, P. Bertrand, Biochemistry 1995, 34, 4781-4790; c) P. Bertrand, P. Camensuli, C. More, B. Guigliarelli, J. Am. Chem. Soc. 1996, 118, 1426-1434; d) V. M. Fernandez, E. C. Hatchikian, D. S. Patil, R. Cammack, Biochim. Biophys. Acta 1986, 883, 145-154. [11] a) S. J. George, S. Kurkin, R. N. F. Thorneley, S. P. J. Albracht, Biochemistry 2004, 43, 6808-6819; b) S. Kurkin, S. J. George, R. N. F. Thorneley, S. P. J. Albracht, Biochemistry 2004, 43, 6820-6831; c) L. M. Roberts, P. A. Lindahl, J. Am. Chem. Soc. 1995, 117, 2565-2572; d) S. Ogo, K. Ichikawa, T. Kishima, T. Matsumoto, H. Nakai, K. Kusaka, T. Ohhara, Science 2013, 339, 682-684. [12] a) M. Stein, E. van Lenthe, E. J. Baerends, W. Lubitz, J. Am. Chem. Soc. 2001, 123, 5839-5840; b) S. Foerster, M. Stein, M. Brecht, H. Ogata, Y. Higuchi, W. Lubitz, J. Am. Chem. Soc. 2003, 125, 83-93; c) M. Brecht, M. van Gastel, T. Buhrke, B. Friedrich, W. Lubitz, J. Am. Chem. Soc. 2003, 125, 13075-13083. [13] a) M. Kampa, M. E. Pandelia, W. Lubitz, M. van Gastel, F. Neese, J. Am. Chem. Soc. 2013, 135, 3915-3925; b) M. Horch, J. Schoknecht, M. A. Mroginski, O. Lenz, P. Hildebrandt, I. Zebger, J. Am. Chem. Soc. 2014, 136, 9870-9873..
(5) COMMUNICATION Biocatalysis. COMMUNICATION Hulin Tai, Koji Nishikawa, Masayuki Suzuki, Yoshiki Higuchi, and Shun Hirota* Page No.1 – Page No.4 The Ni-L state of [NiFe] hydrogenase was found to be an intermediate between the transition of the Ni-C and Ni-SIa states according to the FT-IR spectra under light irradiation at 138–198 K. The transition of the Ni-C state to the Ni-SIa state occurred when the proximal [Fe4S4]p2+/+ cluster was oxidized, but not when it was reduced. These results show that the catalytic cycle of [NiFe] hydrogenase is controlled by the redox state of its [Fe4S4]p2+/+ cluster.. Control of the Transition between Ni-C and Ni-SIa States by the Redox State of the Proximal Fe-S Cluster in the Catalytic Cycle of [NiFe] Hydrogenase.
(6) Contents. 1.. Experimental Section Preparation of [NiFe] hydrogenase from Desulfovibrio vulgaris Miyazaki F FT-IR measurements EPR measurements. p. S2. 2.. Figure S1. FT-IR spectra of H2-activated [NiFe] hydrogenase from Desulfovibrio vulgaris Miyazaki F under H2 atmosphere.. p. S3. 3.. Figure S2. FT-IR spectra of H2-activated [NiFe] hydrogenase from Desulfovibrio vulgaris Miyazaki F under N2 atmosphere.. p. S4. 4.. Figure S3. Expanded EPR spectra of H2-activated [NiFe] hydrogenase from Desulfovibrio vulgaris Miyazaki F under H2 atmosphere.. p. S5. S1.
(7) Experimental Section Preparation of [NiFe] hydrogenase from Desulfovibrio vulgaris Miyazaki F. [NiFe] hydrogenase was isolated from sulfate reducing bacterium Desulfovibrio vulgaris Miyazaki F and purified as described previously.[1] [NiFe] hydrogenase was prepared in 25 mM Tris/HCl (pH 7.4) buffer, and the sample solution was concentrated with Amicon (30,000) to desired concentrations. The concentration of [NiFe] hydrogenase was adjusted with its absorption at 400 nm using its absorption coefficient (ε = 47 mM-1cm-1).[2] FT-IR measurements. [NiFe] hydrogenase (concentration ~1 mM) solution was degassed with a vacuum line, purged with 1 bar of H2, and incubated at 37 °C for 6 h to obtain H2-activated samples for FT-IR measurements. To obtain H2-activated samples under N2 atmosphere, the sample solution was further degassed with the vacuum line and purged with 1 bar of N2. The samples were transferred anaerobically into an infrared cell with CaF2 windows, prior to freezing in liquid N2. A cryostat system (CoolSpeK IR USP-203IR-A, Unisoku, Hirakata) was used to control the temperature. FT-IR spectra of [NiFe] hydrogenase were measured during light irradiation at 138– 198 K with a FT-IR spectrometer equipped and an MCT detector (FT-IR 6100V, JASCO, Tokyo). Spectral data were collected at 2 cm-1 resolution and averaged with 1024 scans. The corresponding buffer spectrum was collected as a reference spectrum and subtracted from the sample spectra. Light irradiation at 514.5 nm was performed with an Ar+ laser (Model 2017, Spectra-Physics, Santa Clara) at 138, 158, 178, and 198 K. The laser power was 500 mW/cm2 at the sample point. The amount of the Ni-L and Ni-SIa states were estimated from the intensities of their νCO bands in the FT-IR spectra. The intensity of the νCO band of the Ni-L state in the different spectrum between the spectra with and without light irradiation under N2 atmosphere at 158–198 K was calibrated by multiplying a factor of 1.07, which corresponded to the intensity ratio of the νCO bands of the Ni-C and Ni-L states in the difference spectrum under H2 atmosphere at 138 K. The intensity of the νCO band of the Ni-SIa state in the difference spectrum at 138–178 K was calibrated by multiplying a factor of 1.28, which corresponded to the intensity ratio of the νCO bands of the Ni-C and Ni-SIa states in the difference spectrum under N2 atmosphere at 198 K. EPR measurements. [NiFe] hydrogenase (concentration ~0.8 mM) in 25 mM Tris/HCl (pH 7.4) buffer was transferred into a 4 mm ϕ EPR tube. The sample solution was treated with H2 and N2 in the same way as the FT-IR sample. EPR spectra of [NiFe] hydrogenase were measured at 4–50 K with an EPR spectrometer (E-500, Bruker). The frequency, microwave power, and modulation power, were 9.645 GHz, 2 mW, and 100 KHz, respectively. References [1] Y. Higuchi, H. Ogata, K. Miki, N. Yasuoka, T. Yagi, Structure 1999, 7, 449-556; b) H. Ogata, Y. Mizoguchi, N. Mizuno, K. Miki, S.-i. Adachi, N. Yasuoka, T. Yagi, O. Yamauchi, S. Hirota, Y. Higuchi, J. Am. Chem. Soc. 2002, 124, 11628-11635. [2] T. Yagi, K. Kimura, H. Daidoji, F. Sakai, S. Tamura, J. Biochem. 1976, 79, 661-671.. S2.
(8) 0.002 Ni-R 2077, 2063. Ni-C 2089, 2077. Ni-R 1951 Ni-C 1963. A. B. 0.002. 198 K Ni-L 2062, 2048. 198 K. Ni-L 1911. Absorbance. Absorbance. 178 K. 178 K. 158 K. 158 K. 138 K Ni-C 2089, 2077 Ni-C 1963. 138 K. 2100 2000 1900 Wavenumber (cm-1). 2100 2000 1900 Wavenumber (cm-1). Figure S1. FT-IR spectra of H2-activated [NiFe] hydrogenase from Desulfovibrio vulgaris Miyazaki F under H2 atmosphere at 138, 158, 178, and 198 K. (A) FT-IR spectra before light irradiation. (B) Difference FT-IR spectra between the spectra with and without light irradiation (light-minus-dark, black) and between those after and before light irradiation (after-minus-before, pink).. S3.
(9) 0.005. Ni-R Ni-C 1950 1963 Ni-SIr 1923. A. Ni-L 2062, 2048. 198 K. 178 K. Absorbance. Absorbance. Ni-L B Ni-SIa 1911 1943 198 K. 0.005. 178 K. 158 K. 138 K. 158 K Ni-C 2089, 2077 Ni-C 1963. 138 K. 2100 2000 1900 Wavenumber (cm-1). 2100 2000 1900 Wavenumber (cm-1). Figure S2. FT-IR spectra of H2-activated [NiFe] hydrogenase from Desulfovibrio vulgaris Miyazaki F under N2 atmosphere at 138, 158, 178, and 198 K. (A) FT-IR spectra before light irradiation. (B) Difference FT-IR spectra between the spectra with and without light irradiation (light-minus-dark, black) and between those after and before light irradiation (after-minus-before, pink).. S4.
(10) gx 2.197. gy 2.144. gz. 50 K. 2.010. Amplitude. 20 K. 10 K. gx. 4K. 2.218, 2.176. gy 2.182, 2.106. 2.2. gz. 2.0 g-value. 1.86. 1.8. Figure S3. Expanded EPR spectra of H2-activated [NiFe] hydrogenase from Desulfovibrio vulgaris Miyazaki F under H2 atmosphere at 4, 10, 20 and 50 K. The g-values of the [Fe4S4]d/p+ cluster and unsplit Ni-C signals are shown in black and red broken lines, respectively. The g-values of the split Ni-C signals are shown in cyan (gx), blue (gy), and dark blue (gz) broken lines. The unsplit Ni-C signals (red broken lines at gy = 2.144 and gz = 2.010) were not detectable at 4 and 10 K, which strongly indicated that the proximal [Fe4S4]p2+/+ cluster was completely reduced. Measuring conditions: microwave frequency, 9.645 GHz; microwave power, 2 mT; modulation power, 100 KHz.. S5.
(11)
図
![Figure 1. Structure of H 2 -activated [NiFe] hydrogenase from DvMF (PDB: 1WUL).](https://thumb-ap.123doks.com/thumbv2/123deta/8627312.1340047/1.892.465.806.643.815/figure-structure-activated-nife-hydrogenase-dvmf-pdb-wul.webp)
![Figure 4. EPR spectra of reduced [NiFe] hydrogenase from DvMF under H 2 (blue) and N 2 (red) atmospheres at 4, 10, 20, and 50 K](https://thumb-ap.123doks.com/thumbv2/123deta/8627312.1340047/3.892.454.745.282.633/figure-epr-spectra-reduced-nife-hydrogenase-dvmf-atmospheres.webp)
![Figure S1. FT-IR spectra of H 2 -activated [NiFe] hydrogenase from Desulfovibrio vulgaris Miyazaki F under H 2 atmosphere at 138, 158, 178, and 198 K](https://thumb-ap.123doks.com/thumbv2/123deta/8627312.1340047/8.892.97.784.153.631/figure-spectra-activated-hydrogenase-desulfovibrio-vulgaris-miyazaki-atmosphere.webp)
+3
![Figure S2. FT-IR spectra of H 2 -activated [NiFe] hydrogenase from Desulfovibrio vulgaris Miyazaki F under N 2 atmosphere at 138, 158, 178, and 198 K](https://thumb-ap.123doks.com/thumbv2/123deta/8627312.1340047/9.892.96.781.156.642/figure-spectra-activated-hydrogenase-desulfovibrio-vulgaris-miyazaki-atmosphere.webp)
![Figure S3. Expanded EPR spectra of H 2 -activated [NiFe] hydrogenase from Desulfovibrio vulgaris Miyazaki F under H 2 atmosphere at 4, 10, 20 and 50 K](https://thumb-ap.123doks.com/thumbv2/123deta/8627312.1340047/10.892.275.612.158.703/figure-expanded-activated-hydrogenase-desulfovibrio-vulgaris-miyazaki-atmosphere.webp)
関連したドキュメント
In this, the first ever in-depth study of the econometric practice of nonaca- demic economists, I analyse the way economists in business and government currently approach
If condition (2) holds then no line intersects all the segments AB, BC, DE, EA (if such line exists then it also intersects the segment CD by condition (2) which is impossible due
We show that a discrete fixed point theorem of Eilenberg is equivalent to the restriction of the contraction principle to the class of non-Archimedean bounded metric spaces.. We
Keywords: continuous time random walk, Brownian motion, collision time, skew Young tableaux, tandem queue.. AMS 2000 Subject Classification: Primary:
Kilbas; Conditions of the existence of a classical solution of a Cauchy type problem for the diffusion equation with the Riemann-Liouville partial derivative, Differential Equations,
Then it follows immediately from a suitable version of “Hensel’s Lemma” [cf., e.g., the argument of [4], Lemma 2.1] that S may be obtained, as the notation suggests, as the m A
Our method of proof can also be used to recover the rational homotopy of L K(2) S 0 as well as the chromatic splitting conjecture at primes p > 3 [16]; we only need to use the
We have introduced this section in order to suggest how the rather sophis- ticated stability conditions from the linear cases with delay could be used in interaction with
