A Method for Pedestrian Position Estimation using
Inter-Vehicle Communication
Yuta Sawa, Tomoya Kitani, Naoki Shibata
†, Keiichi Yasumoto, and Minoru Ito
Graduate School of Information Science, Nara Institute of Science and Technology Email:{yuta-s, t-kitani, yasumoto, ito}@is.naist.jp
†Faculty of Economics, Shiga University Email: [email protected]
Abstract—In this paper, we propose a method for detecting
the positions of pedestrians by cooperation of multiple cars with directional antennas to support drivers for pedestrian safety. In the method, each pedestrian carries a device which periodically transmits a beacon with a unique ID, and each car passing near the pedestrian receives the beacon by a directional antenna and measures the distance and the angle of arrival. We assume the distribution of the measurement errors to be a normal distribution, and the system calculates the existence probabilities of each pedestrian at each point. By exchanging information of the probabilities between cars, the area with high existence probability is narrowed down. In this paper, we first describe the situations where detecting positions of pedestrians greatly contribute to pedestrian safety, and then we describe the probability model used in our method, the method for calculating existence probabilities from information from multiple cars, and the protocol for exchanging the probability information between cars. We evaluated our method on QualNet simulator, and confirmed that the positions can be detected accurately enough for practical uses.
I. INTRODUCTION
In recent years, the number of cars is rapidly increasing in several countries and accordingly the number of traffic accidents is rapidly increasing. In Japan, while the total number of fatal traffic accidents is decreasing, there is only modest decrease in the number of traffic accidents where a pedestrian, a bicycle, or a motorcycle is involved [2][3]. This situation could prompt the introductions of AHS(Advanced Cruise-Assist Highway Systems) or ASV(Advanced Safety Vehicle) which warn drivers in dangerous situations, automati-cally decelerates the car or avoid an obstacle automatiautomati-cally[1]. But, currently these mechanisms only avoid collisions against large objects, and thus some car manufacturing companies are developing mechanisms to detect pedestrians or bicycles. Some of these mechanisms employ sensors installed on a car to detect pedestrians or bicycles[4], [5], [6]. In other mechanisms, devices carried by pedestrians and cars send their positions to another kind of device installed on crossroads, and this device notifies the cars in dangerous situations [4]. The former method has a problem of the dead angle of sensors, and the latter method requires extra costs for installing the devices on crossroads.
In this paper, we propose a method for precisely detecting pedestrians utilizing communication between cars with direc-tional antennas. In the existing methods, the problem of dead
angle cannot be completely eliminated, since the sensed data is only used by the car which sensed the data. In our method, cars send the sensed information to other cars by inter-vehicle communication to solve the dead angle problem and make the result of detection more precise. Our method does not need an extra cost for installing devices on crossroads.
In our method, we assume that each pedestrian carries a device which periodically transmits a beacon signal with a unique device ID. Each car is assumed to have a directional antenna for receiving beacons, a positioning system like GPS, a precise clock (which usually comes with a GPS receiver), a computer with a capability of inter-vehicle communication and road map data. Each car receives the beacon by the directional antenna and measures the distance and the angle of arrival of the beacon. The detected information of the position of the pedestrian has some error. We calculate the existence probabilities at each point by assuming that the distribution of error follows a normal distribution. Then, the probability information is exchanged between cars, and the area with high existence probability is narrowed down by overlapping the information from multiple cars. The probabilities of moving speed of each pedestrian can be also used to make the results more precise.
For evaluation of our method, we conducted some simula-tions of our method using QualNet simulator. In a crossroad with a lot of obstructions, we counted the number of beacons received by cars until the car reaches the distance needed to stop without crashing into the pedestrian. Then we compared the results with and without inter-vehicle communication. The area of 90% existence probability can be narrowed down from a near-circular area with radius of 18.33m to 3.74m.
II. RELATEDWORKS
Currently, many car companies and researchers are involved in researches for realizing a vehicle safety system using inter-vehicle communication. Misener et al. have proposed and implemented a safety assistance system using inter-vehicle communication. They evaluated their system at a large flat area similar to a runway of airplane and an intersection in the real world[5]. In [4], a system for pedestrians to avoid car accidents is proposed. In this system, pedestrians and cars send information including their positions and moving velocity to a server located on each intersection, and cars receive
attention messages from the server when the server notices that a pedestrian and a car will collide based on the information of position and velocity of the pedestrian and the car. A system for pedestrians to avoid car accidents are also proposed in [6]. In this system, a car sends a information including its position and moving velocity to a device carried by each pedestrian, and this device calculates the positional relation between the pedestrian and the car and sends an attention message to the car when necessary. The former system enables driver to avoid accidents with pedestrians who cannot be viewed from the driver, but this system requires additional costs to install the servers on each intersection. This system also has a problem of large communication delay. The latter system requires pedestrians to carry a device with accurate positioning capability, which is potentially expensive.
In order to detect a pedestrian or an obstacle, these objects have to be recognized and positioned. As for positioning, there are some existing methods utilizing GPS, laser range finders[7] and radio wave[8], [9], [10]. GPS is a popular method of positioning, but its measurement error is as much as 10 meters. The method using a laser range finder cannot detect all objects in a situation with high vehicle density, since there can be dead angle of laser beam. A method using radio waves uses received signal strength or the angle of arrival for estimating positions of objects. This method is not prone to the influence of obstacles, while the measurement error tends to be larger than the method using laser. For any of these method, in order to improve the accuracy of position estimation, putting many anchors, cooperation of many devices, and installing devices on infrastructures are required.
It is known that cars require a certain amount of distance to stop completely[11]. This distance includes the distance while the car runs until the driver pedals the brake. Thus, the notification has to be shown to the driver before the distance between the car and the object becomes closer than the stopping distance, and this is an absolute time restriction for car accident avoidance systems.
III. TARGETSITUATION OFPEDESTRIANDETECTION
In this section, we describe the target situations where pedestrian detection and alert systems are needed. According to the white paper published by National Police Agency of Japan [3], 74.6% of traffic accidents occur in urban areas, and 43.5% of them occur in intersections. 25% of the pedestrian fatalities are caused by unreasonable road crossings. Accord-ing to [11], drivers who have been notified of the existence of pedestrians pedal the brakes about one second earlier.
Therefore, the number of these fatalities can be reduced by giving drivers information about pedestrians who are crossing the road. Following the above discussion, we decided to focus on the following situation as our target.
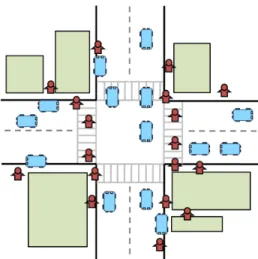
A Blind Intersection due to Buildings and Other Vehicles:
Figure 1 denotes a blind intersection due to buildings, roadside trees, and other vehicles. Drivers passing through this intersec-tion cannot see beyond these structures. This is called a blind spot. If a pedestrian tries to get across such an intersection
Fig. 1. A Blind Intersection due to Buildings and Other Vehicles
when many cars are slowly moving due to a signal or traffic jam, it is difficult for the drivers to notice pedestrians who are in the blind spots. In such a situation, systems which notify positions of pedestrians to the drivers will certainly reduce the number of traffic accidents.
IV. PEDESTRIANPOSITIONESTIMATIONPROBLEM
In this section, we give some assumptions, and then define the pedestrian position estimation problem.
A. Assumptions
1) Pedestrians: We make the pedestrian’s equipment
min-imum. We assume the following for each pedestrian.
• Each pedestrian is equipped with a beacon device.
• Beacon device emits a signal every tb [s]. • A unique ID is assigned to each beacon device.
• Radio for sending beacon signals is based on IEEE 802.11 standard.
2) Cars: We assume the following for each car.
• Each car is equipped with a directional antenna capable of receiving beacon signals and estimating their directions.
• Each car is equipped with IEEE 802.11 based wireless LAN device, and capable of communication with other cars.
• Each car is equipped with a GPS receiver.
• Each car is equipped with a computer with a certain amount of storage and accurate clock.
• Road map is installed on the computer of each car.
3) Inter Vehicle Communication: We assume the following
in communication between cars.
• Radio for beacon signals sent by pedestrians and packets exchanged between cars is based on IEEE 802.11.
• Time intervals for sending beacon signals and packets are
tb [s] and tc [s], respectively.
• Each beacon signal propagates in the area with radius rb
[m] centered at its sender. All cars in the area receive the beacon signal as long as there is no radio interference.
• Each packet sent by a car propagates in the area with radius rc [m]. All cars in the area receive the packet as
long as there is no radio interference.
4) Property of Directional Antenna: We assume the
fol-lowing for directional antenna.
• When receiving a beacon signal, it can estimate the direction and distance to its sender pedestrian.
• Error in the measured direction follows normal distribu-tion.
• Error in the measured distance follows normal distribu-tion.
B. Protocol for Pedestrian Position Estimation
We describe the behavior of each pedestrian and each car below.
(a) Pedestrian’s behavior:
1) Construct a packet pktp(id, sn) with the pedestrian’s
beacon ID id and beacon sequence number sn. 2) Broadcast pktp(id, sn) to cars in the area of radius rb
centered at the pedestrian.
3) Increment the beacon sequence number sn by one. 4) Repeat 1) to 3) at time interval tb.
(b) Car’s behavior:
1) Wait until a packet is received.
2) If the received packet is the pedestrian’s beacon
pktp(id, sn), take the following behavior.
a) Create a map of pedestrian’s existence probabilities (described in Sect. IV) by estimating pedestrian’s position from measured beacon signal and its po-sition.
b) Construct a packet pktc(car pos, angle, d, id, sn)
with its position car pos, measured angle angle, measured distance d, and pedestrian’s ID and se-quence number in the received packet.
c) Broadcast pktc(car pos, angle, d, id, sn) in the
area with radius rc centered at the car.
d) Repeat c) at time interval tcuntil receiving another
packet pktp(id, sn0) with different sequence
num-ber from the same pedestrian.
3) If the received packet is other car’s packet
pktc0(car0 pos, angle0, d0, id0, sn0), take the following
behavior.
a) Confirm beacon ID id0 and sequence number sn0. b) If the beacon packet pktp(id0, sn0) was already
received, compute a map of pedestrian’s existence probabilities for car0 pos, angle0, and d0, and compose it with the existent map (composition algorithm is explained in Sect. IV).
c) Otherwise, create a map of pedestrians existence probabilities.
C. Pedestrian Position Estimation Problem for Safety Naviga-tion
We define the problem of estimating pedestrian’s position using inter-vehicle communication as follows.
Purpose: Provide safety navigation to drivers by showing the position and moving direction of pedes-trians.
Input: Position information of pedestrians measured by a car and brought from other cars through inter-vehicle communication
Output: Indicating positions of pedestrians in dan-gerous situations to drivers.
Constraints: By considering the time duration T [s] that car stops since its driver recognizes danger, the danger indication must be finished T [s] before the car hits the pedestrian.
V. POSITIONESTIMATIONALGORITHM
In this section, we describe the algorithm to solve the problem defined in Sect. IV-C. The basic idea is as follows.
1) When a car receives a beacon packet from a pedestrian, it measures the angle and the distance to the pedestrian based on the signal received by the directional antenna, estimates the pedestrian’s position from the angle and strength of the car’s position, and computes the pedes-trian’s existence probability at each position around the estimated position, called existence probability map. 2) In order to make the existence probability map more
accurately, we make cars exchange the probability maps computed by those cars, and compose the maps into a new map.
Below, we explain how we realize this idea.
A. Input, Output, Constraint, and Objective of Problem
Below we will describe the details of input, output, con-straint, and objective of the target problem.
Input: For each car ci(i ∈ {1, 2,· · · , n}), ci’s position (xi, yi), and the measured angle θi and distance di to the
pedestrian.
Output: Existence probability map of pedestrian w. Constraint: The distance that a running car stops since its driver notices pedestrian in dangerous situation consists of
thinking distance and braking distance, where the former is
the distance that the car runs until the braking gets effective since the driver decides braking, and the latter is the distance that the car runs until it completely stops since the braking gets effective. In order to avoid traffic accidents of pedestrians, notification of estimated pedestrian position must be notified to a driver before the car goes into the area centered at the pedestrian with a radius of this distance.
The thinking distance and the braking distance are calcu-lated by the following expressions (1) and (2).
dthinking = trecognize· v (1) dbraking =
(v/3.6)2
254· µ (2)
Here, v is the car speed, µ is the kinetic friction coefficient of the road, and trecognize is the driver’s response time, where trecognize will typically be 2 seconds [11]. Thus, the distance
between a car and a pedestrian in danger is less than dlimit
defined below.
dlimit= dbraking+ dthinking (3)
Objective: Let w.pos(t) and c.pos(t) denote the positions of pedestrian w and car c at time t, respectively. We assume that the time when a car c in its radio range receives is the same as the time when the beacon packet is sent. For each car c and a pedestrian w, the purpose of our method is to complete indicating w’s position to c’s driver while the distance between
c and w is larger than dlimit.
To solve the above problem, we present two algorithms: (i) algorithm for computing pedestrian existence probability map, and (ii) algorithm for composing a new map from multiple maps.
B. Computing Pedestrian’s Existence Probability Map
First, we will explain the model for the angle to the pedestrian measured by directional antenna. Let θmeasured
be the measured angle to the target pedestrian, where the base direction is the car’s running direction, as shown in Fig. 2. Since there is a measurement error, the actual angle is somewhere around the measured angle θmeasured. From
assumption in Sect.IV-A, the probability fΘ(θ) that the actual
angle becomes θ follows the normal distribution centered at
θmeasured, and denoted by the following equation.
fΘ(θ) = 1 √ 2πσθ e−12 (θ−θmeasured σθ )2 (4)
Here, the variance σθ(e.g., 6 degrees) is decided depending
on the property of the directional antennas equipped with cars. Next, we will explain the model for measuring the distance to the pedestrian. Let dmeasureddenote the measured distance
to the target pedestrian, which is computed by RSSI (Received Signal Strength Indicator) of the received beacon packet at the directional antenna (see Fig. 2). Due to measurement error, the actual distance is somewhere around the measured distance dmeasured. From assumption in Sect.IV-A, the
prob-ability fD(d) that the actual distance becomes d follows the
normal distribution centered at dmeasured, and denoted by the
following equation. fD(d) = 1 √ 2πσd e−12 (d−dmesured σd )2 (5)
We assume that the variance σdis given by σd= α×rrp.Here, α denote a constant number.
By using equations (4) and (5), we can calculate the probabilistic index that a pedestrian is at arbitrary position
(x, y) in a map by the following equation.
pci(x, y) = fΘ(θ)· fD(d) (6) Here, denoting (xi, yi) to be the position of car ci, and θ and d are calculated by the following equations.
θ = tan−1(|y − yi| |x − xi| ) , −π 2 ≤ θ ≤ π 2 (7)
Fig. 2. Measuring Angle and Dis-tance of Beacon by Directional
An-tenna Fig. 3. Pedestrian’s Existence
Prob-ability Map
Fig. 4. Example of composing multiple probability index
d =√(x− xi)2+ (y− yi)2 (8)
Below, we consider the allowable error in pedestrian posi-tion estimaposi-tion. In general, pedestrian’s moving speed is said to be 4Km/hour (i.e., 1m/sec). In the proposed method, in order to reduce computation time, we divide the target space in a road map into grids with 1 meter sides as shown in Fig. 3, give each grid probabilistic index calculated for the central point (x, y) of the grid by equation (6).
We use Bayes’ theorem to calculate fΘ(θ) and fD(d). C. Composing New Probability Map from Multiple Maps
Now, we will explain how to improve the estimation accu-racy of position by composing probability maps obtained by multiple cars.
In order to compose multiple probability index, the mea-surement data have to satisfy the following conditions.
• All cars receive the same beacon with same ID transmit-ted at the same time.
The probability index{pc1, pc2,· · · pcm}derived from the re-ceived beacon which satisfies the above condition, we calculate the new probability index by Bayes theorem.
VI. SIMULATIONEXPERIMENT ANDEVALUATION
In this section, we describe the results of computer sim-ulation for evaluating how accurately the proposed system with inter-vehicle communication can estimate the pedestrian’s locations before the limit of time for stopping a car. In this
evaluation, we have used QualNet Simulator [12] to simulate wireless communication.
A. Experimental Parameters
The target area is a large intersection located at Shijo-Kawaramachi, which is in the central Kyoto, shown in Fig. 8, 9, and 10. The size of this area is 142[m] × 142[m]. This intersection has a set of traffic signals, the signals for east-west direction is set to green, and the signals for north-south direction is red. We varied the number of cars which go through the intersection in the east-west direction among 2, 4, 6 and 8, and the number in the north-south direction among 2, 4, 6, 8 and 10. The moving speed of all cars on the road with green signal are 50[km/h], and all cars keep 10m as the distance from the preceding car. The drivers’ response time trecognize from recognizing danger to pedal the
brakes is assumed to be 2 seconds. We placed 12 pedestrians in this area. The road condition in the area is dry and its coefficient µ of friction is 0.7. In this case, dlimitbecomes 22
meters. Pedestrians’ devices for transmitting beacon and the inter-vehicle communication use IEEE 802.11b as the physical layer protocol. The radio propagation range is 100 meters. The interval of broadcasting pedestrians’ beacon tb is 0.2 seconds
and the interval of broadcasting data from each car tc is also
0.2 seconds. The size of a pedestrian’s beacon is 100 bytes, which contains a Beacon ID and a Packet Sequence Number. A location of each car is represented as coordinates (x, y) and the length of each coordinate value is 64 bits. The size of data measured by a car is 150 bytes. In order to reproduce multipath fading, Rayleigh Fading model is used as the radio propagation model. Irregular Terrain Model is used as the path loss model and the normal distribution is used to reproduce shadowing in this simulation.
B. Evaluation Items
The items for evaluation are shown below.
1) Packet Loss Rate: In order to evaluate how many packets can be received until the car reaches within the distance of dlimit from a pedestrian, we measured the number of
beacons successfully received by a car when this car is going through the intersection from the right side.
a) The ratio of successfully received beacons b) The number of successfully received beacons 2) Estimation Accuracy of Pedestrian’s Location: In order
to evaluate how the accuracy of estimation changes as the number of cars exchanging information changes, we measured the radius of the smallest circle which contains all cells of the grid in which the existence probability of pedestrian exceeds 90%. We varied the number of cars exchanging information with the front car from 0 to 8. The variance σθ of the normal distribution for the error
of angle of arrival is set to 6[deg], and the variance σd
for the error of distance is varied among 10[m], 20[m] and 30[m].
C. Experimental Result
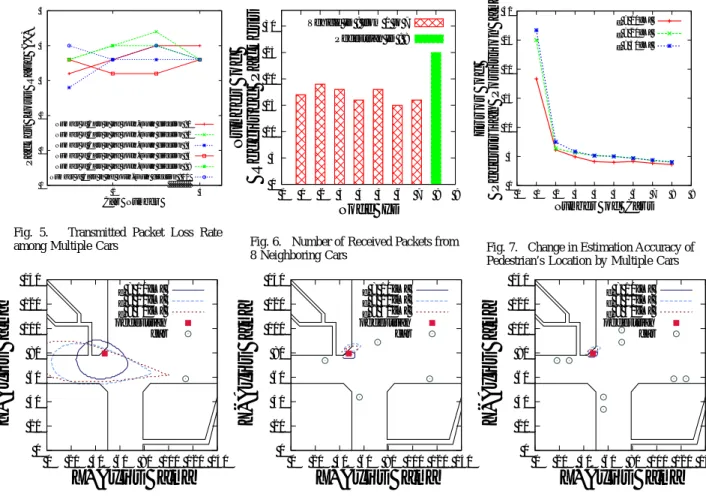
The results of the simulation for the evaluation 1-a is shown in Fig. 5. This figure shows the ratio of the packet which cannot be received until the car reaches within the distance of
dlimit. This results show that the ratio of packet loss does not
increase as the number of cars in the area increases. The packet loss rate stays around 4% even when there are 18 cars in the area. Figure 6 is the result of the simulation for the evaluation 1-b, which is the number of packets received until the car reaches within the distance of dlimit. For all conditions, the
car is able to receive more than 14 packets until the deadline, which is sufficient for estimating the position of the pedestrian. Figure 7 shows the radius of the smallest circle which con-tains all cells of the grid in which the existence probability of pedestrian exceeds 90%, while the number of cars exchanging information is changed from 0 to 8. From this figure, we can see that when σd=10[m], the radius is 18.33[m] when there
is only one car, but the radius becomes 3.74[m] if there are 8 cars. Thus, the accuracy of estimation improves as the number of cars increases. We can see the same result when σd=20[deg]
and 30[deg]. Fig. 8, 9 and 10 show the results of position estimation when there are 2 cars in vertical direction and 2 cars in horizontal direction. In these simulations, the coordinates of the pedestrian is (48, 76)[m]. These results show that on any conditions, the accuracy of estimation is improved as the number of cars exchanging information increases.
VII. CONCLUSION
In this paper, we presented a method for pedestrian position estimation using inter-vehicle communication. In the proposed method, we used a pedestrian existence probability model in order to consider a measurement error, and cars exchange pedestrian existence probabilities using inter-vehicle commu-nication in order to detect pedestrians with high accuracy. We have implemented the proposed system on the network simulator QualNet and confirmed that cars detect a pedestrian until a distance between a driving car and a pedestrian gets smaller than car’s stopping distance.
As the future work, we will consider the way for evaluating each pedestrian’s accident risk for each driver and filtering out low accident risk pedestrians so that each driver can focus on higher accident risk pedestrians. We will also consider the way that cars detect a series of pedestrian’s position for a time interval in order to estimate the pedestrian’s moving direction. In this paper, we have implemented the proposed system at a blind intersection. We will implement the proposed system at a road that a car often collide with a pedestrian who run out into the street.
REFERENCES
[1] Road Bureau, Ministry of Land, Infrastructure and Transport, Japanese Government: ITS HOMEPAGE,http://www.its.go.jp/ITS/
[2] National Police Agency: “Police White Book,”
http://www.npa.go.jp/hakusyo/index.htm (In Japanese). [3] National Police Agency: “The situation of a traffic accident in 2007,”
0 1 2 3 4 5 2 4
Packet Loss Rate (%)
Car Number
Number of Cars in the north-south direction : 0 Number of Cars in the north-south direction : 2 Number of Cars in the north-south direction : 4 Number of Cars in the north-south direction : 6 Number of Cars in the north-south direction : 8 Number of Cars in the north-south direction : 10
Fig. 5. Transmitted Packet Loss Rate among Multiple Cars
0 5 10 15 20 25 30 0 1 2 3 4 5 6 7 8 9
Number of
Received Packets
Node ID Vehicle ID : from 1 to 7 Pedestrian ID : 8Fig. 6. Number of Received Packets from 8 Neighboring Cars 0 5 10 15 20 25 30 0 1 2 3 4 5 6 7 8 9 Error of Pedestrian Position [m] Number of Cars σd = 10[m] σd = 20[m] σd = 30[m]
Fig. 7. Change in Estimation Accuracy of Pedestrian’s Location by Multiple Cars
0 20 40 60 80 100 120 140 0 20 40 60 80 100 120 140
Y-Axis [m]
X-Axis [m]
σd = 10[m] σd = 20[m] σd = 30[m] pedestrian carFig. 8. Probability index of Pedestrian’s Location measured by 1 Car
0 20 40 60 80 100 120 140 0 20 40 60 80 100 120 140
Y-Axis [m]
X-Axis [m]
σd = 10[m] σd = 20[m] σd = 30[m] pedestrian carFig. 9. Integrated Probability index of Pedestrian’s Location measured by 4 Cars
0 20 40 60 80 100 120 140 0 20 40 60 80 100 120 140
Y-Axis [m]
X-Axis [m]
σd = 10[m] σd = 20[m] σd = 30[m] pedestrian carFig. 10. Integrated Probability index of Pedestrian’s Location measured by 8 Cars
[4] Nissan Motor Co., Ltd.:“NISSAN ADVANCES TESTING OF INTEL-LIGENT TRANSPORTATION SYSTEM,”
http://www.nissan-global.com/EN/NEWS/2007/ STORY/070313-01-e.html.
[5] J.A. Misener, and R. Sengupta: “Cooperative Collision Warning: Enabling Crash Avoidance with Wireless Technology,” Proc. 12th World Congress on ITS,Nov. 2005.
[6] D. Ikeda,M. Horie, R. Yamaguchi, T. Wada and H. Okada: “An effective
algorithm of the relative movement between vehicles and pedestrians in VPEC,” Proc. of the 2nd ACM International Workshop on Wireless network testbeds evaluation and characterization,pp. 95–96, 2007.
[7] C. Premebida and U. Nunes: “A Multi-Target Tracking and GMM-Classifier for Intelligent Vehicles,” Proc. of the IEEE Intelligent Trans-portation Systems Conference 2006 (ITSC 2006),pp. 313–315, 2006.
[8] Malhotra, N.,Krasniewski, M., Yang, C., Bagchi, S. and
Chappell, W.: “Location Estimation in Ad-Hoc Networks with
Direc-tional Antennas,” Proc. of the 25th IEEE International Conference on Distributed Computing Systems,pp. 633–642, 2005.
[9] S. Capkun, M. Hamdi, and J-P. Hubaux: “GPS-free positioning in mobile Ad-Hoc networks,” Proc. of the 34th Hawaii International Conference on System Sciences 2001 Vol.9, pp. 9008, 2001.
[10] N. Patwari,R.J. O’Dea,and Y. Wang: “Relative Location in Wireless
Networks,” Vehicular Technology Conference, 2001. VTC 2001 Spring. IEEE VTS 53rd,Vol.2, pp.1149–1153 ,2001.
[11] M. Hayashi, A. Nishioka, K. Goshi and K. Matsunaga: “Human-Centerd Intelligent Transport System ASSIST,” Proc. of the 2nd In-ternational Conference on Innovative Computing, Infomatio and Control (ICICIC2007),pp.7 ,2007.
[12] Scalable Network Technology :