Speech Kurtosis Estimation From Observed Noisy Signal Based on Generalized gaussian Distribution Prior and Additivity of Cumulants
4
0
0
全文
(2) between the mom巴nt and cumulant in each order, which are use ful for estimating the kurtosis of a speech power spectrum. The mth-order moment μm(Y) can be written as. μm(Y) = L II κIBI(Y)' π(m)BEπ(m). kurtosis of the speech power spectrum using sixth- and eighth-order statistics obtained from waveform signals in the time-frequency do main. More specifically, we calculate the kurtosis of the spe巴ch power spectrum by looking up values in a kllrtosis table, which rep resents the direct relation among the kurtosis of speech, noise, and observed (noisy speech) signals in the power spectrum domain To construct由e kurtosis table, we have to determine the math ematical r,巴lationship among the kurtosis of signals. However, there exist infinite pattems of signals that have an equivalent kurtosis value. Therefore, it is quite difficult to uniqu巴Iy determine each signal. To avoid this problem, we apply a statistical assumption to the waveform signals of speech and noise. In the following sectíon, we describ巴 the statistical assumption in detail. (2). whereπ(m) runs through th巴 list of all partitions of a set of size m, means that B is one of the blocks into which the set is partitioned, and IBI is the size of set B. In the same manner, the mth-order cumulant民m (y) is given by. Bεπ(m). 同m(Y) =乞(-1) 1 巾 )1 ー 1 ( 1π(m) 1 一 叩 H μIBI (y). π(m) BE7<(m) 2.3.. Estimation of speech kurtosis from observations. (3). 3.2.. [5]. In the proposed method, we introduce the generalized Gaussian dis tribution for modeling the waveform signals of spe巴ch and noise The probability density function (p.d.f.) of the gen巴ralized Gaussian dis汀ibution is de自ned as. Hereafter, to deal with time-frequency-domain signals, we de白ne complex-valued variables of the observed (noisy speech) signal, the original speech signal, and the noise signal as (XR+iXI), (SR 十 日 1 ) , and (nR+in!), respectively, where XR = SR +nR and Xr = SI+nl hold. Only t出he s坑ta創叩ti臼stics of (XR + iXI) and (nR + inr) 訂e obs鍔即E訂r刊v aぬble, but t由ha剖t of (いSR + i“問s釘!) is a hidde【n value to be eωslima瓜t巴d. First, we measure the following mth-order moments from the data:. μm(XR) =μm(xr) = E[xR'L μm(nR) =μm(η r) = E[nR'L. p(y). (5). J- ∞. ( 6). 3.3.. Speech kurtosis estimation based on genera1ized Gaussian distribution prior. l (. 一 一. ) -. h. R. 丸一 ん 一 ‘IJ,/てiJ /一 J 一 山り A 一 1白 土U H+ 一 ν 町 円何一 卯一. 一 一. 向. R. μ. αs. u. where. r一 r一 d h. First, the mth-order moments of the waveform (time-frequency gird) signals of speech and noise are calculated as. (12). and αn are the scale paramet巴rs in the distributions for. speech and noíse signals, and ß. and ßn are lhe shape parameters in these distributions, respectively Next, the moment of the square of. (7). = 2 (μ4(XR)一μ4(πR)+ μ�(XR) - 8μ2(XR)μ2(nR)+ 7μ�(nR)) (8) ,. 3.1.. (10). β). The kurtosis table is constructed using (10) and the moment cumulant transformation in the next subsection.. λf(μm(XR),μm(nR)) = μS(XR)一μs(nR) +[4μ2(XR) - 32μ2(nR)]μ6(XR) + [-32μ2(XR) + 60μ2(nR)]μ6(nR) + [-7 6μ4(nR) - 96μ2(XR)μ2(nR) + 516μ�(町)]μ4(XR) + [-60μ�(XR) + 1056μ2(XR)μ2(nR)ー1416μ�(ηR)]μ4(nR) +3μi(XR)十73μ�(nR) +468μ�(XR)μ�(nR) - 3456μ2(XR)μ�(nR)+ 2988μ�(nR),. 3.. (9). 2αr( 1 /β). m m r ((m+ l)/ß) μm(Y) = If∞ ν p(y)dy = α r(l/. where. 。(μm(XR),μm(nR)). = 一一 ι...,..-::-:- e - ( I山 ) β. whereαis a scale parameter,βis a shap巴 parameter, and r(-) de notes the gamma function. Next, the mth-order moment of th巴 gen eralized Gaussian distribution is given by. (4). where we assume that XR and X r are i.i.d., and this also holds for the noise and observed signals In [5], the kurtosis of the speech power spec町um is estimated from the following equation using (4), (5), and the additivity of cu mulants. (μm(町),μm(nR)) kurtspe帥= 出丞と包= λf μ�(S� + s?) v V (μm(XR),μm(nR)) ,. Parametric model. SR is given by. 2m r((2m + 1)/ßs) μm(S�) =μ2m(SR) = αs. (13). r(l/ßs). 2. Then we can calculate the cumulant of the po明er spectrum as. S� + s?. κm(S�+ sO =2κm(S�). PROPOSED METHOD. =2L(ー1 )1π(mド(1π(m)ト1)!日μIBI(S�),. Problem of conventional method and motivation. The conventíonal method can estimate the kurtosis of a spe巴ch power spectrum wilhout a clean speech signal to some extent. However, the accuracy of spe氏h .kurtosis estimatíon using the conventional method is often very unstable because of the instability ín estimat ing very high order (sixth- and eighth-order) statístics oblained from 自nite samples. To avoid this, we propose to estimate speech kurto sis directly in the power spectrum domain instead of estimating lhe. π(m). BEπ(m). (14) and the mth-order moment of lhe power spectrum is given by. 4050. -166 -. μm(品+ S�) =乞日目IBI(S�+ si) 宵(m)BEπ(m). ( 15).
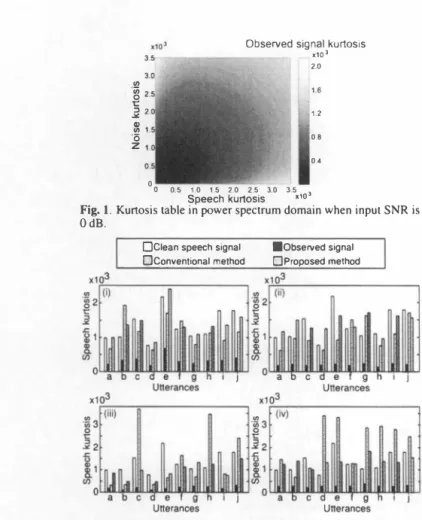
(3) wh巴re. わ-ed 一 d + 一 lT. Finally, using ( 1 1 ) and ( 13)ベ15), th巴 kurtosis of the speech. power spectrum is derived as a function of the shape parameter ßs ,. ζu. 一 一. A p一 民 U川一. u. 一 一. 2R 一 z R 2 h 、 一s tM. LK. where. か唯 仕)ゆ3+4r 訪(∞ま)ωぼ. =r. =. r. 附. 2rG:)r (土)3+4r伝)r(去rr(か2r(去r Next, in the same manner, the kurtosis of the noise power spec. trum is de自ned as. {r(f.)r(土)ぱωr(;.)+3rGJ 2}r(土rr(去r +0<吋2r(え)r GJ+96r(去)r(訪}r伝)r(土rr仕 r 3 ωw 7 6 +吋白〈心刈ベ:払叫吋白4ベ0<�{ 揃州州rべ(か(えYr(訪 + (f.rr(ず} r(土yr 位y =O<�. d咋2r(去)r仕)+96r(去)r(去)}r(ま)r(iYr(去r 吋(;Jr(土)+4r(え)吸いr(�r}r(irr(去y, (25). +. Ðx(ßs,O<s, ßn, O<n). =2 卜十 伝)r(i)唯r } r(去y +0<;咋(か伝)r(i)r仕)} =r(か(去)'+4r(え)r(か(去)"+3r(ま)r(土r, + 作(去)r(か(まr} r(土r] kurtno回. 一 一一ー μ4(n� n;) _ Nn(βn) 一一一一一一一 す一一→ Ðn(ßn) μ2(n� 十nr)2. ( 19). where. From the above-mentioned resu1ts, we can con自rm that (a) the. speech kurtosis, kurtspeech, given by ( 16), is a function of ßs only, and noise the kurtosis, kurtno目e, given by ( 19), is a function of ßn. =2r(去)r (:去)3+4r(;Jr(去rr仕)+2r(まr. o凶y. Thus, they are independent variables. (b) The kurtosis of the. Next, we ca1cu1ate the kurtosis of the observed (speech-nois巴. +bめ) = κm( ) + κm(伶例bめ).. mixture) signal. General1y, the cumu1ant has additivity for additive independent va1uables, i 巴 ,. t出hi目s. κm(α. α. Us剖m. r陀elation and (3め), we can estimate the cumu1ant of the observed. observed signal, kurtobse<ved, is a complex function of ßs , βn , 白h and O<n. Thus, given o<s and白n, we can plot the value of kurtobse<ved on the two-dimensiona1 independent axes of kurtspeech (of ßs) and. kurtno闘(of ßn), y ie1ding th巴 d巴sired kurtosis tab1e. The scale pa. rameter is defined using the variance and shape parameter of each signal as. signa1 as. (27). κm(Xll) =κm(SR) +κm(nR) =乞(ー1)1川1-1(1π(m)1一叩日μIBI(SR) π(m) BEπ(m) +乞(ー1)1,,(m)l-l(1π(m)l-l)! IIμIBI(nR) BE宵(m) π(m) (22) The moment of the square of. XR is given by. where. (j2. time period, and that of speech,σ; , can be estimated in a l1oise-�>n1y c asσi - σ � . Thus, we can cons凶ct the kurtosis table at each input. SNR by varying the shape and sca1e parameters. Then, the ku口OSIS of the speech power spectrum can be estimated from the kurtosis of the power spectra of the noise and observed signals by looking Up values in the table. An example of such a kurtosis table is shown in. μm(X�) =μ川町) = 乞 II 1>IBI(XR)' π(2m) BEπ(2m). Fig. 1 . In this 品gure, the variance ratio of speech to noise signals is. (23). 自xed to unity. Thus, this table should be used when th巴 input SNR between the speech and noise signals is 0 dB.. Then, we can estimate the kurtosis of the observed signal in the power spectrum domain in a similar way to. is the variance of the signa1. We determine the sca1e pa. rameter from the input SNR, which expresses the v<l!'iance ratio of the spe配h to noise signals. The variance of noise, ば , is measured. (14)ベ16).. 4.. EXPERIMENTS. The kurtosis. of the observed signal in the power spectrum domain is calculated as. 入ん(ßs,O<s,ßn,白n) ku 凡h "'''' ..vørJ…= 旦並七豆L = 山 山 μ2(X� +x;)2 Ðx(ßs,αs, ßn, On)'. 4.1.. Experimental setup. To con品rm the e仔巴ctiveness of the proposed method, we conducted. (24). an experiment on kurtosis estimation of the speech power spec 甘um. In this experiment, the conventional method and the proposed. 4051. -167-.
(4) Observed signal kurtosis 帥 帥 O亡コu品 。凶 oz. )(103 2.0. Table 1. Average normalized eπor of estimates of speech kurtosis in power spectrum domain using conventional and proposed methods for (i) white Gaussian noise, (ii) railway station noise, (iii) museum 目。ise, and (iv) babble noise. 1.6 1.2. Data length. 0.8. W hole sentence. 0.4 0. o. Method. Half of sentence. 0.5 1.0 1.5 2.0 2.5 3.0 3.5 . .10 Speech kurtosis. One second. Fig. 1. Kurtosis table in power spectrum domain when input SNR is OdB.. 口Clean spe田h signal 白Conventional method. I. the input SNR is -10 dB. In Fig. 2, although the kurtosis of the c1ean speech signal has quite a high value, the kurtosis of the observed. ・Observed signal ロProposed method. (noisy speech) signal is lower than that of the c1ean speech signal. Estimates c10se to original values can be obtained by using the con ventional and proposed methods. However, sometimes the estimates of speech kurtosis have a large eπor in the conventional method; in contrast,the proposed method's results are very stable and accurate. Table 1 shows the average normalized e町or of estimates of speech kurtosis in the power spectrum domain using the conven・ tional and proposed methods. In Table 1, estimates using the con ventional method for the museum noise and babble noise have quite a large eπor,especially in the case of 1 s data length. However,these eπors are reduced by using the proposed method. Also, in estimates for the white Gaussian noise and railway station noise, eπors are. lower for the proposed method. From these results, we can confirm that accuracy of speech kurtosis estimation is markedly improved using the proposed method.. 5. Fig. 2. Examples of speech kurtosis estimates for (i) white Gaussian noise,(ii) railway station noise, (iii) museum noise, and (iv) babble noise. Whole sentences are used in estimation method based on the generalized Gaussian distribution prior were compared. We used 2∞utterances (1∞males and 100 females from the Japanese newspaper dictation database) as the target speech signals and four types of noise signals, namely white Gaussian noise, rail way station noise, museum noise, and babble noise. Furthermore, we used three di仔erent types of data length: (a) the full length of each utterance of 2-15 s (whole sentence), (b) the 自rst half of each utterance (half of sentence), and (c) the first second of each utter ance (one second). The test data were obtained by combining the target speech signals and noise signals. AII signals used in this ex periment were 16・kHz-sampled signals. The input SNR of the test data was set to 0,・5, or -10 dB. The speech kurtosis in the power spectrum domain of the test data was estimated using the conven tional and proposed methods. In the proposed method, we con・ structed the kurtosis table for each SNR. In these kurtosis tables,. kurt,pPPCh. and kurtnoi'p were changed from 0 to 35∞by three. We calculated the normalized eπor of the estimates in the conven tional and proposed methods and compared the accuracy of speech kurtosis estimation.. The normalized eπor is de自ned as en肘nl. Ikurt。附Ip - kurt,pPPd.l/kurtoradp,. =. where kurtorarlp is the伊wer spectral kurtosis of the c1ean speech signal and kurt.叩pp,'h is the es. timate of the speech power spectral kurtosis. 4.2.. In this paper, we proposed a new method for the stable estimation of speech kurtosis in the power spectrum domain based on the general ized Gaussian distribution prior in order to avoid the calculation of higher-order statistics. Using this prior and the additivity of cumu lants, we can construct a kurtosis table that directly represents the relationship among the kurtosis of speech, noise , and their mixture. in the power spectrum domain, and speech kurtosis can be estimated stably from the observable data. An experimental evaluation con・ 自rmed the efficacy of the proposed method. 6. [1] [2). (3 ) [4). [5勾). REFERENCES. P. C.. Loizou, Speech Enhancemellt Theol)・and Praζtlιe,CRC Press, Taylor & Francis Group FL, 2∞7 '‘ H. Saruwatari et al., Blind source separation combining in dependent component analysis and beamforming," EURASIP JOllmal on Applied Signal Processing., vol.2003,口0.11, pp.1134-1 146, 2∞3 L. Rabiner et al., FUlldamentals 01 speech吋cognition. Upper Saddle River. NJ: Prentice Hall PTR, 1993 Y. Uemura et al., "Automatic optimization scheme of spectral subtraction based on musical noise assessment via higher-order statistics," Proc. IWAENC2ω8,2∞8. R. Miザyazaki et al.,. s叩pa仙tJa剖1 subtraction紅ray. and. i山t“s a叩ppμ凶li比ca剖tiぬon tωo speech rec∞ogmト-. tlOn 口p戸erf,巾orma叩ncαep戸re吋di叩ctJ加1ωo叩n," Pro附ι. HSCMA, pp.19-24, 2011 [ 6). [7 ). Experimental results. CONCLUSION. Figure 2 shows examples of speech kurtosis estimation results for 10 utterances using the conventional and proposed methods when. 4052. - 16 8 -. R. Wakisaka et al., "Blind speech prior estimation for gener. alized minimum mean-square eπor short-time spectral ampli・. tude estimator," ProιINTERSPEECH, pp.361-364, 2011. R.. Prasad et al.,“Probability distribution of time-series of. speech spectral components," IEICE Tr a lls. FlIlldamentals, vol.E 8 7・A, no.3, pp.584-59 7, 2004..
(5)
図
関連したドキュメント
We have seen that under rather natural source condi- tions error estimates in Bregman distances can be extended from the well-known quadratic fitting (Gaussian noise) case to
At the same time, a new multiplicative noise removal algorithm based on fourth-order PDE model is proposed for the restoration of noisy image.. To apply the proposed model for
Theorem 2.11. Let A and B be two random matrix ensembles which are asymptotically free. In contrast to the first order case, we have now to run over two disjoint cycles in the
Key words and phrases: White noise space; series expansion; Malliavin derivative; Skorokhod integral; Ornstein-Uhlenbeck operator; Wick prod- uct; Gaussian process; density;
The Main Theorem is proved with the help of Siu’s lemma in Section 7, in a more general form using plurisubharmonic functions (which also appear in Siu’s work).. In Section 8, we
The main objective of this paper is to extend these properties to a family of scaling functions that approximate the Gaussian function and to construct a family of Appell sequences
In order to predict the interior noise of the automobile in the low and middle frequency band in the design and development stage, the hybrid FE-SEA model of an automobile was
Here we shall supply proofs for the estimates of some relevant arithmetic functions that are well-known in the number field case but not necessarily so in our function field case..
