Comparative Chemical Studies on the Proteins
in the Quail and Chicken Egg Whites (I)
Electrophoresis, CM-cellulose chromatography
and gradient extraction with salt on the whole
white
著者
KOGA Katsuya
journal or
publication title
Memoirs of the Faculty of Agriculture,
Kagoshima University
volume
7
number
1
page range
15-33
Comparative
Chemical Studies on the Proteins
in the Quail and Chicken Egg Whites
(I) Electrophoresis, CM-cellulose chromatography and
gradient extraction with salt on the whole white
Katsuya KOGA
(Laboratory of Animal Biochemistry)
Introduction
The studies on the relative proportions, properties and chemical structures of the pro-teins in the avian egg whites are significant from the standpoint of the comparative bio-chemistry, phylogenesis, or even of the genetic aspect. Generally, earlier investigations on the proteins of various birds egg whites were carried out with the moving boundary electrophoresis. Bain and Deutsch" described that the galliforme birds have the egg white proteins relatively closely related electrophoretically, and that albumin components of the
anseriforme species have higher mobilities than the corresponding proteins of the gallifor-mes, differing from each of the species. The experimental results obtained by Forsythe and Foster2 on six genetic lines of chickens indicated small but statistically significant diffe-rences in egg white composition.
Feeney et al.3) examined the egg whites of 25 different avian species or varieties belon-ging to six orders with the cellulose ion exchanger and found large differences in the amount of several constituents among the different whites. On the basis of the antipro-teolytic actions, Rhodes et al. 4) distinguished the chicken ovomucoid from California valley quail. All those investigations did not include the Japanese quail, though some included California valley quail, and the other quails. The conalbumins from all the galliforme species examined by Clark et al.5' were seen to be more acidic than the chicken con-albumin, and furthermore it was ascertained that only the conalbumin content of the Jap-anese quail had the considerable variation among 25 avian species belonging to five orders. In taxonomy the Japanese quail belongs to the same family, Phasianidae, together with the chicken. It may be due to this relationship that the detailed studies on the egg white proteins of Japanese quail have not been published. Recently, Wiseman and Fothergill 6) 7) demonstrated the difference in the structure between immunologically distinguishable genetic variants of hen ovalbumin.
In the present report, general chemical properties, electrophoresis, CM-cellulose chroma-tography and gradient extraction with ammonium sulfate on the Japanese quail and chi-cken egg whites were examined. It was suggested that relative contents and chemical structures of the constituent proteins in the quail egg white differ from those of the chi-cken egg white. Especially, the distinct differences were ascertained in the property of each ovalbumin and glycoprotein between the egg whites of these two species.
15
Materials and methods
Materials— The eggs of the chicken, white leghorn (Gallus gallus) were secured from the flocks of the Farm of the Faculty of Agriculture , Kagoshima University, and the eggs of the Japanese quail (Coturnix coturnix japonica), from the birds fed by the Laboratory of Animal Breeding within a few hours after being laid . The eggs for material should be very fresh and obtained from a scientific organization, because the deterioration of the egg proteins mediated by a glucose rapidly occurred after eggs were laid. 8) 9)
After the procurement of eggs, those were weighed individually and then breaked . The egg white was separated as completely as possible from the yolk with the aid of injector and the weights of the white, yolk and shell were measured respectively . After the chal-azae was removed with a pair of tweezers , the whole white was blended with a homo-genizer, because no significant differences have been found among the three layers in the egg white. 10) 11) The homogenized egg white was used as the sample for various analyses .
Examination of general chemical properties — The specific gravity of the egg white was measured with the Ostwald picnometer. The determination of nitrogen was followed the semimicro kjeldahl method. The electric resistance was measured by using the Kohlrausch bridge at 15°C and the specific conductance was calculated from the resistance value . Total sugar was determined according to the phenol-sulfuric acid method proposed by Du-bois et al.12' Its colour intensities were measured at 490 mp with Shimazu-Bausch Lomb
Spectronic 20 spectrophotometer.
Moving boundary electrophoresis— Electrophoretic analysis was performed with the Tiselius apparatus (Hitach Ltd. HTD-1 type) at 15°C in general , except for one analysis at 8°C. After the egg white homogenate was dialyzed against the different buffers , the sample concentration was adjusted to about 1.5 %. A constant current of 4 mA or 5 mA was conducted. Buffers adopted were as follows : 0.05 M sodium carbonate pH 10.10, p 0.11, 0.05M sodium phosphate pH 7.80 , p. 0.144 (8°C), pH 7.00, p 0.11, 0.11 M sodium acetate pH 4.40, p 0.10, and pH 4.0, p 0.11. All analytical measurements were made on the ascen-ding side, for the reason that better separations than on the descending side could be done.
Chromatographic separation on CM-cellulose column — The separation of the whole egg white on CM-cellulose column was done according to the method of Rhodes et al . 13) Serva CM-cellulose (0.95 meq. per 100 g) imported by Seikagaku Ind . Ltd. Co. was empl-oyed. The double times dilution of homogenized egg white was dialyzed against 0 .025M sodium acetate buffer, pH 4.0 for 2-3 days at 5°C, and after removing precipitates via centrifuge, the protein concentration was adjusted to approximately 1 % . The protein was adsorped while pouring slowly 20-30 ml. of the solution mentioned above on the CM-cellulose column (1.8 x 20 cm.) which was bufferized beforehand with 0 .025 M acetate buffer pH 4.0. After that, 30 ml. of the same buffer was slowly dropped on it. The bu-ffers used for gradient elution due to the continuous pH raise were of the following series :
Firstly, 0.025M acetate buffer pH 4.0, 500 ml. (A)— 0.025M CHSCOONa 500 ml. (B), secondly, 0.025M phosphate buffer pH 5.30, 500 ml. (A)-0 .025M Na2HPO4500 ml. (B), thirdly, 0.05M carbonate buffer pH 9.00, 200 ml. (A)-0 .05M Na2CO3 200 ml. (B), four-thly, 0.05M Na2CO3 100 ml., finally, 0.05M NaOH 100 ml .
Comparative Chemical Studies on the Proteins in the Quail and Chicken Egg Whites 17
The pH rising apparatus employed was shown in Fig. 1. The eluate was collected with the Toyoo Kagaku Siphon fraction collector in which the frac-tion size was adjusted to 5 ml. The flow rate was fixed at 1.0-1.2 ml. per minute. The eluate pH was measured at each fractionated tube, and subsequently the optical density at 280 m,a was measured with the Hitachi 101 spectrophotometer, from which value the protein content was calculated.
The purified ovalbumin of chicken egg was used as the standard of the protein content.
Fig. 1. pH rising apparatus for column chromatography
Polyacryl amide gel electrophoresis—The first component passed through the CM-cellulose column was dialyzed against the water and concentrated by the dialysis against the con-centrated polyethylene glycol (Av. M.W., 7,500) aq. solution. This solution was applied for the gel electrophoresis. The thin layer electrophoresis with polyacrylamide was done referring to the discontinuous method recommended by Tachibana and Yamaura. 14) The experimental conditions were as follows : gel concentration 4 %, gel buffer ; tris-citric A., pH 8.8, electrode buffer ; 0.3M boric A.-0.05M NaOH pH 8.2, a constant current of 1.64 mA per cm, staining ; 1 % amide black in methanol-water-acetic A. (5 : 5 : 1 v/v) and decolorization with 10 % acetic A.
Separation by gradient extraction with ammonium sulfate— The full saturation was achieved by adding excess ammonium sulfate to 4 ml. of dilution (C ; 4 %) of the homogenized egg white, and small amount of celite (1 g.) was added on it. The precipitates and the super-natant were put slowly on the celite layer
of the extracting apparatus shown in Fig. 2 recommended by Soejima.'5 The extrac-tion of precipitated proteins was performed by decreasing continuously the concentra-tion of ammonium sulfate from its full saturation to approximately zero. The elu-ate was collected with the fraction collector with the capacity of 5 m l. The flow rate was fixed at 0.6-0.7 ml. per minute. With a syringe inserted into the gum tube lea-ding to the extracting part at every given time, a very slight volume of ammonium sulfate solution was taken and the refractive index of the solution was measured at 19°C with the Abbe's refractometer. Separately, the standard line of the refractive index at 19°C of the ammonium sulfate with various concentrations was established. Basing on
the line, the sured values. before.
Separation
Fig. 2. Apparatus for gradient with ammonium sulfate
A : saturated (NH4)2SO4 B : water
extraction
concentrations of ammonium sulfate were determined from those really mea-Protein and sugar contents in each fraction tube were determined as stated of protein not precipitated by full saturation of ammonium sulfate — After the
homogenized egg white was brought to its full saturation with the addition of ammonium sulfate, it was allowed to stand overnight and then it was centrifuged for ten minutes at 13,000 r. p. m. The supernatant was dialyzed against the water to remove the free sugar, amino acid, salt and the other low molecules. It was followed by the dialysis against 10 % polyethylene glycol (Av. M.W., 7,500) solution to concentrate, and the protein and sugar contents were determined.
Electrophoresis on ovalbumin and its sugar analysis — As the material, 125 quail eggs and 20 chicken eggs were employed respectively. Ovalbumin was isolated from the homoge-nized egg white by the salting out with the sodium sulfate followed by the recrystalliza-tion repeated several times. Electrophoresis on the ovalbumin was performed as stated before. Neutral sugar analysis was done qualitatively. The purified ovalbumin 400 mg. was hydrolyzed with 50 ml. of 1N H2S4, in a sealed tube for 7 hours, the hydrolyzate was filtered and diluted to 500 ml. The solution was treated with Amberlite IR-120, followed the Amberlite IR-4B, and concentrated under the reduced pressure. The solu-tion, treated thus, was employed for paper chromatography, using such solvent as buthanol-acetic A.-water (4 : 1: 2, v/v) and collidine saturated with water respectively. Saturated AgNO3-aceton and 0.5N NaOH in ethanol were used for developing the colour.
Preparation of water-extractable glycoprotein from the heat coagulated egg white—The two beakers covered with the watch glass in which held respectively 170 ml. of quail egg white homogenate from 35 eggs and 200 ml. of chicken's one from 7 eggs were placed in a water bath, and then the bath temperature was raised gradually. The egg whites were kept at 98°C in a boiling bath for 40-50 minutes. Coagulated egg whites were blended with 300-400 ml. of water using a homogenizer, centrifuged at 13,000 r. p. m. for ten minutes and the precipitates were treated with the same treatment, repeated. Dialysis of the combined supernatant against the water followed the evaporating on a boiling water bath to concentrate. After that, the solution was filled up to 250 ml. An aliquot of the solution was taken for the determination of the protein content and the remaining solu-tion was lyophilized. It was employed for the electrophoresis and the sugar-protein ratio measurement. The quantity of the coagulated protein was calculated from the difference between the quantities of the original and the uncoagulated proteins.
Results and discussion
General chemical properties— The general chemical properties of the quail and chicken egg whites are as shown in Table I. Feeney et al.3) described that the white and yolk
indices in 25 different species are in general very similar. Similary, the examination of the author showed that there is no noticiable difference in the white and yolk index, white-entire egg ratio and solid content between the quail and the chicken eggs. Com-pared with the chicken egg white, it was observed that the specific gravity of the quail egg white was slightly smaller, while on the other hand, pH value and specific conductance were higher, and especially the nitrogen content amounting to 17.5 % was much larger.
This fact suggests that the basic amino acids are to be found more in the quail egg white than in the chicken white. The sugar-protein ratios in both egg whites were 8.03 and 7.18
x 10-2 respectively, in which the free sugar and free amino acid were also included. Then the ratio of the combined sugar to the protein was measured after removing the low molecular substances by dialysis. The carbonate buffer pH 9.80 which would prevent
protein precipitates was used for the dialysis. The ratio was amounting to 4.60 x 10⁻² in the quail and 3.71 x 10⁻² in the chicken. These results suggest that the ovomucoid con-tent in the former is more than that in the latter or that the specific protein containing much combined sugar exists in the former.
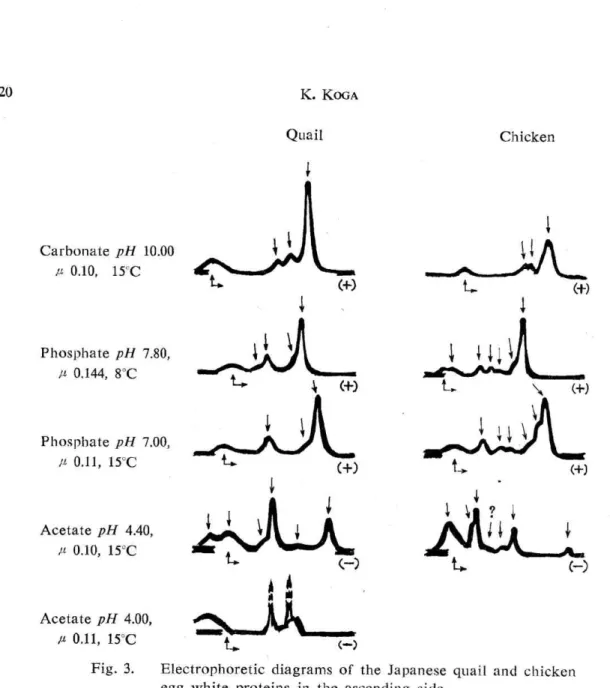
Electrophoretic analysis— The electrophoretic patterns and mobilities of both birds egg white proteins in the ascending side are as shown in Fig. 3 and Table II . Both egg whites were separated together into three components with the carbonate buffer, pH 10.0, p 0.10 and each mobility of the three components in the quail white was slightly smaller. Su-gano 11) observed eight components separated from the chicken egg white under the con-ditions of pH 7.80, p 0.144 and 2°C, with Tiselius apparatus of his own making, while by the author's analysis at 8°C the number of the obviously confirmed components was six . In the case where the same buffer was used, the quail egg white revealed four components . At pH 7.00, p 0.11 both egg whites were separated to the patterns similar to that mentio-ned above respectively. When the separate phosphate buffers having pH 6.47, p 0 .11, and pH 5.91, p 0.12 were employed, the quail egg white revealed only three components toge-ther. These phenomena may be due to the stronger interaction"' between the constituents proteins. However, it was presumed from the mobilities of the ones with the largest quantities among the components separated with different buffers that the isoelectric
po-Fig. 3. Electrophoretic diagrams egg white proteins in the These diagrams show the
of the Japanese quail ascending side traced photographs.
and chicken
Table II. Electrophoretic mobilities different pH values in the
of the egg white ascending side
int of ovalbumin of the quail is higher than that of the chicken. Longsworth et al. 16) observed, under the condition of pH 4.45, p 0.10, six components in the chicken egg white. The author too observed six components in two species egg whites under the conditions
of pH 4.40, p 0.10, at 15°C, but those separated patterns differed from each other. It is
interesting that two components, the one charged negatively and the other no charged even at this pH value are observed in the quail egg white. Forsythe and Foster 2) stated that at least one anionic protein will be observed even at pH 3.9 when electrophoresis is applied to the chicken egg white. Similar phenomenon was also ascertained in the quail egg white at pH 4.0.
In the electrophoresis at the pH 7.80 and 4.40, the mobilities of each component in the quail egg white were smaller than those of the corresponding component in the chicken egg white. This suggests that the isoelectric points of those components are respectively higher in the quail than in the chicken.
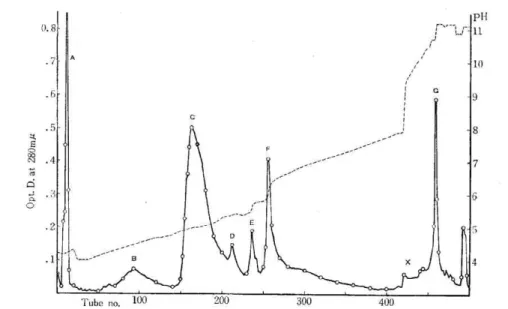
CM-cellulose column chromatography -- In the fractionation of the chicken egg white
which was performed by Rhodes et al.13) the all proteins were eluted near their isoelectric points.
The elution diagrams of the quail and chicken egg white proteins separated by
CM-cellulose were as shown in Fig. 4 and 5 separately. The separation pattern of the former
was similar to that of the latter and both diagrams revealed eight components respectively.
Those components were marked A, B, C---X and G in the order of their elution. The
final peak which was not marked was considered to be the column-denatured protein.
The protein content in each component and p11 of the eluate at each peak were
repre-sented in Table III. Refering to the literature, 13) 16) 17) it could be inferred that component
A is the protein being anionic at pH 4.0 (I. E. P.<4.0), B ovomucoid, C ovalbumin, D
globulin (G3), E globulin (G2), F conalbumin, X globulin and G lysozyme (G1).
Comparing with the pH value of the eluate at each peak of the chicken egg white proteins, the quail ovomucoid only is lower, while on the other hand ovalbumin, globulins
and conalbumin are slightly higher and lysozyme is equal each other. Those results demon-strate the isoelectric point of the quail ovomucoid being lower than that of the chicken ovomucoid. The spreading of both ovomucoid patterns may be attributed to their he-terogeneities. The slight differences among the other proteins have been appreciated in the experiments repeated three times. This suggests that each isoelectric point of those com-ponents is slightly higher in the quail than in the chicken, and also agrees with the relation between the elcetrophoretic mobilities of the quail and chicken egg whites stated before.
repeated experiments was as follows : When compared with the chicken egg white prote-ins, in the quail egg white proteins, much of them are anionic protein and ovomucoid , while the components corresponding to ovalbumin and lysozyme are small
. Concerning the globulins and conalbumin, no difference was observed significantly.
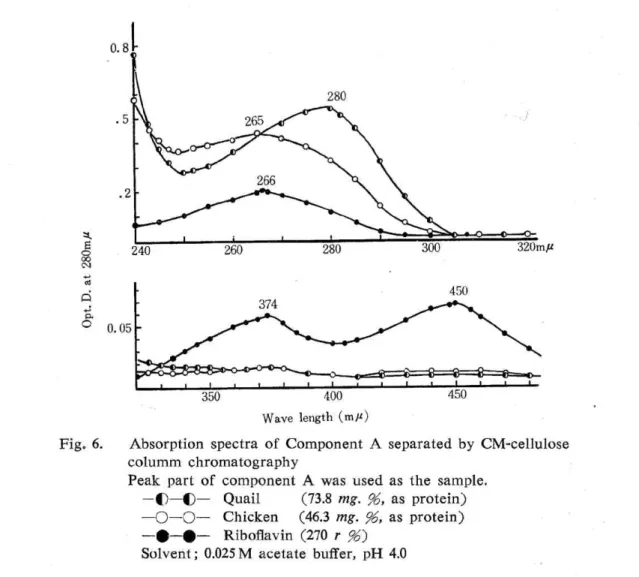
On the component A — Each component A in both quail and chicken egg whites appeared to be only one band on the gel electrophoresis respectively and the relative mobilities were amounting to 100 in the chicken, 103 in the quail. The observation of only one band run shows that the elution of component A was not attributed to the preceeding of exchange capacity. When the effluents corresponding to the peak of the component A in the quail and chicken egg whites were examined spectrophotometrically
, the former showed the absorption maximum at 280 mu, the latter, at 265 mp as shown in Fig
. 6. The riboflavin revealed the maximum at 266, 374 and 450 mƒÊu.
Fig. 6. Absorption spectra of Component A columm chromatography
separated by CM-cellulose
Biuret reaction of the effluent corresponding to the peak of component A was strong in the quail, while weak in the chicken. Kanamori and Kawabata 18) reported that this component A was a riboflavin dissociated from flavoprotein in the chicken egg white pro-teins studied with CM-cellulose. Rhodes et al. 13) described in their paper that when the
rechroma-on CM-cellulose, while the ovomucoid was eluted at pH 4.0. Judging from the absorption curves shown in Fig.6, the component A of the quail egg white may differ from that of the chicken in its structure, and the latter was not agreeing with free riboflavin, either.
Gradient extraction with ammonium sulfate — On the preliminary experiment, a series of eluting buffers for CM-cellulose chromatography were passed through the column, on which the protein sample had not been adsorbed. Collecting the passed solution at each fraction of 5 ml., the estimation of sugar content was performed. Contrary to the expectation, it was noticeable that the considerable quantities of sugar were contained in all fractions and the elution of sugar from CM-cellulose was very remarkable at the changing point of buffers. From those observation, it was fixed to be not significant that each protein fraction separated with CM-cellulose column is employed for determining the S-P ratio in that condition. Hence, the author determined the ratio in the proteins separated by the gradient extraction with salt.
The separations of the protein and sugar of the two species egg whites by the gradient extraction are as shown in Fig. 7, 8, 9 and 10. The separation pattern of the quail egg white was similar to that of the chicken and both diagrams revealed six components
respectively. The component extracted by full saturation of ammonium sulfate was ma-rked A, and each component extracted was marked in the order of B, C, D, E and F
res-pectively.
The protein and sugar contents of each component are as represented in Table IV. In general, as the classification of protein is based on the solubility, judging from that stand-point it is to be inferred that each of the component A, B is ovomucoid, C ovalbumin
Separation of the chicken egg white proteins by gradient extraction with salt
and conalbumin mixture, and D, E, F are globulin or globulin like protein, respectively. Component A is protein with relative content of 5.5 % in the quail egg white and of 3.4 % in the chicken egg white. It does not precipitate even by full saturation with salt. As free sugar and free amino acid are mixed in this fraction, the fluctuation of S-P ratio is great so that the value itself is meaningless. Therefore, the solution of protein which did not contain the free sugar and other low molecular substances was exclusively prepared separately. The S-P ratio of the protein preparations above was larger in the quail than
Protein and sugar contents of each and chicken egg whites separated with ammonium sulfate
component by gradient
of the quail extraction
in the chicken, coming to 37.2 x 10⁻² in the former, 23.0 x 10⁻² in the latter. It remains as a matter of not a small interest.
Comparing with the chicken proteins, the quail glycoprotein (component B added to com-ponent A content) is large, while the component corresponding to ovalbumin and con-albumin is small in quantity. These relations are agreeing with that observed in the CM-cellulose chromatograms. Except for component B, the S-P ratios of all components were
slightly larger in the quail than in the chicken. It is remaining to know why the ratio of component B in the latter was very large.
Electrophoresis on the isolated ovalbumin and its sugar analysis — Electrophoretic diagrams and mobilities of the quail and chicken ovalbumins at different pH values in the ascen-ding side were as shown in Fig. 11 and Table V. Quail ovalbumin was to be ascertained to differ from the chicken one markedly. The former was resolved into two components, the latter, only one, in both carbonate buffer (pH 9.80) and phosphate buffer (pH 7.00). Each mobility of their main component separated in both buffers was larger in the former than in the latter. When the ovalbumins were dialyzed against the acetate of the different pH values, only chicken ovablumin solution produced a little amounts of white
precipi-tates, while none was observed in the quail ovalbumin solution. Quail ovalbumin was se-parated at pH 5.20 of acetate into three components, in which only one was positively charged, and the chicken ovalbumin revealed only one component. The major component of the former gave the mobility, coming to -3.6 x 10⁻⁵, and the latter, -3.4 x 10⁻⁵ (cm2 per volt second).
At pH 4.80 the quail ovalbumin was separated into three components similary above, in which only one was positively charged, and the chicken ovalbumin revealed two
Electrophoretic diagrams of quail and chicken ascending side.
Diagrams show the traced photographs.
at different pH values in the ascending side (at 15°C)
components which are called ovalbumin A1 and A2. The major component of the former gave the mobility, coming to 1.43 x 10⁻⁵, the major component of the latter, 1.38 x 10⁻⁵. The quail revealed three components, and the chicken, only one, at pH 4.6, where the major component in the former did not run, while the component of the latter exhibited the mobility amounting to -0.36 x 10⁻⁵. The S-P ratios of the quail and chicken ovalbumin
were ascertained to be 4.32 x 10⁻² and 2.70 x 10⁻² respectively. Both quail and chicken
ovalbumin aqueous solutions were placed in a freezer and they were kept for 12 months at -20°C. After that, when released from the freezed-condition, the quail ovalbumin solu-tion did not show a visible variasolu-tion, though the chicken ovalbumin solusolu-tion produced
a small quantity of precipitates being denatured proteins. Electrophoretically, the former
revealed two components which gave the mobilities of -11.3 x 10⁻⁵ and -8.7 x 10_I (cm2 per volt second) at pH 9.80, p 0.10, while the latter, one component with the mobiliy of -12.2 x
10-s. Those values are larger than those of unstored ovalbumin respectively, and its relation is agreeing with a part of results obtained by Evans et al.19) on the variation of proteins in chicken shell egg during the storage, with paper electrophoretic technique. The S-P ratios of the quail and chicken ovalbumins after storage were coming to 4.20
x 10-2 and 2.46 x 10⁻² respectively. A number of investigations on the carbohydrate of
chicken ovalbumin have been published. Johansen, Marshall and Neuberger 20) 21) reported
2 96 of mannose and 1.2 % of glucosamine (Mol. ratio, 5 : 3) contained in the ovalbumin. After that, determining the mannose in ovalbumin by radio isotope dilution, they proposed the content coming to 1.77 %.22) Lee and Montgomery stated 2.1-2.2 % of mannose and 1.2 % of glucosamine (Mol. ratio, 6 : 3),23) Bragg and Hough 24, 2.75 % of mannose and 1.34 % of glucosamine (Mol. ratio, 6.9:3.4).
The value obtained by the author coincides with the mannose value of Bragg et al. Neutral sugars combined to the quail and chicken ovalbumins were identified with man-nose and galactose together by paper chromatography, and manman-nose was more larger than galactose in quantity. Largeness of the sugar content in the Japanese quail ovalbumin is noteworthy, because such large value in ovalbumin have not been found. In spite of the recrystallization repeated several times, minor component observed in the electrophoretic
diagrams at pH 9.80 and 7.00 could not be removed. It was fixed not to be ovomucoid
because its mobility was smaller than that of ovalbumin and fixed not to be globulin,
either. Perhaps it will be a certain special ovalbumin. Fothergill and Perrie 25) suggested
the differences in the structure between the chicken and duck ovalbumins, making studies
on the peptide obtained from both ovalbumins by partial hydrolysis with papain. The
results obtained by the author demonstrates considerable differences in chemical structure between the quail and chicken ovalbumins.
co-agulated and uncoagulated proteins when the quail and chicken egg whites were respec-tively heated in a boiling water bath were represented in Table VI. Uncoagulated pro-tein i. e. glycoprotein was fixed to be more in the quail than in the chicken. The gly-coproteins water-extracted from the heat coagulated egg whites were respectively dialyzed against different buffers. Electrophoretic patterns and mobilities in the ascending side were as shown in Fig. 12 and Table VII.
The Japanese quail glycoprotein appeared to be only one sharp peak in alkali and neutral buffers, while that of the chicken was separated into two components. Mobilities of the quail glycoproteins were revealed slightly larger than those of the chicken in buffers men-tioned above. In other words, it indicates that the isoelectric point of whole glycopro-tein is lower in the quail than in the chicken. And this is agreeing with the relation
Electrophoretic diagrams of the glycoproteins water-extracted from the heat-coagulated egg whites of the Japanese quail and chicken
Diagrams show the traced photographs in the ascending side.
Quantities of coagulated and uncoagulated the egg whites were treated with heating
proteins when
Heating : The for
homogenized egg whites were treated at 98°C 40-50 minutes.
from the heat-coagulated egg white
All values were estimated on the ascending patterns. Units of mobilities are 10-5 cm2 per volt second.
between the pH values at peak of the two species ovomucoids on CM-cellulose chroma-tography. When dialyzed against the buffers of pH 4.40 and 4.00 separately, both of the glycoprotein solutions produced the considerable amounts of white precipitates respectively. On electrophoresis at pH 4.40, only one component scarcely moved was observed in both the quail and chicken glycoproteins, respectively. Hence, it can be asserted that at least two components do really exist under that condition. At pH 4.0, major two components and minor one component were revealed and one of the two major components was found scarcely moved. Therefore, from the standpoint stated before it can be asserted that at least four components do really exist at pH 4.0 in both quail and chicken glycoproteins. As shown in Table VIII, the S-P ratio of the quail glycoprotein is smaller than that of the chicken glycoprotein in any case after dialyzing against different buffers.
Table VIII. Sugar-protein ratio of the glycoproteins water-extracted
from the heat-coagulated egg white
Since Longsworth et al. 16) suggested the electrophoretic heterogeneity of ovomucoid,
numerous studies on ovomucoid have been taken place. Bier et al. 26) demonstrated the heterogeneity of chicken ovomucoid and Rhodes et al. 4) divided the ovomucoids from 11
different avian species into four classes in the basis of their antiproteolytic activities. Bragg and Hough 24) reported 6.3 % of mannose, 1.7 % of galactose and 12.3-12.8 % of
glu-cosamine contained in the chicken ovomucoid. Chatterjee and Montgomery 27) indicated
4.7 % of mannose, 1 % of galactose and 14.6 % of glucosamine, while Ketterer 28) isolated a new glycoprotein differing with ovomucoid from the hen's-egg white and named "ovo-glycoprotein", which contained 13.6 % of hexose and 13.8 % of glucosamine. In the earlier investigation, it was described that no denaturation was apparent after the ovomucoid is
heated for one hour at 100°C 29), however, the biochemical inactivation occurs under
such condition.30} The glycoproteins extracted from the coagulates of the quail and chi-cken egg whites revealed their heterogeneities respectively, though two species
teins differed one another electrophoretically. The sugar content of quail glycoprotein was ranged from 8.7 % to 9.7 %, while that of chicken glycoprotein, from 14.6 % to 17.4
% as shown in Table VIII. The value of the latter is remarkably high, compared with the hexose contents of ovomucoid which have been reported hitherto. It is rather near the ovoglycoprotein obtained by Ketterer. 28) As sugar contents of the proteins not preci-pitated by full saturation of ammonium sulfate were amounting to 37 % in the quail and 23 % in the chicken, those proteins were also ascertained to be glycoproteins respectively. However, the relation between both the sugar contents was the reverse of the relation mentioned before. Those experimental results demonstrate that the quail's glycoprotein differs considerably from the chicken's one. As the complexity of glycoprotein is a matter of great interest, its investigation is now under way in the author's laboratory.
Summary
1) The pH value, specific conductance, the combined sugar-protein ratio and the nitro-gen content of the Japanese quail egg white are larger than each corresponding value of the chicken egg white. Nitrogen content in the dry matter was especially high, coming
to 17.5 %. However, specific gravity was rather small.
2) The quail and chicken egg whites were separated together into three components with the carbonate buffer electrophoretically and each mobility of the three components in the quail egg white is slightly smaller than that of the chicken. The former was sepa-rated into four components at pH 7.80, ƒÊ 0.144, though the latter was separated into six components and both egg whites revealed respectively the patterns resembling those just above-mentioned, at pH 7.00, ƒÊ 0.11.
Under the condition of pH 4.40, p 0.11, six components were observed respectively in both egg whites, differing with each other in their separated patterns. Even at such con-dition, both negatively charged and no charged components were observed in the quail, though negatively charged component, only, in the chicken. In the electrophoresis at pH 7.80 and 4.40, the mobilities of each component in the quail egg white were smaller than those of the corresponding components in the chicken egg white.
3) The elution diagrams of egg white proteins of the two species separated by CM-cellulose revealed eight components respectively, resembling in their separated patterns one another. Comparing with the pH value of the eluate at each peak of the chicken egg white proteins, only the quail ovomucoid is low, while on the other hand, ovalbumin, globulins and conalbumin are slightly high and lysozyme equals one another. The protein being anionic at pH 4.0 (Component A) and ovomucoid are more in the quail than in the chicken, while the components corresponding to ovalbumin and lysozyme in the former appeared less in quantity. When the component A in the quail and chicken egg whites was examined spectrophotometrically, the former showed the absorption max-imum at 280 mu, the latter, at 265 m e. Component A appeared to be only one band on the gel electrophoresis.
4) Six components were ascertained respectively in the quail and chicken egg white proteins by the gradient extraction with ammonium sulfate. The sugar content of the protein which was not precipitated by full saturation of ammonium sulfate was larger in the former, coming to 37 %, and 23 % in the latter. Comparing with the chicken
pro-is small in quantity. Except for component B, the sugar-protein ratios of all components were slightly larger in the quail than in the chicken.
5) Quail ovalbumin was ascertained to differ markedly from the chicken one elect-rophoretically. The former was separated into two components, the latter , only one, in both carbonate and phoshate buffers. The mobility of the main component of the quail ovalbumin was smaller than that of the chicken ovalbumin. At pH 5.20, the quail oval-bumin was separated into three components, in which only one was positively charged , while the chicken ovalbumin revealed only one component. At pH 4.80 the former was separated into three components and the latter revealed two components what are
called ovalbumin A, and A, and the mobility of the main component of the quail ovalbumin was smaller than that of the chicken one. The quail albumin revealed three components and the chicken albumin, only one, under the condition of pH 4.60, where the major component in the former was left unrunning, and the component of the latter gave the mobility amounting to -0.36 x 10⁻⁵. The sugar contents in the quail and chicken ovalbumins were ascertained to be 4.32 % and 2.70 % respectively. Neutral sugar of the quail ovalbumin was fixed to be mannose and galactose, agreeing with the chicken one.
6) Water extractable glycoprotein from the heat coagulated egg whites was ascertained to be more in the quail than in the chicken. Quail glycoprotein appeared to be only one sharp peak electrophoretically in alkaline and neutral buffers, though that of the chicken was separated into two components. The mobility of the former was revealed slightly larger than those of the latter. At pH 4.40, only one component which moved scarcely was observed in both quail and chicken glycoproteins respectively. At pH 4.0, major two components and minor one component revealed and one of the two major components was observed to be moving scarcely. The sugar content of the quail glycoprotein is much smaller than that of the chicken one in any case after being dialyzed against the different buffers.
A part of this study was reported at the Meeting of the Western Japanese Division of Agricultural Chemical Society of Japan, Kagoshima, Oct. 22, 1965
and Saga, Oct. 14, 1967 and at the Annual Meeting of this Society , Kyoto,
Apr. 1, 1966.
Acknowledgement — The author wishes to thank the assistance of Mr. Takao Fukunaga and Miss Kyoko Kanou in some of these experiments. This work was supported in part by a Grant-in-Aid for Scientific Research from the Ministry of Education, the Japanese Government, Japan.
References
1) BAIN J. A. and H. F. DEUTSCH : J. Biol. Chem., 171 531-541 (1947). 2) FORSYTHE R. H. and J. F. FOSTER : J. Biol. Chem., 184 377-383 (1950).
3) FEENEY R. E., J. S. ANDERSON, P. R. AZARI, N. BENNETT and M. B. RHODES : J. Biol. Chem., 235 2307-2311 (1960).
4) RHODES M. B., N. BENNETT and R. E. FEENEY : J. Biol. Chem., 235 1686-1693 (1960). 5) CLARK J. R., D. T. OSUGA and R. E. FEENEY : J. Biol. Chem., 238 3621-3630 (1963).
WISEMAN R. L. and J. E. FOTHERGILL : Biochem. J. 99 58p (1966). WISEMAN R. L. and J. E. FOTHERGILL : Biochem. J. 99 25p (1966).
FEENEY R. E., H. ABPLANALP, J. J. CLARY, D. L. EDWARDS and J. R. CLARK : J. Biol. Chem., 238 1732-1736 (1963).
FEENEY R. E., J. J. CLARY and J. R. CLARK : Nature 201 192-193 (1964). FORSYTHE R. H. and J. E. FOSTER : Arch. Biochem., 1.29 161-163 (1949). SUGANO H.: The Physico-chemical Biology, Japan, 1 41-46 (1951).
DuBois M., K. A. GILLES, J. K. HAMILTON, P. A. REBERS and F. SMITH : Anal. Chem., 28 350-356 (1956).
RHODES M. B., P. R. AZARI and R. E. FEENEY : J. Biol. Chem., 230 399-408 (1958). TACHIBANA T. and K. YAMAURA : SABCO Journal, Japan, 1 (2) 15-20 (1965). SOEJIMA M.: Protein, Nucleic acid, Enzyme, 9 1-9 (1964) KyOritsu Pub. Co., Japan.
LoNGSWORTH L. G., R. K. CANNAN and D. A. MACINNES : J. Am. Chem. Soc., 62 2580-2590 (1940) HESSELVIK L.: Z. Physiol. Chem., 254 144-146 (1938).
KANAMORI M. and M. KAWABATA: The Scientific Report of Kyoto Prefectural Univ., (Agricul-ture) 11 182-186 (1959).
EVANS R. J., J. A. DAVIDSON, D. H. BAUER and S. L. BANDEMER : Poultry Sci., 37 81-88 (1958) JOHANSEN P. G., R. D. MARSHALL and A. NEUBERGER : Nature 181 1345-1346 (1958).
JOHANSEN P. G., R. D. MARSHALL and A. NEUBERGER : Biochem. J. 77 239-247 (1960). FRANCOIS C., R. D. MARSHALL and A. NEUBERGER : Biochem. J. 83 335-341 (1962). LEE Y. C. and R. MONTGOMERY : Arch. Biochem. Biophys. 95 263-270 (1961). BRAGG P. D. and L. HOUGH : Biochem. J. 78 11-23 (1961).
FOTHERGILL J. E. and W. T. PERRIE : Biochem. J. 99 58p (1966).
BIER M., J. A. DUKE, R. J. GIBBS and F. F. NORD: Arch. Biochem. Biophys. 37 483-491 (1952), 47 465-473 (1953).
CHATTERJEE A. K., and R. MONTGOMERY : Arch. Biochem. Biophys. 99 426-432 (1962). KETTERER B.: Biochem. J. 96 372-376 (1965).
FREDERICQ E. and H. F. DEUTSCH : J. Biol. Chem., 181 499-510 (1949). LINEWEAVER H. and C. W. MURRAY : J. Biol. Chem., 171 565-581 (1947).