Some Aspects on Rice Cultivation in East Java,
Indonesia, especially on Madura Island
著者
KATAYAMA Tadao C.
journal or
publication title
南海研紀要
volume
3
number
2
page range
99-115
URL
http://hdl.handle.net/10232/15621
Mem. Kagoshima Univ. Res. Center S. Pac, Vol.3, No. 2, 1983 99
Some Aspects on Rice Cultivation
in East Java, Indonesia, especially
on Madura Island
Tadao C. KATAYAMA*
Introduction
During the period from June to July in 1981, the writer was sent to Indonesia for
research on agricultural practices under the project, designated as "Ecological biology
and the promotion on tropical primary industry", supported by a grant from the Min
istry of Education, Japan. Rice cultivation in East Java was studied from several view points. Observations were also made in Middle Java and Bali Island for the extensive
comparisons, and the results obtained in East Java are briefly reported in the present
paper.Several research reports on rice cultivation in Indonesia, especially in Java Island,
have been reported711'. However, no distinct record was reported on Madura Island,
East Java Province.
In this paper, rice cultivation is divided into grain morphology,
statistical record and cultivating systems. It is said that improved varieties of the indica
type of rice are being cultivated and that primitive types of indica and javanica are
not used in these areas at present. However, it is not certained whether the same can
be said for Madura.
Acknowledgements: The writer wishes to express his hearty thanks to Prof. Dr.
IWAKIR1 and other members of this party, all of whom helped and gave their valuable
advice.
Materials and Methods
Twenty-nine strains of rice strains collected in East Java were used in this experi
ment.
Thirty grains were used for each strain.
Measurements were taken of length,
width and thickness of unhusked grains at the largest points of the respective charac
ters.
Further calculations were done for determine the ratios of length to width, of
length to thickness and of width to thickness.For the analyses of the production and their characteristics of the rice, statistical
reports published by the governments concerned121 and scientists6) were used. Several
data found in these publications were rearranged and analysed for comparison with
locality characteristics and other crop kinds.
For discussion on combinations of rice with other crop kinds, alternating cropping
systems, multi-cropping systems, relations between rice cultivation and seasonal changes,
and other items, data obtained from observations and hearings were used.
Results and Discussion 1. Grain morphology
On the grain morphology of rice strains, some reports have been published8'. However, no distinct record has been reported on the grain morphology of cultivated rice varie ties in Madura Island, East Java, Indonesia. In these districts, several cultivated rice,
Oryza sativa L., are used in lowland and upland fields. Most of them are introduced
from Java proper, Bali, India, the Philippines and others.
Twenty-nine varieties of
cultivated rice in these areas were collected and used for morphological investigations.
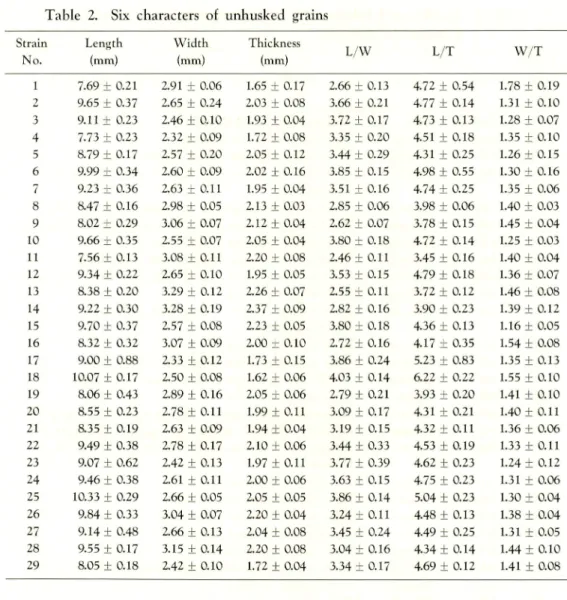
They are listed up in Table 1. The results of the investigations are given below. 1. Lengths of grains ranged from 10.33 mm (No. 25) to 7.56 mm (No. 11) in the strain average (Table 2). There were great differences in length between strains. The average and standard deviation of all the 29 strains was found to be 8.96 ± 0.78. The standard deviation of each strain, i. e., intra-population's variations, ranged from 0.88
(No. 17) to 0.13 (No. 11). The range for No. 17 was particularly large. These averages
and their standard deviations were found to be 0.31 + 0.16. In all the strains recom
mended in all the Indonesia10' (abbreviated as the whole Indonesia, and so forth), lengths
ranged from 11.24mm to 6.46 mm, and their average was found to be 8.70 mm. Stand ard deviations of each strain were found to be 0.36 + 0.15.
2. Widths of grains ranged from 3.29mm (No. 13, red grains) to 2.32mm (No. 4). The average and standard deviation of all the 29 strains was found to be 2.74 + 0.28. The standard deviation of each strain ranged from 0.24 (No. 2) to 0.05 (Nos. 8 and 25). It was noted that the value was particularly large in No. 2. These averages and their
standard deviations were found to be 0.11 + 0.05. In all the Indonesia, widths ranged
from 4.28 mm to 2.35 mm, and their average was found to be 3.09 mm. Standard de viations of each strain were found to be 0.12 + 0.07.
3. Thicknesses of grains ranged from 2.37 mm (No. 14, red grains) to 1.62 mm (No. 18). The average and standard deviation of all the 29 strains was found to be
2.01 + 0.18. The standard deviation of each strain ranged from 0.17 (No. 1) to 0.03
(No. 8). These averages and their standard deviations were found to be 0.08 + 0.04. In all the Indonesia, thicknesses ranged from 2.62 mm to 1.69mm, and their average
was found to be 2.06 mm. Standard deviations of each strain were found to be 0.07 ±
0.01.
4. L/W (ratio of length to width) ranged from 4.03 (No. 18) to 2.46 (No. 11). The
average and standard deviation of all the 29 strains was found to be 3.31 + 0.47. The standard deviation of each strain ranged from 0.39 (No. 23) to 0.06 (No. 8). These
averages and their standard deviations were found to be 0.18 + 0.07. In all the Indo
nesia, L/W ranged from 4.08 to 1.86.
5. L/T (ratio of length to thickness) ranged from 6.22 (No. 18) to 3.45 (No. 11). The average and standard deviation of all the 29 strains was found to be 4.50 + 0.53. The standard deviations of each strain ranged from 0.83 (No. 17) to 0.06 (No. 8). These averages and their standard deviations were found to be 0.23 + 0.16. In the whole
Mem. Kagoshima Univ. Res. Center S. Pac, Vol. 3, No. 2, 1983 101
Table 1. Locality and habitat of the cultivated rice, Oryza sativa L.,
collected in East Java
Detailed locality, habitat, local name and remarks
Col
lection Date Place No. 1 June 28 Galis 2 June 29 Gapura 3 July 2 Gandung 4 July- 2 Campion 5 July 4 Sampang 6 July 4 Sampang 7 July- 4 Sampang 8 July 4 Terenggi 9 July 4 Terenggi 10 July 4 Terenggi 11 July- 4 Terenggi 12 July 4 Terenggi 13 July 4 Terenggi 14 July- 5 Sampang 15 July 5 Sampang 16 July- 5 Kwanyar 17 July 6 Bangkalan 18 July 6 Socah 19 July 7 Tragar 20 July 7 Tragar 21 July- 7 Tragar 22 July 7 Tragar 23 July- 7 Tragar 24 July 7 Burneh 25 July 7 Burneh 26 July 7 Burneh 27 July- 7 Bruneh 28 July 14 Jenu 29 July 15 Lamongan
Swampy area, near TAMBAK.
Breeding Station. So called C4.
Rice terraces, dominant strain in their areas.
Near seashore. Cultivating tobacco, corn and cassava
in near farms.
Southwest from Sampang. Well managed paddy field. Same locality as above. Near field growing Miscanthus sp. Same locality as above. Near pond.
South from Terenggi. Shallow water paddy field.
Same locality as above. Sporadically with No. 8. Long awn. Same locality as above.
Same locality as above. Sporadically with No. 10. Violet long awn.
Same locality as above.
Same locality as above. Red grain. Long awn.
TAMBAK near Sampang. Red grain. Long awn.
Same locality as above.
Northwest from Kwanyar. Shallow water paddy field.
SAWAH TAMBAK. Medical crop growing near field.
Swampy field. Advanced strain growing near field by
embankment.
Northwest from Kwanyar. Same locality as above.
Same locality as above. Red grain. Same locality as above. Red grain.
Same locality as above.
Southwest from Burneh. Mixed growing with Nos. 25-27. Same locality as above.
Same locality as above. Long awn.
Same locality as above.
Shallow water paddy field. So called Niara. Black grain. 4 kilometers east from Lamongan. TAMBAK. Premature harvesting.
6. W/T (ratio of width to thickness) ranged from 1.78 (No. 1) to 1.16 (No. 15). The
average and standard deviation of all the 29 strains was found to be 1.37 + 0.12. The
standard deviation of each strain ranged from 0.16 (No. 6) to 0.03 (Nos. 8 and 10). These averages and their standard deviations were found to be 0.09+0.04. In all the Indonesia, W/T ranged from 2.13 to 1.30.
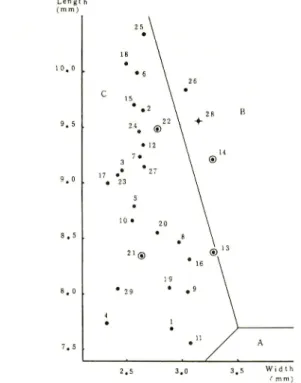
7. According to the classification noted by MATSUO9', the strains used here can be divided into two groups (Fig. 1); type B (=large type or javanica type) —Nos. 14, 26 and 28(10.3 % in the whole), type C (=slender type or indica type) —the remaining 26 strains (89.7 % in the whole), type A (= short type or japonica type) —none. On
Table 2. Six characters of unhusked grains Strain No. Length (mm) Width (mm) Thickness (mm) L/W L/T W/T 1 7.69 ± 0.21 2.91 + 0.06 1.65 + 0.17 2.66 ± 0.13 4.72 + 0.54 1.78 + 0.19 2 9.65 ± 0.37 2.65 + 0.24 2.03 ± 0.08 3.66 ± 0.21 4.77 ± 0.14 1.31 ± 0.10 3 9.11 ± 0.23 2.46 + 0.10 1.93 ± 0.04 3.72 + 0.17 4.73 ± 0.13 1.28 ± 0.07 4 7.73 ± 0.23 2.32 + 0.09 1.72 ± 0.08 3.35 + 0.20 4.51 ± 0.18 1.35 ± 0.10 5 8.79 ± 0.17 2.57 ± 0.20 2.05 ±0.12 3.44 + 0.29 4.31 ± 0.25 1.26 ± 0.15 6 9.99 + 0.34 2.60 + 0.09 2.02 + 0.16 3.85 ± 0.15 4.98 + 0.55 1.30 ± 0.16 7 9.23 + 0.36 2.63 ±0.11 1.95 ± 0.04 3.51 ± 0.16 4.74 ± 0.25 1.35 ± 0.06 8 8.47 + 0.16 2.98 ± 0.05 2.13 ± 0.03 2.85 ± 0.06 3.98 ± 0.06 1.40 ± 0.03 9 8.02 + 0.29 3.06 ± 0.07 2.12 ± 0.04 2.62 ± 0.07 3.78 ± 0.15 1.45 ± 0.04 10 9.66 ± 0.35 2.55 ± 0.07 2.05 ± 0.04 3.80 ± 0.18 4.72 ± 0.14 1.25 ± 0.03 11 7.56 + 0.13 3.08 ±0.11 2.20 + 0.08 2.46 ±0.11 3.45 ± 0.16 1.40 ± 0.04 12 9.34 ± 0.22 2.65 ± 0.10 1.95 ± 0.05 3.53 ± 0.15 4.79 ± 0.18 1.36 ± 0.07 13 8.38 + 0.20 3.29 + 0.12 2.26 + 0.07 2.55 + 0.11 3.72 + 0.12 1.46 ± 0.08 14 9.22 ± 0.30 3.28 + 0.19 2.37 + 0.09 2.82 ± 0.16 3.90 + 0.23 1.39 + 0.12 15 9.70 ± 0.37 2.57 ± 0.08 2.23 ± 0.05 3.80 ± 0.18 4.36 ± 0.13 1.16 + 0.05 16 8.32 ± 0.32 3.07 + 0.09 2.00 ± 0.10 2.72 ± 0.16 4.17 ± 0.35 1.54 ± 0.08 17 9.00 ± 0.88 2.33 ±0.12 1.73 ± 0.15 3.86 ± 0.24 5.23 ± 0.83 1.35 ± 0.13 18 10.07 + 0.17 2.50 ± 0.08 1.62 + 0.06 4.03 + 0.14 6.22 + 0.22 1.55 ± 0.10 19 8.06 ± 0.43 2.89 ± 0.16 2.05 ± 0.06 2.79 ± 0.21 3.93 ± 0.20 1.41 ± 0.10 20 8.55 ± 0.23 2.78 ±0.11 1.99 ±0.11 3.09 ±0.17 4.31 ± 0.21 1.40 ±0.11 21 8.35 + 0.19 2.63 ± 0.09 1.94 ± 0.04 3.19 ± 0.15 4.32 ±0.11 1.36 ± 0.06 22 9.49 ± 0.38 2.78 ±0.17 2.10 + 0.06 3.44 ± 0.33 4.53 ± 0.19 1.33 + 0.11 23 9.07 ± 0.62 2.42 + 0.13 1.97 + 0.11 3.77 + 0.39 4.62 ± 0.23 1.24 ± 0.12 24 9.46 ± 0.38 2.61 ±0.11 2.00 ± 0.06 3.63 + 0.15 4.75 ± 0.23 1.31 + 0.06 25 10.33 + 0.29 2.66 ± 0.05 2.05 + 0.05 3.86 ± 0.14 5.04 + 0.23 1.30 ± 0.04 26 9.84 + 0.33 3.04 ± 0.07 2.20 ± 0.04 3.24 ± 0.11 4.48 ±0.13 1.38 ± 0.04 27 9.14+ 0.48 2.66 ± 0.13 2.04 + 0.08 3.45 ± 0.24 4.49 ± 0.25 1.31 ± 0.05 28 9.55 + 0.17 3.15 ± 0.14 2.20 ± 0.08 3.04 ±0.16 4.34 + 0.14 1.44 + 0.10 29 8.05 ±0.18 2.42 ± 0.10 1.72 + 0.04 3.34 ± 0.17 4.69 ±0.12 1.41 ± 0.08
the other hand, the whole Indonesia's strains were divided as follows10'; 10 strains
(4.45 %) belonging to type A, 59 strains (25.99 %) belonging to type B, 158 strains
(69.60%) belonging to type C.
8. In comparison with the present and the past data in view of strain differen
tiations, the following facts were ascertained, i) Lengths of the present materials were
remarkably longer than that of the whole Indonesia, ii) Widths of the present materials were remarkably narrower than that of the whole Indonesia, iii) Thicknesses of the present materials were nearly the same with that of the whole Indonesia, iv) Variations of length in the present materials were clearly smaller than that of the whole Indo nesia, v) Variations of width and thickness in the present materials were nearly the same with that of the whole Indonesia. In comparison with the data of the whole Indonesia, the materials in the present study would be located in the portion as relatively
slender and narrower variations.
9. In view of the standard deviations found in the respective strains, it was reasonably- said that some one showed relatively large and small intra-population's
Mem. Kagoshima Univ. Res. Center S. Pac, Vol.3, No. 2, 1983 103
3.5 Width
Fig. 1. Relation between length and width of unhusked grains in mm. Vertical axis; length of grain, abscissa ; width of grain. Code numbers used in figure correspond to the strain number, which was used in Table 1. s : Red grain, 4-: black grain, • : white grain
variations. The former is said as one located in genetically unstable status. The latter is said as one located in genetically stable status. For example, No. 17 collected at SAWAH TAMBAK near Bangkalan showed the very large variations. In these area,
the materials were used in very large areas and looked upon yet being selecting stage.
On the other hand, No. 8 collected in shallow water paddy field near Terenggi showed
the small variations. Such materials are constantly used in these areas and looked upon
having the long history. 2. Statistical aspects
Productivities of rice were analysed for of the whole East Java and Madura Island,
using the formal statistical records 1'2,6>.
1. In Table 3, productivities of 5 types of rice cultivation in the whole of East Java were analysed, and are shown in precentages; i.c, paddy rice, paddy rice in wet season (abbreviated as wet season, and so forth), paddy rice in dry season (dry season), upland rice and direct sowing culture of paddy rice on well-drained paddy field (direct
sowing).
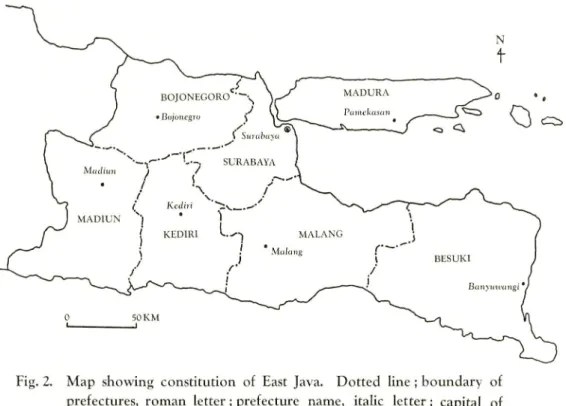
East Java consists of 7 prefectures (Fig. 2). In column A of Table 3, a figure 14.50 in Surabaya for paddy rice means that its product (993,642 ton) in Surabaya has a share of f4.50 % of the whole products (6,854,430 ton) in the whole East Java. Specific ities of the individual prefectures were ascertained to some extent. Seven prefectures can be divided into 4 groups, i.e., 1 - Surabaya and Bojonegoro, 2 - Madiun and Kediri,
Table 3. Shares of rice productions in 7 prefectures of East Java, illustrated
by-shares (%) of the individual rice productions —A to the whole East Java, B to the whole productions of 12 main crops, C to the whole rice products. Direct sowing means direct sowing culture of paddy
rice in well-drained paddy field. Sura
baya
Bojonc-goro
Madhm Kediri Malang Besuki Madura Whole
East Java Paddy rice 14.50 11.23 15.37 14.50 17.63 23.48 3.30 100.00 Paddy rice in wet season 13.51 12.40 16.40 14.79 16.94 22.08 3.89 100.00 Paddy rice in dry season A 14.39 4.59 13.61 15.27 21.61 30.01 0.50 100.00 Upland rice 11.65 5.99 2d72 18.56 9.77 5.00 20.31 100.00 Direct sowing 35.80 40.09 8.18 2.42 0.11 0.00 13.40 100.00 Total 14.46 11.17 15.53 14.55 17.53 23.25 3.50 100.00 Paddy rice 37.50 37.89 33.10 32.95 32.65 41.59 14.11 34.70 Paddy rice in wet season 27.47 29.16 24.61 23.42 21.86 27.27 11.60 24.19 Paddy rice in dry season B 11.29 4.17 aoi 9.35 10.78 14.32 0.58 9.35 Upland rice 0.83 0.49 1.50 1.03 0.44 0.22 2.12 0.84 Direct sowing 3.52 4.56 0.59 0.19 0.01 0.00 1.93 1.17 Total 80.61 76.27 67.81 66.94 65.74 83.40 30.34 70.25 Paddy rice 49.52 49.68 48.89 49.23 49.67 49.87 46.51 49.05 Paddy rice in
wet season 32.16 3a23 36.35 34.99 33.26 32.70 38.23
35.13
_, Paddy rice in
dry season 13.24 5.47 11.66 13.96 16.39 17.17 1.91 11.40
Upland rice 0.97 0.64 2.22 1.53 0.67 0.26 6.97 1.89 Direct sowing 4.12 5.97 0.88 0.28 0.11 0.00 6.37 253
3 —Malang and Besuki, 4 —Madura. For the respective groups in the order from Group
1 to Group 4, direct sowing, upland rice and wet season, dry season, upland rice and
direct sowing were shown as the representative cultivation-methods of rice, respectively.
The differences found in the individual prefectures mainly- originated in annual rainfall4)
and in water control systems 3I.
It was noteworthy that 3 figures in Madura, i.e., paddy rice, wet season and dry-season, were found to be very small in comparison with that of the other prefectures. Standard deviations of 5 types found in 7 prefectures were ascertained as 5.70,
5.14, 9.15, 7.98, 15.64 and 5.59 in the order of paddy rice, wet season, dry season, upland
rice, direct sowing and the total. It was noteworthy that the value was particularly-large in direct sowing. Ratios of their standard deviations to the average value (=14.29)
Mem. Kagoshima Univ. Res. Center S. Pac, Vol. 3, No. 2, 1983
Fig. 2. Map showing constitution of East Java. Dotted line ; boundary of
prefectures, roman letter; prefecture name, italic letter; capital of
the respective prefectures
105
c ^
were counted as 0.46, 0.36, 0.64, 0.56, 1.10 and 0.39 in the same order. Owing to 2 items mentioned just above, it may be said that operating practices of direct sowing varied from prefectute to prefecture very much.
2. In column B of Table 3, a figure 37.50 in Surabaya for paddy rice means that its product has a share of 37.50 % of the whole products in the main 12 crop kinds in Surabaya, which were consisted of maize, cassava, sweet potato, peanut, soybean, gram and sorghum in addition to 5 types of rice cultivation. The big 3 kinds of crops were ascertained in the order of Surabaya, Bojonegoro, Madiun, Kediri, Malang, Besuki and Madura prefectures, and the whole East Java as follows ; paddy rice ^> wet season /> dry-season, paddy rice > wet season > maize (7.46%), paddy rice > cassava (25.24 %K> wet season, paddy rice ^> wet season ^> cassava (22.34%), paddy rice/> wet season ^> cassava (21.63%), paddy rice > wet season > cassava (9.78%), cassava (46.62 %)> maize (15.76
%)~y paddy rice, paddy rice > wet season/> cassava (19.35%). Paddy rice had the first shares except Madura. Cassava had more or less top 3 shares except Surabaya. It was noted that the percentage in the total rice was peculiarly small in Madura (30.34%).
Averages and their standard deviations of 5 types of rice found in 7 prefectures
were ascertained as 32.83 + 8.24, 23.63 + 5.44, 8.36 + 4-30, 0.95 + 0.62, 1.54 + 1.72 and
67.30 + 16.41 in the order of paddy rice, wet season, dry season, upland rice, direct sowing and the total, respectively. Ratios of their standard deviations to the average values were counted as 0.25, 0.23, 0.51, 0.65, 1.12 and 0.24 in the same order, respectively. They were divided into 3 groups in accordance with the stabilities in the respective pre fectures, i.e., stable (paddy rice, wet season and the total), medium (dry season and upland
rice) and flexible (direct sowing).
3. In column C of Table 3, a figure 49.52 in Surabaya for paddy rice means that its product has a share of 49.52 % of the whole products in 5 types of rice. Remarkable differences were not found in 2 columns, i.e., paddy rice and wet season. The individual data were compared with average values in the whole East Java. In Surabaya, for example, percentages were found as 13.24, 0.97 and 4.12 in dry season, upland rice and direct sowing, respectively. Those in the whole East Java were found as 11.40, 1.89 and 2.53 in the same order, respectively. So, Surabaya was finally illustrated as LSL in combinations of dry season, upland rice and direct sowing. In this sense, 7 prefectures were divided into 4 groups, i.e., LSL (Surabaya and Bojonegoro), LLS (Madiun), LSS (Kediri, Malang and Besuki), SLL (Madura). These differences may partly be due to the
Table 4. Shares of rice productions in 4 districts of Madura Island, illustrated by-shares (%) of the indivudual rice productions —A to the whole Madura Island, B to the whole products of 12 main crops, C to the whole rice
products. Direct sowing means direct sowing culture of paddy rice in
well-drained paddy field.
Pamekasan Bangkalan Sampang Sumenep Whole
Madura Paddy rice 11.85 30.33 30.99 26.84 100.00 Paddy rice in wet season 7.77 33.75 26.90 31.58 100.00 A Paddy rice in dry season 7.42 44.06 29.22 19.33 100.00 Upland rice 40.99 11.52 38.86 8.63 100.00 Direct sowing 37.64 5.65 56.06 0.65 100.00 Total 13.88 29.02 31.53 25.57 100.00 Paddy rice 14.57 19.07 11.87 12.95 14.11 Paddy rice in wet season 7.86 17.45 8.47 12.52 11.60 B Paddy rice in dry season 0.38 1.14 0.46 0.38 0.58 Upland rice 7.56 1.09 2.23 0.62 2.12 Direct sowing 6.34 0.49 2.94 0.04 1.93 Total 36.71 39.24 25.97 30.67 30.34 Paddy rice 39.70 48.62 45.70 48.82 46.51 Paddy rice in wet season 21.42 44.47 32.61 47.22 38.23 C Paddy rice in dry season 1.02 2.91 1.77 1.44 1.91 Upland rice 20.59 2.77 8.59 2.35 6.97 Direct sowing 17.26 1.24 11.32 0.16 6.37
Mem. Kagoshima Univ. Res. Center S. Pac, Vol. 3, No. 2, 1983 107
respective background of water management status.
Averages and their standard deviations of 5 types found in 7 prefectures were
found as 49.05 + 1.08, 35.13 + 2.36, 11.40 ± 5.26, 1.89 ± 2,16 and 2.53 ± 2.65 in the
order of paddy rice, wet season, dry season, upland rice and direct sowing, respectively. Ratios of their standard deviations to the average values were counted as 0.02, 0.07, 0.46, 1.14 and 1.05 in the same order, respectively. They were divided into 3 groups in accordance with the stabilities in the respective prefectures, i.e., stable (paddy rice and wet season), medium (dry season) and flexible (upland rice and direct sowing).
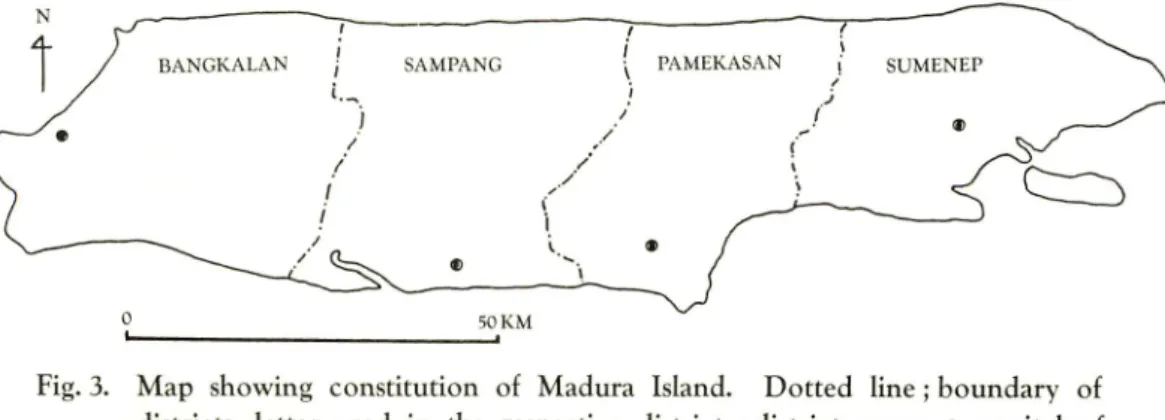
4. In Table 4, productivities of 5 types in the whole Madura were analysed, and are shown in percentages, in which 5 types of rice were quite the same as that of Table 3. Madura Island is constituted by 4 districts as shown in Fig. 3. In column A of Table 4, a figure 11.85 in Pamekasan for paddy rice means that its product (26,765 ton) in Pamekasan has a share of 11.85% of the whole products (225,926 ton) in the whole Madura. There was no remarkable difference in 4 districts in view of the respective shares. Products of paddy rice in Pamekasan and Bangkalan were found as smaller and larger than the average found in the whole Madura, and illustrated as S and L, respec tively. Products of paddy rice was finally shown as SLLL in the order of Pamekasan, Bangkalan, Sampang and Sumenep. In this sense, paddy rice, wet season, dry season, upland rice and direct sowing and the total were illustrated as SLLL, SLLL, SLLS, LSLS,
LSLS and SLLL, respectively. So, they were divided into 3 groups, i.e., SLLL (paddy
rice, wet season and the total), SLLS (dry season), and LSLS (upland rice and direct sowing). In the total, rice productions were took charges of a portion nearly equally.
Standard deviations of 5 types found in 4 districts were ascertained as 7.76, 10.25, 13.44, 14.98, 22.87 and 6.76 in the order of paddy rice, wet season, dry season, upland
rice, direct sowing and the total, respectively. It was noteworthy that the value was peculiarly large in direct sowing. Ratios of their standard deviations to the average value (= 25.00) were counted as 0.31, 0.41, 0.54, 0.60, 0.92 and 0.27 in the same order,
respectively. Owing to 2 items mentioned just above, it may be said that operating practices of direct sowing varied from district to district very much.
5. In column B of Table 4, a figure 14.57 in Pamekasan for paddy rice means
that its product has a share of 14.57 % of the whole products in the 12 crop kinds in Pamekasan, which were constituted of maize, cassava, sweet potato, peanut, soybean,
Fig. 3. Map showing constitution of Madura Island. Dotted line ; boundary of
districts, letter used in the respective districts; district name, ©; capital of
gram and sorghum in addition to 5 types of rice cultivation. The big 3 kinds of crops
were ascertained in the order of Pamekasan, Bangkalan, Sampang and Sumenep and the whole Madura as follows; cassava (4431 %)> maize (16.56 %)> paddy rice, cassava
(30.87 %)> maize (21.12 %)> paddy rice, cassava (50.36 %)> sweet potato (9.94 %)> paddy rice, cassava (43.36 %)> maize (23.43 %)> wet season, cassava (46.62 %)> maize (15.76 %)> paddy rice. Paddy rice had only the second or the third portions. Wet season had only the third portion in 1 district. Cassava had the first portion in the
whole districts. The whole districts showed nearly the same values in the whole crop
kinds.
Averages and their standard deviations of 5 types found in 4 districts were ascer tained as 14.62 + 2.75, 11.58 + 3.84, 0.59 + 0.32, 2.88 + 2.77, 2.45+2.50 and 33.15 +
5.18 in the order of paddy rice, wet season, dry season, upland rice, direct sowing and
the total, respectively. Ratios of their standard deviations to the average values were counted as 0.19, 0.33, 0.54, 0.96, 1.02 and 0.16 in the same order, respectively. They were divided into 3 groups in accordance with the stabilities in the respective districts, i.e., stable (paddy rice and the total), medium (dry season and wet season) and flexible (upland rice and direct sowing).
6. In column C of Table 4, a figure 39.70 in Pamekasan for paddy rice means that its product has a share of 39.70% of the whole products in 5 types of rice culti vations. The individual data were compared with average values in the whole Madura. In paddy rice, for example, percentages were found as 39.70, 48.62, 45.70 and 48.82 in Pamekasan, Bangkalan, Sampang and Sumenep, respectively. Average value in the whole Madura was found as 46.51. So, paddy rice was finally illustrated as SLSL in
Table 5. Yearly fluctuations during 1963 to 1979 of 6 crop productions in Sumenep
Paddy rice Upland rice Maize
ha ton ton/ha ha ton ton/ha ha t o n ton/ha
1963 14,232 24,935 1.75 1,356 2,591 1.91 114,752 67,223 0.59 1964 15,533 57,365 3.69 1,104 1,314 1.19 173,534 89,871 0.52 1965 16,267 54,192 3.33 1,257 2,307 1.84 115,535 50,894 0.44 1966 13,057 36,576 2.80 1,105 2,262 2.05 132,029 86,313 0.65 1967 14,479 46,902 3.24 1,464 2,543 1.74 149,193 47,912 0.32 1968 15,589 57,216 3.67 1,495 2,566 1.72 151,950 63,700 0.42 1969 14,870 42,529 2.86 1,041 1,778 1.71 133,609 68,948 0.52 1970 13,477 35,592 2.64 1,356 1,738 1.28 120,981 54,983 0.45 1971 16,977 50,000 2.95 1,547 2,850 1.84 133,574 65,012 0.49 1972 16,882 58,126 3.44 2,749 5,451 1.98 129,592 65,812 0.51 1973 13,978 29,762 2.13 1,947 3,710 1.91 135,382 64,816 0.48 1974 17,448 54,930 3.15 1,402 1,124 0.80 134,310 63,925 0.48 1975 18,329 45,914 2.50 1,655 1,901 1.15 120,284 75,612 0.63 1976 16,535 37,789 2.29 1,365 2,307 1.69 98,962 63,796 0.64 1977 17,281 55,016 3.18 1,108 2,433 2.20 115,928 65,431 0.56 1978 18,355 75,606 4.12 1,300 3,620 2.78 137,749 90,658 0.66 1979 17,863 68,397 3.83 1,457 3,149 2.16 118,048 86,312 0.73
Mem. Kagoshima Univ. Res. Center S.Pac, Vol.3, No. 2, 1983 109
the combinations of Pamekasan, Bangkalan, Sampang and Sumenep. In this sense, 5
types were divided into 3 groups, i.e., SLLS (paddy rice and dry season), SLSL (wet
season), LSLS (upland rice and direct sowing), in which L and S means that the values
were larger and smaller than that of the averages, respectively, in the order from
Pamekasan, Bangkalan, Sampang and Sumenep combinations.
Averages and their standard deviations of 5 types found in 4 districts were ascertained
as 45.71 + 3.68, 36.43 + 10.26, 1.79 + 0.70, 8.58 + 7.36 and 7.50 ± 7.12 in the order of
paddy rice, wet season, dry season, upland rice and direct sowing, respectively. Ratios
of their standard deviations to the average values were counted as 0.08, 0.28, 0.39, 0.86
and 0.95 in the same order, respectively. They were divided into 3 groups in accordance
with the stabilities in the respective districts, i.e., stable (paddy rice), medium (wet
season and dry season) and flexible (upland rice and direct sowing).
7. Annual fluctuations of paddy rice and uplant rice in Sumenep, a eastern district
of Madura, during 1963 to 1979 were calculated in ha, ton and ton/ha, and are shown
in Table 5. In addition to these, that of maize, cassava, sweet potato and peanut are
also shown for comparison with rice cultivations. According to this table, it was ascer
tained that the all crop kinds showed remarkable annual fluctuations in ha, ton and
ton/ha.
To make clear the complex relationships in Table 5, the ratios of the maximum to
the minimum values during the years were calculated, and are shown in column A of
Table 6 in ha, ton and ton/ha. Averages and their standard deviations found during
17 years were calculated, and are shown in column B of Table 6. In addition to these
2 methods, the ratios of standard deviations to their average values were calculated,
Cassava Sweet potato Peanut
ha ton ton/ha ha ton ton/ha ha t o n ton/ha
31,910 277,180 7.12 2,254 8,246 3.66 5,927 3,455 0.58 31,635 267,018 8.45 4,509 16,181 3.59 7,655 2,731 0.36 41,640 396,829 9.53 2,962 10,575 3.57 6,135 2,774 0.45 33,493 326,883 9.76 3,309 14,218 4.30 7,427 3,512 0.47 13,246 108,137 8.16 3,405 11,360 3.34 3,577 3,177 0.89 33,623 244,165 7.26 2,858 12,449 4.36 4,096 - -30,008 214,966 7.16 2,324 8,750 3.77 5,052 - -35,387 160,042 4.52 2,075 6,230 3.00 3,811 - -36,450 205,124 5.63 3,289 9,005 2.74 8,155 4,052 0.50 36,450 187,897 5.15 2,070 5,085 2.46 9,571 4,150 0.43 33,851 168,561 4.98 1,978 5,538 2.80 10,933 4,499 0.41 28,263 148,060 5.24 1,651 4,270 2.59 9,639 4,070 0.42 26,807 131,875 4.92 1,566 3,598 2.30 9,256 3,383 0.37 25,000 99,670 3.99 884 3,393 3.84 7,153 3,152 0.44 26,050 155,765 5.98 2,030 4,269 2.10 13,522 6,299 0.47 32,880 182,290 5.54 1,342 4,609 3.43 8,391 3,605 0.43 27,193 167,854 6.17 753 4,593 6.10 6,683 2,981 0.45
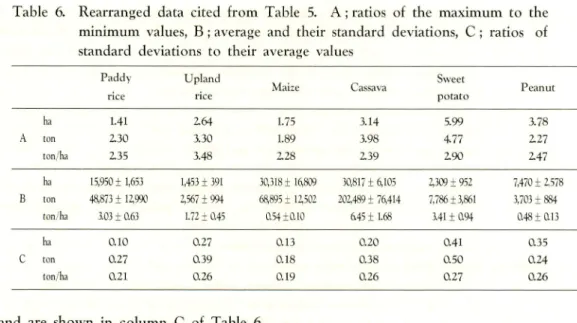
Table 6. Rearranged data cited from Table 5. A ; ratios of the maximum to the
minimum values, B ; average and their standard deviations, C ; ratios of
standard deviations to their average values Paddy
rice
Upland
rice
Maize Cassava Sweet potato Peanut ha 1.41 264 1.75 3.14 5.99 3.78 A ton 230 3.30 1.89 3.98 4.77 227 ton/ha 235 3.48 228 239 290 247 ha 15,950 ± 1,653 1,453 ± 391 30,318 ± 16,809 30,81716,105 2,309± 952 7,470± 2.578 B ton 48,873 + 12990 2,567 + 994 68,895 ± 12,502 202489 ± 76414 7,78613,861 3,703± 884 ton/ha 3.03 ± 0.63 1.72 ± 045 0.54 ±0.10 645 ± 1.68 3.41 ± Q94 048+013 ha 0.10 0.27 0.13 0.20 0.41 0.35 C ton 0.27 0.39 018 0.38 0.50 0.24 ton/ha 0.21 0.26 0.19 0.26 0.27 0.26
and are shown in column C of Table 6.
The following facts can be seen from the data obtained in Tables 5 and 6. Paddy rice and maize are constantly cultivated in comparison with other crop kinds, and showed relatively small fluctuations. In other words, farmers attached importance to paddy rice and maize. On the other hand, upland rice showed relatively large fluctu ations. In other words, upland rice was strongly influenced by several environmental conditions, especially rainfall in the respective periods. Sweet potato showed the largest
fluctuations of the 6 crop kinds compared. Similar tendencies were ascertained also in
ton and ton/ha. Owing to these facts, farmers placed dependence primarily upon paddy rice and maize for a long time.
It does not necessarily follow that the patterns of annual fluctuations of the re spective crop kinds change in the same way. However, it can be said that fluctuation with the passage of time and year of paddy rice were similar to some extent in Bang kalan and Sumenep, Pamekasan and Sampang.
3. Extensive considerations on rice cultivations
For discussion of rice cultivation in these areas, the following categories were adopted, using the data obtained from observations and hearings, i.e., problems of strains used and changes of them, soil and topographical features, reclamation, mixed strains, irrigation status, shifting to other crop kinds and relation between rice and fish
cultures.
1. It is said that varieties cultivated in Indonesia are considered to be the advanced
ones at the present. However, it was noticed that the strains showing 4 red and 1 black grains were collected during the trip (Table 1). Though these strains are not dominant varieties in the whole of Indonesia in comparison with the white grains, they are carefully and consistently kept by the farmers, and used for boiled rice, alcoholic drinks, confectionery. It is said, sometimes, that the qualities of red and black grains are better than that of the white grains. So, it may be concluded that the cultivation of these strains is a local tradition carried down from generation to generation. In other words, it is intelligence of domestic science.
Mem. Kagoshima Univ. Res. Center S. Pac, Vol. 3, No. 2, 1983 111
There is every indication that several primitive varieties are switched to so-called "advanced varieties" or "high yielding varieties" in the world. A green revolution was promoted by the governments designated as BIMAS in Indonesia11'. These changes being several serious problems to the areas. Firstly, though skillful programs of agricul tural practices had been established to avoid serious periods of short supply or off-crop seasons of several primitive varieties, these schemes were broken down by the recent varieties) because of differences of growing habitat and period. Secondly, ear plucking by ANI-ANI or PUGUT became difficult, because advanced varieties, for example, IR32, IR36 introduced from the Philippines in 1978 to 1980, had a tendency of shorter culms than that of the primitive varieties, for example, GAJJUK, TARKONEN, CEMPA, PURU, TAKAN, PERITA, BENGAWAN. If these tools were used for advanced varieties, harvesting procedure may be bad for the farmer's health, for example, crick in the back. Thirdly, partially owing to the second reason, grades of productivity or soil fertility made the matter still worse, because' residues including straw were eaten by cattle after harvesting ears, and their excrements were restored to the soil in the previous type, but residues were permanently in danger of being taken away. Fourthly, there are economic obstacles to the changing of strains. To keep the sufficient growth and harvest, cultivating practices are requested for preparing fertilizer, insecticides, fungicides, herbicides, adequate water control, and cautious management. To establish these schemes, the author would like to emphasize the necessity for exhaustive training and subsidy to the farmers by the government.
Fifthly, the people are fonded of the taste of the local varieties than that of the advanced varieties. Farmers planted advanced varieties in large areas for sale and local varieties in small scale for themselves. So, consumers could not get good rice for
taste.
It was concluded that rice strains were extensively changed to some grade by the green revolution. Though the major strains were clearly changed, the minor strains were not changed and but firmly remained. In other words, there is every indication not only in Indonesia, but also in the world that farmers were against it, whatever others may say.
2. Rice cultivations will be discussed in relation to soil and topographical features. Rice plants were cultivated not only in mature fields but also in poor localities, grow
ing sporadically, in heavy swampy area (for example, Terenggi), waste land (Kalanget),
sandy land (Ambunten), lower edge of sandy slope (Jatirogo), and others. They were looked upon as "cultivating status" in everywhere. It was noticeable that paddy rice was cultivated also in the dry land, in which upland rice was fundamentally used in several places of southeast and south Asian countries. It may be concluded that paddy rice was looked upon as a very important crop kind much more in East Java than
other Asian countries.
In semi-waste land having readjustment of arable land near it, selection of varieties
was done in accordance with land conditions as follows (near Socah); road—* waste land
(not planted)—> semi-waste or swampy land (local varieties)^ readjustment (advanced
varieties). In these cases, local varieties were found on the road side but not found in
central areas. In other words, farmers suit varieties to each place owing their re
spective suitabilities.
BEAUV.) grass, or not planted, was reclaimed as arable lands by the constant efforts of
farmers and/or the government. It was noteworthy as a good reclamation-techniques
that the broad waste lands east of Kwanyar were regenerated as arable land. This land had been looked upon as unproductive area in the past, but was changed into arable land. It was dug in and systematically heaped up in some sections. The lower parts have about 80 cm depth in average under the upper parts and were used as paddy
field, and the upper parts were used as upland field. Now, these areas consist of broad
paddy field with rectangular upland field.
Rice in the lower parts showed considerable harvest. Shallow or semi-shallow water varieties were used in these areas. Upper parts were protected surrounding paddy field and water, in which banana, cassava, pepper, sweet potato were cultivated and
showed also considerable harvest.
Waste land near Babat was lacking irrigation water. But, soil was dug out here for making bricks, and naturally it became a rain water tank. It finally became a rainfed
paddy field.
Slopes showing more than an 8 degree angle of inclination have a tendency to be reclaimed as agricultural land in everywhere in East Java. In these cases, the slopes were cut and changed to terraces. These areas were used at first as a grazing land for
catties or goats, and then as upland field for crops such as peanut or gram, then for
upland rice, and finally as paddy field.
4. Mixed varieties of several types were found in many locations. This system has a long history, in these areas, and has both merits and demerits. As for the merits, some varieties of rice can complete their life cycle, even when some insects or pests occurred seriously or when water conditions were inadequate for growing rice plants. In Terenggi near TAMBAK, 6 varieties including red grains (Nos. 8-13 in Table 1) were collected at the same paddy field in heavy swampy areas. As for the demerits, troublesome procedures were necessary to control insect, pest or weed and in harvesting. Products were mixed several types for marketing procedures. Farmers mixed them with full knowledge about the merits and demerits.
5. In view of the average pattern of rainfall during a year, it is said to be possible
to cultivate several crop kinds during a year4). However, continuous non-rainfall days
are worthy of attention, because they fundamentally affect agricultural practices, especially rice cultivation, and are recorded as frequently occurring in these areas. Irrigation
systems may work out a solution to these problems5). Hydrographic settlement has a
long history in these areas (for example, Lenteng, Ambunten), and are under construction
in several places at the present (for example, Kedungdung). These settlements have
been pushed forward by the government, because products of rice were, in general, recorded as 4-6 ton/ha and 2-3 ton/ha in irrigated and non-irrigated areas, respectively. Adequate dam systems were found at Lenteng, Ambunten and Bangkalan. The Lenteng dam was used for system both as agricultural and domestic supply. The Ambunten dam is a reservoir to which water is pumped up and stocked. The last one is on a large scale and has a long history. The irrigation system planned in Kedungdung was aimed at having capacity for 2,000 ha and at making possible double paddy cul tivation in a year under a 5 year program. However, irrigation systems found at the present were looked upon as not able to fulfil their function and were connected imperfectly with one another. Indeed, overflow water was seen in several places, for
Mem.Kagoshima Univ. Res. Center S.Pac, Vol. 3, No. 2, 1983 113
example, Pakoon, Sampang, and others, though agricultural lands near these places
had not effective and sufficient water for cultivation. Moreover, irrigation canals burst
with strong rainfall, and became muddy streams talking away neighbouring soils.
Even in un-irrigated areas and only rainfed areas, upland rice was cultivated, in
general, in the areas having more than 1,000 mm rainfall in a year, as"l-crop 1-year"
system.
In areas having no irrigation systems, small ponds had a very important role for
cultivation, and were found in several localities, especially slope or mountain areas. In
Bungah, many ponds were located around paddy fields. In Waru, they were connected
with one another and became adequate reservoirs.
Sometimes, a place used for a
nursery bed at first became a small pond after transplantation of rice. In these cases,
a nursery bed had been created beforehand on level lower than the neighbouring
places.
In areas having no irrigation systems and no ponds, draw-well or a cistern was
adopted for the cultivation of rice and other crops. The side wall of the well is built
up by bricks or only plastered by mud.
6. Rice cultivation suffered some change in some areas at the present, in which
paddy field changed to tobacco or sugarcane plantations, and the agricultural systems
showed some degree of economic transformation.
7. Rice cultivation in south and southeast Asian countries is often connected with
fish culture. Indonesia is no exception. The fish pond system is called TAMBAK. Areas cultivating rice and fish are called SAWAH TAMBAK as a general term. A
sample was found near Lamongan, in which rice was cultivated in a central portion
enclosed by vinyl sheet for protection from rats. Milkfish was cultured in the sur
roundings. The variety having white grain indica was used here. These were found
in several localities, Le., Sidiya, Bungah, and others.
Three types of rice and fish double cultivation were found at a place 9 km west
from Babat, altogether 26 ha. One type was nearly the same as that of Lamongan but
without a vinyl sheet.
The central portion cultivating rice was constructed higher
than the surrounding areas cultivating milkfish, and about 70 cm lower on average
than an embankment where water convolvulus called KANGKUNG was growing. The
second type was called MINA PADI, where surrounding areas were not clearly distin
guished, and had only rice cultivation.
In these area, fish culture was not separated
from rice, and fish such as a carp (Babat) or an eel (Pepanjen) lived together with the
rice. This type was found in several places such as Kertosono, and is said to be a
popular type in south and southeast Asian countries.
The third type is a separated
type called SAWAH and TAMBAK, where rice and fish are cultivated side by side.
Several conditions are necessary for these types, i) Depths of water from 50 cm to
110 cm were measured, ii) Shallow water types of indica variety were looked upon as suitable for these conditions, iii) To avoid flood damage, it was seen as impossible to set SAWAH TAMBAK in an area, where the water level is much lower than river level,
iv) SAWAH TAMBAK located at 10km west from Gresik was operated on one side and but not on the another side. Insufficient water supply may the cause of this
Summary
During the period from June to July in 1981, the writer was sent to Indonesia for
research on agricultural practices.
The conditions of rice cultivation in East Java, es
pecially in Madura Island, are briefly reported in this paper in 3 parts, i. e., morpholog
ical characteristics of rice grain, statistical data and rice cultivation methods. The
findings are summarized as follows :
Morphological characteristics: Twenty-nine strains collected were divided into two
groups, i.e., B type (10.3%) and C type (89.7%). It was noticeable that strains showing
4 red and 1 black grains were found. Though these strains are not the dominant ones
in the whole Indonesia in comparison with the white grains, they are carefully and
consistently kept by the farmers.
This is one of the reservation of history.
Average values of length, ratios of length to width and of length to thickness of
East Java were ascertained as larger than that of the whole of Indonesia. Materials
collected at SAWAH TAMBAK showed the very large intra-population's variations.
Statistical aspects: Seven prefectures in East Java were divided into 4 groups based
on the cropping systems. Upland and direct sowing methods were seen as representative
of Madura prefecture, and rice products had the first share of 12 main crop kinds in
6 prefectures except Madura.
There were no fine differences in total rice products
between the 4 districts of Madura.
However, direct sowing had a larger portion in
Sampang district than for the whole of Madura.In view of the annual fluctuations during 1963 to 1979, paddy rice and maize were
said to be constantly cultivated in comparison with other crops, and showed relatively
small variations. In other words, farmers attached importance to paddy rice and maize.
Considerations: Discussions were extensively made on rice cultivation from the view point of alternation of strains, soil and topographical features, reclamations, mixed
strains, irrigation systems, change of crop and the relation of rice and fish cultures.
Five serious problmes connected with the change from primitive to advanced strains
were extensively discussed.
Though the major strains were clearly changed by the
green revolution, the minor strains were not changed but were firmly reserved.
It was noteworthy as a reclamation-technique that waste land near Kwanyar was regenerated into arable land, and rice and upland crops were cultivated in lower and upper sections. Hydrographic settlements have a long history in these areas and are
under construction in many places.
Moreover, in areas having no irrigation systems,
small ponds had a very important role for the cultivation not only of rice but also of
several upland crop kinds.
Rice cultivation is a often connected with fish culture, and there were 3 main types of combinations. In these areas, some of the characteristics of rice varieties and of techniques were ascertained.
References
1) Biro Pusat STATISTIK, 1968, 1969: Statistical pocketbook of Indonesia, Jakarta. 2) BIRO PUSAT STATISTIK, 1980:Diperta tanaman daerah prop data I, Jawa Timur,
Mem. Kagoshima Univ. Res. Center S. Pac, Vol. 3, No. 2, 1983 115
Surabaya.
3) CANTOR, L. M., 1970: A world geography of irrigation. Oliver and Boyd.
4) Division of Ecology, Department of Plant Physiology, 1973:Agro-Clima
tology No. 1, No. 2.
A compilation of climatological data, 1972, 1973.
Cent. Res. Inst. Agr., Bogor, Indonesia.
5) FUKUDA, H., 1980: Irrigation in the world (in Japanese).
Tokyo Univ. Publ.,
Tokyo.6) IDAIKKADAR, N. M., 1972: Crop statistics for Indonesia, 1955-1970, Bogor, Indo
nesia.
7) ISMUNADJI, M., ZULKARNAINI, I. and MlYAKE, M., 1975: Sulphur deficiency in
lowland rice in Java. Contr. Res. Inst. Agr., Bogor, 14, 1-17.
8) KATAYAMA, T. C, 1976:Grain morphology of cultivated rice, "Perita", in Ambon,
Indonesia. Mem. Fac. Agr. Kagoshima Univ., 12, 41-45.
9) MATSUO, T., 1952: Genecological studies on the cultivated rice (in Japanese with
English Summary). Nat. Inst. Agr. Sci. Series D 3, 1-111.
10) NAKAGAMA, A., 1977:Some morphological characters of cultivated rice in Indo
nesia (1). Mem. Fac. Agr. Kagoshima Univ., 13, 35-54.