権利
Copyrights 日本貿易振興機構(ジェトロ)アジア
経済研究所 / Institute of Developing
Economies, Japan External Trade Organization
(IDE-JETRO) http://www.ide.go.jp
シリーズタイトル(英
)
Occasional Papers Series
シリーズ番号
41
journal or
publication title
Electoral Volatility in Turkey - Cleavages vs.
the Economy
page range
27-38
year
2007
3
Conceptualization and Methodology
The two preceding chapters, which reviewed the literature on electoral change both in general and in Turkey, revealed that (1) in general, social cleavages and values ac-counted for long-term volatility, and retrospective voting for short-term volatility, and that (2) in Turkey, the dominant framework is broadly socioeconomic, and few studies have explicitly used the social-cleavage, values, or retrospective-voting approach. There is a need to fill this theoretical and empirical void in these areas of research in Turkey. Accordingly, this study adopted the social-cleavage and retrospective-voting approaches.
This chapter explains the framework of the study, the dependent and independent variables, the main hypotheses, the analytical method, and the data sources. In brief, the study uses statistical analysis to investigate, at the provincial and national levels, how social cleavages and economic change affect electoral volatility in Turkey. The object of the study is not individual voters but rather groups of voters that share a socioeconomic environment.
3.1. Framework of the Study
The primary aim of this study is to understand the nature of the dependent variable (electoral volatility) and its relationship with social cleavages and economic change. Relevant hypotheses are tested over time and space using time-series (1950–2002) and cross-sectional (1961–2002) analyses. The unit of analysis varies from the whole nation to the province.1 The difference in time span between the time-series and cross-sectional analyses is due to the paucity of cross-cross-sectional data for the pre-1961 period. The basic advantage of treating a collectivity of individuals as the unit of analysis lies in the fact that behavioral outcomes include social interactions in a shared cultural
and geographical environment. As pointed out by Agnew (1989), place is where individuals with various socioeconomic variables interact before making their own decisions. In the case of the Kurds in Turkey, for instance, it is the feudalistic social structure of southeastern Turkey, rather than Kurdish ethnicity per se, that led to high electoral volatility among voters in the pre-1980 period.2 This study thus analyzes the
combined effect of sociopolitical variables attributed to individuals and interactions
between such variables.
3.2. Dependent Variable: Electoral Volatility
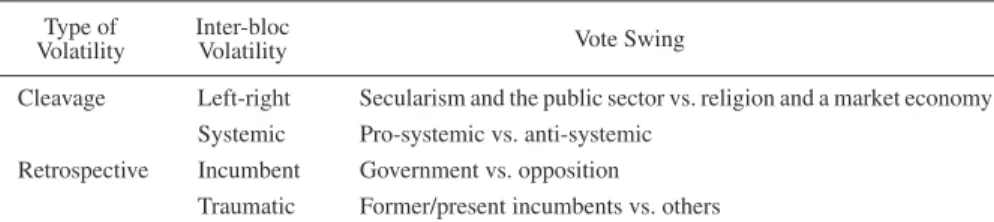
The dependent variable of this study, electoral volatility (total electoral volatility), is defined as the sum of absolute differences in the party vote percentage between two consecutive elections, divided by two.3 Although total electoral volatility indicates the level of party system instability in general, it does not specify what constitutes the instability. In fact, various combinations of vote swings represent different dimen-sions of electoral volatility in the aggregate.4 Bartolini and Mair (1990, chap. 1) divided total electoral volatility into inter-bloc volatility and within-bloc volatility.5 For them, the term “bloc” referred to either the parties of the left or the right. How-ever, as they pointed out, the concept of “bloc” does not have to be confined to the left-right dimension. This study expands the concept to analyze four inter-bloc volatilities (Table 3-1). The first two, which reflect cleavage structures (cleavage-type volatili-ties), are left-right volatility and systemic volatility. The other two, which reflect voters’ retrospective evaluation of government performance (retrospective-type vola-tilities), are incumbent volatility and traumatic volatility.
Left-right volatility consists of absolute net vote swings between the votes for the
left- and the right-wing parties. It is calculated as the absolute sum of differences in the vote percentage for the parties in the left (or right) bloc between two consecutive elections. In Turkey, left-wing parties are more secular and more supportive of the state’s role in the economy than are their right-wing counterparts (Mango 1991, pp. 171–79).6 Right-wing parties are more religious and more supportive of the free market.7 (For the classification of political parties in Turkey, see Appendix I and Appendix II). It is not only in Turkey that religiosity is a major defining element of the
TABLE 3-1 INTER-BLOC VOLATILITIES DEFINED
Type of Inter-bloc Vote Swing
Volatility Volatility
Cleavage Left-right Secularism and the public sector vs. religion and a market economy Systemic Pro-systemic vs. anti-systemic
Retrospective Incumbent Government vs. opposition
Traumatic Former/present incumbents vs. others Source: Compiled by the author.
left-right dimension. Empirical findings have shown that religiosity was a stronger determinant than social class of issue positions (economic and noneconomic) on the left-right scale (Inglehart 1984, pp. 53–57; Lijphart 1979).
Systemic volatility is comprised of absolute net vote swings between the
pro-systemic parties and potentially anti-pro-systemic parties. Potentially anti-pro-systemic par-ties in Turkey include pro-Islamic, nationalistic, and pro-Kurdish parpar-ties. Since all these parties proclaim abidance of the law, their anti-systemic nature is only potential.
Incumbent volatility is expressed as absolute net vote swings between the
govern-ing party/parties and the opposition parties. Governgovern-ing parties are defined here as those that participated, for more than one year, in the final government before a general election.
Traumatic volatility is represented by absolute net vote swings between the parties
that have at any time remained in government for more than one year consecutively, and those that have not.
As shown by the above definitions, cleavage-type volatilities and retrospective-type volatilities are qualitatively different in terms of the criteria of voters for their party choice. Cleavage-type volatilities seem to be associated with attempts by voters to find parties that better represent their social grouping, while retrospective-type volatilities are influenced by voter evaluations of the past performance of the incumbent(s) (and former incumbents). The two types of inter-bloc volatilities there-fore require separate analytical settings and different independent variables.
Figure 3-1 shows that cleavage-type volatilities (CVs) were nearly as strong as
0 5 10 15 20 25 30 35 40 45 1965 ’69 ’73 ’77 ’91 ’95 ’99 2002 CV: Left-right CV: Systemic RV: Incumbent RV: Traumatic
Source: Compiled by the author from Appendix III and Appendix IV. Notes: 1. Four types of inter-bloc volatilities overlap each other in one way or
another.
2. CV= cleavage-type volatility, RV = retrospectivetype volatility. Fig. 3-1. Inter-bloc Volatilities, 1965–2002
retrospective-type volatilities (RVs) during the pre-1980 period. During the post-1980 period, however, cleavage-type volatilities became far less significant than retrospec-tive-type volatilities. Total electoral volatility was more reflective of retrospective-type than cleavage-retrospective-type volatilities during the post-1980 period than during the pre-1980 period. Although cleavage-type volatilities (left-right and systemic volatilities) seem to have grown in the 1990s in absolute terms, this increase came from the expanding overlap between cleavage-type and retrospective-type volatilities. When the overlap was controlled for, cleavage-type volatilities turned out to be smaller during the post-1980 period than during the pre-1980 period (Figure 3-2).8
One should be careful therefore not to treat total electoral volatility as the depen-dent variable. Since cleavage-type and retrospective-type volatilities are subject to different kinds of mechanisms, and as their rise and decline are not significantly associated if the overlaps are controlled for, it would be more meaningful to sepa-rately analyze two groups of dependent variables—cleavage-type volatilities (Chap-ter 6 and Chap(Chap-ter 7) and retrospective-type volatilities (Chap(Chap-ter 8 and Chap(Chap-ter 9).
Source: Compiled by the author from Appendix III and Appendix IV. Note: The volatility index (CVI) measured composite cleavage-type volatility, with composite retrospective-cleavage-type volatility controlled for. The CVI was calculated as the difference between (1) the mean between left-right and systemic volatilities and (2) the overlap between the mean be-tween left-right and systemic volatilities, and the mean bebe-tween incumbent and traumatic volatilities divided by two. The overlap was calculated as the difference between (1) the sum of the mean between left-right and systemic volatilities, and the mean between incumbent and traumatic volatilities and (2) total electoral volatility.
The retrospective-volatility index (RVI) measured composite retrospec-tive-type volatility, with composite cleavage-type volatility controlled for. The RVI was calculated as the difference between (1) the mean between incumbent and traumatic volatilities and (2) the overlap, as defined above, between the mean between left-right and systemic volatilities and the mean between incumbent and traumatic volatilities divided by two.
Fig. 3-2. Cleavage- and Retrospective-Indices of Volatility
0 5 10 15 20 25 30 35 1965 ’69 ’73 ’77 ’91 ’95 ’99 2002 CVI RVI
3.3. Independent Variables: Cleavages and the Economy
For the independent variables in this study, two of the four models of electoral change reviewed in the previous two chapters, i.e., the social cleavage model and the retro-spective voting model, were chosen. Party identification was discarded as an indepen-dent variable not only because of a lack of relevant data at the provincial level. It was also done because party identification has been a controversial independent variable when applied to countries other than the United States.
The value approach was not simply put aside, but was partially integrated into the social-cleavage approach. Values can be conceptually divided into materialism and postmaterialism, but in the actual operationalization of the concept, the difference is blurred. In particular, most existing research includes religiosity within postmaterialist values. While religiosity is definitely not materialist, it is also prematerialist. As shown by Lipset and Rokkan (1967), the secular-religious cleavage preceded the materialistic capital-labor one.9 This ambiguity of operational definitions is under-standable given that the values approach grew from an attempt to revise the conven-tional social cleavage approach. However, such approaches are concerned with how voters’ material and nonmaterial interests are represented by political parties. It seems reasonable here to operationally expand the scope of social cleavages to include both conventional social cleavages and postmaterial values.
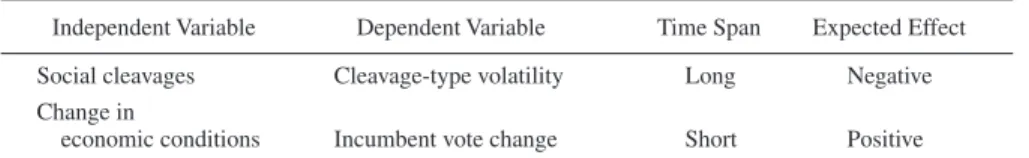
Table 3-2 shows the list of variables used in this study. The first independent variable (the strength of social cleavages in the province) is measured by the demog-raphy of the politically significant societal groups. These societal groups are the pious Sunnis, the Kurds, and the Alevis. A full explanation of the choice and measurement of these variables is given in Section 6.1 of Chapter 6.
Second, the independent variable for the retrospective voting model is the change in economic conditions prior to a general election. Nearly all previous studies on retrospective voting treated economic conditions as short-term variables (measured for at most one year) and demonstrated that voters were sensitive to short-term changes in their well-being when deciding to vote for or against the incumbent(s). Although retrospective voting does not deal with electoral volatility per se, vote losses
TABLE 3-2 LISTOF VARIABLESFOR ANALYSIS
Independent Variable Dependent Variable Time Span Expected Effect Social cleavages Cleavage-type volatility Long Negative Change in
economic conditions Incumbent vote change Short Positive Source: Compiled by the author.
Note: Incumbent vote losses are indicated by minus signs. In contrast, electoral volatility takes a value not less than zero.
for the incumbent(s) account for a substantial part of electoral volatility, especially when the incumbent(s) has (have) served a full term.
3.4. Main Hypotheses
The preceding two sections defined, both conceptually and operationally, the depen-dent and independepen-dent variables. This study uses these variables to test the relation-ships (1) between social cleavages and cleavage-type volatilities using the cross-sectional analysis at the provincial level during the 1961–2002 period and (2) between change in economic conditions and incumbent vote change using both the time-series analysis during the 1950–2002 period and the cross-sectional analysis at the provin-cial level during the 1977–1999 period. Two major hypotheses can be formulated:
Assumption 1: Strong social cleavages stabilize the relationship between cleavage groups and political parties.
Hypothesis 1: Those provinces with stronger social cleavages have smaller cleav-age-type volatilities (left-right and systemic volatilities) than do those with weaker social cleavages.
Assumption 2: Voters punish the incumbent in accordance with the most recent economic performance prior to the election.
Hypothesis 2: The worse the economic conditions prior to the election, the larger the vote losses for the governing party/parties.
Before testing the above hypotheses (in Chapter 6 through Chapter 9), it is neces-sary to show that Turkey can serve as a case for analyzing democracy in developing countries. Chapter 4 and Chapter 5 thus make an exploratory investigation of the nature of electoral democracy and participation in Turkey.
3.5 Methodology and Data
This study uses separate regression analyses to test the effects of (1) social cleavages and (2) economic conditions on electoral volatility over time and space. For the social-cleavage model, the unit of analysis is the province. For the retrospective-voting model, it includes both the nation and the province. Detailed explanations of methodology and data are given at the beginning of the relevant chapters (Sections 6.1 and 6.2 in Chapter 6 and Sections 9.1 through 9.4 in Chapter 9). For the calculations, statistical package programs such as SAS, SPSS, EViews, and STATA were used.
Although this study is not intended to make inferences regarding individual behav-ior from aggregate data (ecological inference), the statistical method used here is identical with that used for ecological inference. Problems with ecological inference have been discussed extensively, especially since Robinson (1950) warned of the ecological fallacy. Leo Goodman later proposed the application of a regression model to the problem of aggregation bias pointed out by Robinson.10 The Goodman model (ecological regression), however, contained a shortcoming in that it assumed constant variance in the error term of the regression, which is not necessarily true in reality
(King 1977, chaps. 3–4). This is a typical problem of heteroscedasticity, which is most commonly found in cross-sectional data. Heteroscedasticity occurs when the variance of the dependent variable for each value of the independent variable is not constant.11
In this study, to cope with the potential problem of heteroscedasticity, power transformations were used,12 when necessary, to reduce the skewness of the distribu-tion of the dependent and independent variables.13 Then, each regression result was checked using the White test (Johnston and Dinardo 1997, pp. 166–67) for any sign of heteroscedasticity.
Parenthetically, the logit transformation was not used for the value of electoral volatility. Although electoral volatility (and its subtypes) can in theory range from 0 to 100 (expressed in percentage), its mean was about 21 for Turkey and its distribution thus did not approximate the logit distribution. In fact, regressions using logit values of electoral volatility showed a worse fit than did regressions using the original values.
This study relied on electoral, socioeconomic, and demographic data at the national and provincial levels. The main source of data is the State Institute of Statistics (SIS).14 Other secondary sources include academic articles and books. See the Appen-dixes for the complete list of data sources.
3.6. A Note on Voter Registration Data
It may be appropriate to discuss the reliability of voter registration in Turkey.15 Permanent voter lists were introduced in 1950, but the voter registration office was not established until the enactment of the Law for Basic Rules of Elections and Voter Registration (Law No. 298, April 26, 1961). Law No. 2234 (May 17, 1979), which amended some articles of Law No. 298, stipulated the renewal of voter registration every four years, although this rule has not been strictly observed.“House confine-ment,” introduced under the same amendment, has been implemented for every voter registration since 1979.16 While these measures seem to contribute to limiting irregu-larities in voter registration, the delay in computerizing the registration process17 makes it difficult to coordinate registration across constituencies, leaving room for some types of irregularities.
In particular, as a result of internal migration on a massive scale, there may be a large number of migrants whose previous voter registrations in their native villages have not been erased. Thus, voters in net-emigrant provinces may be double-regis-tered. If this is the case, then the rate of voter turnout in the net-emigrant constituen-cies will be reported as lower than it actually is. (Voting rates in the net-immigrant constituencies can be considered more accurate, since internal immigrants cannot vote until they are registered there.) This section examines whether the present level of irregularities in voter registration invalidates the previous findings.
According to an official of the Supreme Election Board,18 there are two potential sources of irregularities in voter registration. One is double registrations, and the other
voter transfers. On the first issue, the fact that neither residential nor voter registration has been fully computerized in Turkey allows or results in double registrations. It is not unusual for Turkish citizens, particularly those from rural areas, to intentionally have two or three registered addresses. These citizens have double or triple voter registrations, which are prepared in accordance with their residential registrations. Unintentionally as well, old registrations can remain on the book even after the death or emigration of a voter. The number of un-erased registrations thus increases with each election.
On the second issue, voter transfers between constituencies occur when marginal votes can influence the electoral outcome in a constituency. This can happen in municipal elections, parliamentary by-elections, or general elections for highly com-petitive constituencies. Voter transfers, however, are not very widespread over the country. Thumbprints are taken to prevent voters from voting more than once.
The above information provides some clues for an examination of voter statistics irregularities. First, both sources of irregularities should in theory bloat the number of registered voters. For double registrations, this is obvious by definition. Voter trans-fers or transports (across constituencies by bus) also artificially increase the number of registered voters since these transferred voters have to be registered beforehand in the constituency. Second, the extent of over-registrations should be greater in the less developed provinces than in the more developed ones, because the less developed provinces have a larger net out-migration (to other provinces) than the more devel-oped ones do. Out-migrants can be an important source of unintended irregularities in voter registration, as discussed above.
With these two assumptions, it is possible to measure the extent of irregularities in voter registration by comparing the number of registered voters and the estimated population of voting age calculated from the most recent population census, taken in 1997, prior to the general election in 1999. The most recent years were chosen for analysis since, according to the official cited above, unintended double registrations are accumulating over time, without checks. In the remaining part of this section, two null hypotheses will be tested for the data shown in Table 3-3. If there are rampant irregularities in voter registration, then the following two hypotheses must hold. First, the number of registered voters should be unnaturally close to or even greater than the estimated population of voting age. Second, the rate of registered voters to the esti-mated population of voting age should be higher in the less developed provinces than in the more developed ones.
The data in the table provides, however, no significant signs that the number of registered voters was extensively bloated. First, the voter registration percentage at the national level was estimated as somewhere between 93.3 and 103, according to the following procedure. At the national level, the ratio of registered voters to popula-tion of voting age was 93.3 percent (Table 3-3). The denominator (populapopula-tion of voting age), however, included “privates and corporals serving in the armed services, students in military schools, and detainees and convicts in prisons” (Flanz [2003], p. 77), who are barred from voting under Article 67 of the Constitution.19 The results of the General Population Census do not include the number of such people who have
Population of Re gistered Re gistration Pro vince V oting Age V oters Ratio (A) (B) (B/A) Hakkari 110,497 76,524 0.693 Adıyaman 362,397 271,482 0.749 S¸ırnak 149,477 113,856 0.762 Isparta 312,829 243,330 0.778 Bitlis 150,777 117,367 0.778 Erzincan 176,186 137,695 0.782 Malatya 508,381 405,744 0.798 Mus ¸ 191,079 153,212 0.802 Afyon 493,266 404,132 0.819 S¸ anlıurf a 630,518 518,259 0.822 Mardin 323,774 274,887 0.849 Ko ny a 1,197,725 1,018,792 0.851 Siirt 124,859 106,556 0.853 Kırıkkale 219,724 188,362 0.857 Diyarbakır 636,437 546,722 0.859 Bilecik 136,013 117,881 0.867 Antalya 1,058,790 917,784 0.867 Kütah ya 429,891 375,960 0.875 Bingöl 122,277 107,302 0.878 A %grı 212,639 187,131 0.880 T ekir da %g 416,297 368,061 0.884 Va n 361,570 320,254 0.886 Yo zg at 349,933 310,582 0.888 Kahramanmaras ¸ 557,120 494,971 0.888 Tr abzon 533,716 476,708 0.893 Bayb ur t 54,118 48,815 0.902 Karaman 139,113 125,865 0.905 I . çel 957,910 866,832 0.905 Çankırı 161,538 146,401 0.906 Ankara 2,592,451 2,351,122 0.907 Kars 176,808 161,601 0.914 Population of Re gistered Re gistration Pro vince V oting Age V oters Ratio (A) (B) (B/A) A ydın 614,748 576,630 0.938 Istanb ul 6,524,650 6,134,811 0.940 K ocaeli 792,918 749,026 0.945 Mu %gla 464,123 439,587 0.947 Çanakkale 330,766 314,536 0.951 Eskis ¸ehir 466,686 445,415 0.954 Sıv as 406,190 388,045 0.955 Manisa 831,258 798,578 0.961 Denizli 541,251 520,973 0.963 I . zmir 2,231,374 2,150,970 0.964 Giresun 282,513 272,436 0.964 Bolu 367,119 354,370 0.965 Burdur 173,528 167,583 0.966 Gaziantep 639,449 618,027 0.966 T okat 420,563 407,448 0.969 Ne vs ¸ehir 179,082 174,027 0.972 Us ¸a k 208,663 202,975 0.973 Y alo v a 116,084 113,996 0.982 Elazı %g 316,550 311,507 0.984 Aksaray 204,710 202,248 0.988 I%gdır 79,864 78,998 0.989 Kayseri 599,575 595,291 0.993 Balık esir 730,409 731,515 1.002 Rize 204,904 205,692 1.004 Amasya 223,642 226,314 1.012 Gümüs ¸ane 85,229 86,265 1.012 Karabük 145,011 147,208 1.015 Sakarya 477,795 486,022 1.017 Kilis 60,165 61,359 1.020 Adana 1,029,420 1,056,015 1.026 Ni %gde 191,820 199,260 1.039 T ABLE 3-3 V O TER R EGISTRA TION R A TIO BY P RO VINCE , 1999
T ABLE 3-3 (Contin ued) Population of Re gistered Re gistration Pro vince V oting Age V oters Ratio (A) (B) (B/A) Population of Re gistered Re gistration Pro vince V oting Age V oters R atio (A) (B) (B/A) Erzurum 483,495 442,654 0.916 Hatay 703,415 693,725 0.919 Osmaniye 260,989 239,922 0.919 T unceli 54,349 50,120 0.922 Ordu 498,267 461,818 0.927 Batman 187,553 174,255 0.929 Kırklareli 230,372 214,741 0.932 Bursa 1,382,705 1,289,774 0.933 Edirne 287,033 268,902 0.937 Artvin 118,835 124,440 1.047 Çorum 349,502 369,406 1.057 Kırs ¸ehir 144,003 152,236 1.057 Zonguldak 386,155 410,444 1.063 Ardahan 70,224 75,332 1.073 Samsun 708,490 763,659 1.078 Kastamonu 237,963 257,029 1.080 Sinop 129,444 141,019 1.089 Bartın 117,336 128,327 1.094 Sources:
Calculated and compiled by the author from SIS (2000, 2001).
Notes:
1.
Entries are sho
wn by ascending order of re
gistration ratio.
2.
Population of v
oting age is estimated by the author as the pr
o vincial population of v oting a g e (18 and abo v e) as of 1997,
including those
constitution-ally ineligible to vote (privates and corpor
als serving in the armed services, students in militar
y sc
hools, and detainees and con
victs in prisons)
,
multiplied by the pro
vincial population gro
wth rate for the tw
o years (1997–99).
The ratio of total r
egistered v
oters (37,429,1
20) to the total
popula-tion of v
oting age as defined abo
v
e (40,138,299) w
no right to vote even when they are of voting age. In order to obtain the entire military population, the civilian population (64,062,820)20 was subtracted from the total popu-lation (67,844,903)21 as of 2000. The military population as of 2000 was thus esti-mated to be 5.57 percent of the total population. When this same percentage was applied to the total population as of 1999, the military population was estimated to be 27,258,755, or 9.8 percent of the population of voting age for 1999. (This percentage, 9.8, includes not only privates and corporals but also other higher ranking solders and officers.) The addition of this percentage, 9.8, to the ratio of registered voters (93.9) yields 103.7. This figure suggests that the voters are far from double-registered, given that it includes an unknown percentage of military officers who are eligible to vote and thus should have been discounted from it.22 This result rejected the first hypothesis. Second and more importantly, the rate of registered voters to the estimated popula-tion of voting age was lower in the less developed provinces than in the more devel-oped ones. This result rejected the second hypothesis. In fact, the above-cited official attested that in less developed provinces, the rate of registered voters to the population at voting age was low. He explained that young people in less developed provinces tended to first enter military service and then settle in large cities, like Istanbul, where they made their first voter registration. Since their permanent addresses remained in their native provinces, the rate of voter registration in those provinces tended to be
lower than in the more developed provinces.23 The rate of young people subject to military conscription to the total provincial population is also higher in the less developed provinces. Taken together, these results imply that the lower electoral turnout in the less developed constituencies does not come from irregularities in voting registration.
Note
1 The province is the largest administrative unit of local administration in Turkey. The number of provinces increased from 67 to 81 between 1989 and 2000. When this study dealt with provincial socioeconomic data, the number of provinces analyzed was kept at 67. 2 See Section 6.3 of Chapter 6.
3 See note 2 of Introduction.
4 Total electoral volatility is synonymous with electoral volatility, which is used in more general contexts. Therefore, the term “total electoral volatility” will be used when various dimensions of electoral volatility are discussed.
5 Inter-bloc volatility is calculated as the absolute sum of differences in the vote percentage for the parties in either bloc between two consecutive elections. Inter-bloc volatility thus measures volatility between one bloc of parties and the other. Within-bloc volatility is the residual of inter-bloc volatility in total volatility. Within-bloc volatility, by definition, con-sists of volatility within one bloc and volatility within the other.
6 Mango suggested that the secular-religious divide, while parallel to the one in Europe, might be deeper in Turkey (p. 173). See also Rubin and Heper (2002).
7 Far-right parties, however, are less supportive of a free market economy than are center-right parties.
8 The cleavage-volatility index and the retrospective-volatility index were not statistically
correlated (r= 0.137, p = 0.746). Although the small sample size (N = 8) is one reason for
the statistical insignificance, the correlation coefficient is still too low to argue that the two volatilities should be analyzed in combination.
9 Inglehart (1999) also recognized that religiosity had survived the value change.
10 Aggregation bias is considered to occur when individual data are aggregated into collective data in certain forms of grouping (but not in others). These forms of grouping include (1) grouping by the dependent variable (for instance, if students of different ethnicities are grouped by class achievement before their ethnicity is correlated with class achievement) and (2) grouping by a variable related to both the independent and dependent variables (Langbein and Lichtman 1978, pp. 17–21).
11 This is typically seen in the relationship between income and vacation expenditure of the household in a sample population. When the income is small, the variance of travel expen-diture is small due to the upper limit. When the income becomes larger, the variance of expenditure increases since the household can choose either to restrain or to expand the expenditure (Johnston and DiNardo 1997, p. 163). In general, when actual positive num-bers are used for a regression, the variance of the dependent variable for each value of the independent variable typically increases as the mean of the independent variable increases. This is because as the mean of the dependent variable grows larger, the maximum possible range of values for the dependent variable to take also expands.
12 Logarithmic transformation appeared to be the most appropriate method for the data used in this study.
13 “Regression does not require assumptions about the distribution of X variables, but in practice skewed X distributions are often associated with statistical problems such as influence and heteroscedasticity” (Hamilton 1992, p. 55).
14 Data on per capita provincial incomes were kindly provided to the author by the State Institute of Statistics in electronic files.
15 Information on voter registration was obtained from the study by Erol Tuncer (2003, pp. 215–19).
16 House confinement for voter registration was introduced as a temporary measure in 1973. 17 In the 2002 general election, registration was computerized for 32 out of the total of 81
provinces (Tuncer 2003, p. 220).
18 Interview with S¸adi Tokay, Vice General Director of Electoral List (Seçim Kütü%gü Genel Müdür Yardımcısı), Supreme Election Board (Yüksek Seçim Kurulu), August 9, 2002, Ankara.
19 A constitutional amendment that was passed on October 3 and promulgated on October 17, 2001 lifted the ban on people detained or convicted for professional negligence.
20 Data accessible from the Central Bank of the Republic of Turkey’s website (http://www. tcmb.gov.tr/).
21 Data accessible from the State Institute of Statistics’ website (http://www.die.gov.tr/). 22 The most recent evidence also indicates that the number of registered voters is smaller than
the number of people eligible to vote (if registered). In the 2002 general election, the Supreme Election Board expected 45 million voters to be registered according to the latest 2000 population census and population growth since that time. In reality, however, only 41.4 million voters were registered. See Cumhuriyet (Istanbul), October 30, 2002. 23 See note 18.