International Competitiveness of Manufacturing
Firms in sub-Saharan Africa
著者
Fukunishi Takahiro
権利
Copyrights 日本貿易振興機構(ジェトロ)アジア
経済研究所 / Institute of Developing
Economies, Japan External Trade Organization
(IDE-JETRO) http://www.ide.go.jp
journal or
publication title
IDE Discussion Paper
volume
2
year
2004-05-01
INSTITUTE OF DEVELOPING ECONOMIES
Discussion Papers are preliminary materials circulated
to stimulate discussions and critical comments
DISCUSSION PAPER No. 2
International Competitiveness of
Manufacturing Firms in
sub-Saharan Africa
Takahiro FUKUNISHI*
Keywords: manufacturing exports, international competitiveness, sub-Saharan Africa
JEL classification: F14, L60, O14, O55
The Institute of Developing Economies (IDE) is a semigovernmental,
nonpartisan, nonprofit research institute, founded in 1958. The Institute
merged with the Japan External Trade Organization (JETRO) on July 1, 1998.
The Institute conducts basic and comprehensive studies on economic and
related affairs in all developing countries and regions, including Asia, Middle
East, Africa, Latin America, Oceania, and East Europe.
The views expressed in this publication are those of the author(s). Publication does not imply endorsement by the Institute of Developing Economies of any of the views expressed.
INSTITUTE OF DEVELOPING ECONOMIES (IDE), JETRO 3-2-2, WAKABA,MIHAMA-KU,CHIBA-SHI
CHIBA 261-8545, JAPAN
International Competitiveness of Manufacturing Firms in sub-Saharan Africa:
Why has the manufacturing sector remained small?
*Takahiro Fukunishi**
Abstract
As the success of East Asian countries has shown, labor-intensive industry is recognized to lead economic growth in the early stages of development, utilizing relatively low labor costs. This same growth process has already started in South and South East Asian LDCs since the mid-1990s. However, the manufacturing sector in sub-Saharan Africa has been underdeveloped and manufacturing exports, in particular labour-intensive goods, have stagnated. This paper investigates the international competitiveness of the African manufacturing sector and its determinants through an analytical survey of empirical studies and a comparison with Asian low income countries.
Empirical evidences indicate that primary factors of competitiveness, namely productivity, labour cost and exchange rate are unfavorable in sub-Saharan Africa. Representative arguments attribute the weak competitiveness to problems in the business environment, factor endowment, and the exchange rate. However, careful review shows that labour cost is beyond the range explained by endowment and misalignment of exchange rates have been reduced in Africa. Moreover, comparison with Asian low income countries which have competitiveness in labour-intensive goods shows no difference in the quality of business environment, while the labour cost is significantly lower than sub-Saharan African countries. Although results should be considered tentative, high labour cost beyond endowment and conservative investment behavior emerge as important factors for the weak competitiveness in sub-Saharan Africa when controlling income level.
1. Introduction
The development of the manufacturing sector in sub-Saharan Africa (hereafter referred to as SSA) has seriously stagnated except in several countries. The share of manufacturing value added in GDP in SSA is 15%, which is the lowest share in the world paralleling South Asia. If South Africa is
*
This is an English translation of the original paper accepted by Asian Economies (Ajia Keizai). Some information utilized in the paper was obtained by interviews in Kenya, Mauritius and Madagascar jointly conducted with Akio Nishiura (Soka University), Katsuji Nakamura (United States International
University) and staffs at the Institute of Development Studies, University of Nairobi. I would like to thank Tatsufumi Yamagata (Institute of Developing Economies), Akio Nishiura and three anonymous referees of the journal for fruitful comments.
**
excluded, which is an exceptionally industrialized country accounting for about 60% of manufacturing production in SSA, the figure drops to 13 %, and well below the average of low-income countries (Table 1). The performance of exports is particularly behind other developing countries. The share of manufacturing exports in total exports in SSA, excluding South Africa, is 21%, which is less than half of that in low-income countries. However, this is partly because SSA countries export a large amount of natural resources, which inflates the total exports and reduces the share of manufacturing. Then, comparing the ratio of manufacturing exports to GDP, the average in SSA (6%) is just over half of the average in low-income countries (11%). Further, the export ratio based on the manufacturing value added is also smaller in SSA than the ratio in low-income countries. Therefore, it is clear that export performance is particularly poor and one of the sources of stagnation of the manufacturing sector.
Table 1 Performance of Manufacturing Sector (2001)
Manufacturing Value Added / GDP Manufacturing Exports/ Commodity Exports Manufacturing Exports /GDP Manufacturing Exports/ Value Added1) Middle and Low Income
Countries 0.22 0.60 0.15 0.67 Low Income Countries 0.18 0.52 0.11 0.59 Sub-Saharan Africa 0.15 0.33 0.10 0.64 Excluding South Africa 0.13 0.21 0.06 0.50 1) Note that this figure does not indicate a share of exports in production. This is the expedient way of
standardization, as figures of manufacturing output value are not available. Source: World Bank, World Development Indicators 2003, and author’s calculation.
SSA has a unique composition in manufacturing exports. In general, labour-intensive goods such as textile, garment and wood products have a substantial share in exports from developing countries, which have relatively abundant labour and scarce capital. In contrast to such trends, table 2 showed that textile and garment goods have much lower share in the manufacturing exports from SSA than that of developing countries.
Table 2 Textile and Garment Exports
Share in Manufacturing
Exports
Developing Countries 0.171 Sub-Saharan Africa excluding South
African and Mauritius 0.102 Asia 0.177
Source: United Nations, International Trade Statistics Yearbook 2001, and author’s calculation
Underdevelopment of manufacturing characterizes almost all SSA countries. Those with relatively a large manufacturing sector are South Africa, Mauritius, Zimbabwe, Swaziland and Cote d’Ivoire. But Zimbabwe has been rapidly decreasing the manufacturing production since the 1990s mainly
due to political turmoil. Mauritius and Swaziland are exceptional cases that specialization in a garment industry (Mauritius) and capital inflow from South Africa (Swaziland) was sufficient to industrialize small economies with less than 2 million people. Other countries have a small manufacturing sector and its contribution to export is also small.
Out of SSA, several LDCs are showing rapid growth of manufacturing exports. Bangladesh has been increasing garment exports since the 1980s when Korean capital flowed in, and now it is the eighth largest exporter of garments and the share of manufacturing exports exceeds 90%. Vietnam has been increasing their exports of footwear and garments since the latter half of the 1990s, and consequently manufacturing exports increased by 160% from 1995 to 2000. In Cambodia, an even faster growth of garment exports has occurred, resulting in an increase of commodity exports by 101% between 1997 and 2001. The initial income level does not seem to matter in industrialization. Extensive literature has investigated the causes of underdevelopment of the African manufacturing sector, and for the last 10 years empirical studies are rapidly increasing due to the development of firm-level data initiated by the Regional Programme on Enterprise Development (RPED) in the World Bank. Given such micro data was rare in SSA, those studies have strength in analyzing firm-level determinants of competitiveness, such as technology, firm size, quality of management, characteristics of managers and workers and ownership. However, since literature synthesizing those results is not available, it is difficult to have an overview of African firms’ performances.
This paper attempts to demonstrate causes of poor performance through analytical review of empirical studies. In comparison with other developing countries, in particular low income countries, international competitiveness of the African manufacturing sector is evaluated and determinants of competitiveness are examined. International competitiveness is a useful measure even for firms supplying only the domestic market, given that competition with imports is becoming common in the domestic market in most of SSA countries as a result of the trade liberalization since the 1990s. In the next section, determinants of competitiveness are theoretically reviewed. In the third section, literature is reviewed and the potential problems of those studies are suggested. To supplement those shortcomings, comparisons with industrialized low-income countries are conducted in the fourth section. Considering the experience of industrialization in developing countries, I particularly focus on the garment industry as a typical labour-intensive industry. The last section concludes. In this paper, South Africa and Mauritius which are exceptionally industrialized countries are not included in consideration.
2. Determinants of Competitiveness
Various causes of poor performance of African manufacturing have been suggested, for example, inward-looking trade policy, poor skill of labour and manager, protective industrial policy and
overvalued exchange rates. To systematically understand impacts of such various causes, determinants of competitiveness will be theoretically examined as a framework of analysis in this section.
Given the minimal product differentiation in manufacturing goods exported from developing countries, production cost is the most critical factor for international competitiveness. The theory of comparative advantage suggests that productivity and factor endowment fundamentally determine production cost.
The Ricardian model indicates that a country has a comparative advantage in the goods which productivity is relatively higher than other goods. Assuming only one factor for production, labour, for simplification, productivity provided by technology determines labour cost. Then unit cost of goods produced with relatively productive technology is lower than that in other countries, while unit cost of goods with less productive technology is higher. Then, higher productivity creates international competitiveness. On the other hand, the Hecsher-Ohlin model argues that prices for untradable factors vary among countries as prices are determined by relative endowment of factors. Obviously the price of relatively abundantly endowed factor is lower than the price in other countries, and hence, the country has a comparative advantage in goods using well endowed factor intensively.
However, a good with comparative advantage does not necessarily have international competitiveness, unless the price of goods and factor are determined at competitive equilibrium. Both models explicitly assume that factor price and product price are equal to marginal product of factor and marginal cost of product respectively, and therefore, substantial divergence from market price may deprive comparative advantage. This is shown in the following two-country model with two goods and one factor. Suppose that the amount of factor, labour, necessary to produce one unit of goods is defined as the below matrix.
good 1 good 2 Country A 1
a
a
2 Country B ∗ 1a
a
2∗Assuming that country A has a comparative advantage in good 1, then
∗ ∗
<
2 1 2 1a
a
a
a
. (1)Further, for A to have international competitiveness in good 1, the cost to produce good 1 in A should be lower than the cost in B. This condition is expressed as
e
w
a
w
a
1<
1∗ ∗ ,where wage in A is , wage in B is and exchange rate from B’s currency to A’s is . This is
rearranged as
e
w
w
a
a
∗ ∗>
1 1 . (2)In the same way, for B to have competitiveness in good 2,
e
w
w
a
a
∗ ∗<
2 2 (3)needs to hold. Organizing equation (1), (2) and (3), conditions for both countries to have competitiveness according to comparative advantage is described as
2 2 1 1
a
a
e
w
w
a
a
∗ ∗ ∗>
>
(4)Given that and are productivity of good 1 in A and B respectively, (4) indicates that
A will have competitiveness in good 1 when the ratio of wage in A to wage in B is less than the ratio of productivity in A to B. And only when wage ratio is greater than productivity ratio for good 2, B retains competitiveness in good 2.
1
/
1 a
1 a
/
1∗When good prices and wages are determined at competitive equilibrium, condition (4) holds (refer
to the appendix for proof). If is greater than , A will loose competitiveness in
good 1 then import both goods from B. As this change increases labour demand in B and deceases in
A, will drop until it becomes smaller than , assuming constant . If we consider
the impact of such trade on the exchange rate, that is, will be appreciated due to the increase of
exports from B, then will decrease without change in and
)
/(
w
e
w
∗a
1∗/ a
1)
/(
w
e
w
∗a
1∗/ a
1e
e
)
/(
w
e
w
∗w
w
∗1 . However, if the labour market is imperfect and the exchange rate does not change as much as it compensates wage rigidity, countries do not necessarily have competitiveness in the goods with comparative advantage. From the above argument, weak competitiveness of the African manufacturing sector can be attributed to 1) relatively low productivity, 2) disadvantage in factor endowment, and/or 3) distortion in factor market and exchange rate.These factors of competitiveness are formed by policy and firm behavior. Trade policy, skill of workers and technology policy will affect productivity. For instance, inward-looking trade policy in SSA, which many studies have claimed adverse effect on economic growth (for example, Sachs and Warner [1997]), may have weakened competitiveness through slower productivity growth due to protection of industry from imports. On the other hand, recent economic growth theory focuses on the government’s role, arguing that a nation’s business environment consisting of quality of infrastructure and governmental efficiency seriously affect technology adoption. Given that
1
However, since other factors than trade also affects exchange rate, it does not generally drop until
becomes smaller than .
)
/(
w
e
technological progress in developing countries is mainly brought by transfer from developed countries, technology is not smoothly transferred to the countries, where complex and inefficient administrative procedure, including corruption, inflates investment costs or poor infrastructure deteriorate performance of the technology.
Factor endowment is much less controllable except capital. It is argued that Africa is characterized as scarce labour and capital and abundant land, and such a pattern has adversely affected manufacturing sector that intensively use labour and capital.
Distortion in factor market is brought by government intervention or underdevelopment of market institution. Closed trade policy increases price of imported materials. Labour cost is most susceptible to market distortion as its international transferability is much lower than other factors. Government intervention to labour market and institutional structure of market such as labour union are potential sources of distortion. The exchange rates in African countries have been controlled by governments since independence, most of which are regarded as overvalued.
In the next section, these arguments about the source of weak competitiveness are investigated, and factors of competitiveness, namely productivity, factor endowment, labour cost and exchange rates in Africa are evaluated.
3. Empirical Evidences
3.1 Productivity2
Estimates of technical efficiency of the African manufacturing sector are generally lower than
figures in other developing countries3. Table 3 indicates that in all industries estimates of SSA
countries are lower than estimates in other developing countries, though countries are limited due to data availability. Based on international comparison of technical efficiency, Tybout [2000] concludes that there is no distinction in technical efficiency between developing and developed countries except SSA. These comparisons suggest that the average dispersion from the frontier is exceptionally larger in SSA than in other countries, and presumably the average productivity of
2
In the Ricardian model, it is relative productivity to other industries that determines comparative advantage, but in this section productivity in the manufacturing sector is solely compared because of difficulties to obtain productivity of other industries. However, such comparison is still useful for an evaluation of competitiveness. As equation (4) indicates, whether relative productivity to other countries is greater or lesser than wage ratio determines competitiveness. Hence, goods with higher productivity ratio to other countries is more likely to have competitiveness
3
Technical efficiency measures divergence of each firm’s production from the frontier production function, assuming a same technology over sample firms. Hence, comparison of average technical efficiency shows not technological level but efficiency in production. Note, however, that when technological level significantly differs among countries, that is when the assumption does not hold, higher technical efficiency does not necessary mean higher productivity.
African firms is lowest in the world. Further, most studies measuring TFP growth reported that the
growth in African firms is very slow4.
An empirical test of the impact of productivity on export performance requires considering the reverse causality; entrance in competitive international markets may enhance productivity growth by increasing cost minimization motivation or obtaining information of new technology. Empirical studies that dealt with such problems reported that the more productive the firm is, the more likely it is to export or more products are exported (Bigsten et al. [2000b], Södering[2000], Söderbom and Teal [2000], Mazumdar and Mazaheri [2003: Ch14]).
Table 3 Average Technical Efficiency
Biggs et al. [1995] Ghana, Kenya, Zimbabwe Mazumdar and Mazaheri [2003: Ch.10] Ghana, Kenya, Tanzania, Zambia, Zimbabwe Mlambo [2002] Zimbabwe 1993-1995 Lundvall et al. [2002] Kenya 1993-95 Bhavani [1991] India Kalirajan and Tse [1998] Malaysia Hill and Kalirajan [1993] Indonesia Pitt and Lee [1981] Indonesia Tyler and Lee [1979] Colombia All Industries 0.33-0.52 0.53-0.69 0.44 Food 0.67 0.53-0.66 0.51 0.54 0.73 0.63 0.64 Textile and Garment 0.46 0.56-0.69 0.60 0.40 0.62-0.77 0.55 Wood and Furniture 0.42 0.54-0.65 0.42 0.38 0.98 Metal 0.51 0.51-0.63 0.57 0.47 0.72 0.99
Note: All results are drawn from stochastic frontier model.
Source: Data of non-African countries are extracted from Tybout [2000: Table 3].
Few international comparisons of determinants of productivity have been done, though they will effectively reveal the source of the performance gap between Africa and other regions. Exceptionally, Pack [1987] comparing Kenyan textile industry with developed and developing countries confirmed that there was no technology gap between Kenya and developed countries but much diversity in product variation and inefficiency in production process in Kenya generate a productivity gap. He inferred that the lack of appropriate management of production (i.e. maintenance of equipment, quality control of raw material) caused such inefficiency.
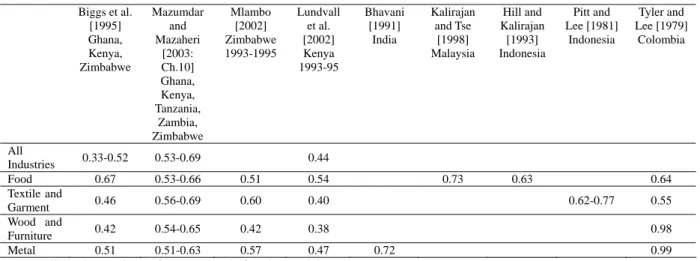
There are several studies searching productivity determinants by intra-Africa comparison. Those studies indicate the robust impact of export experience (and export share) and skills of worker on productivity (Table 4). The positive effect of exportation implies the importance of access to foreign technology for productivity improvement, which is also supported by the empirical results suggesting impact of technology transfer and foreign ownership on productivity. The positive effect
4
Teal [1999] (Ghana), Gerdin [1997] (Kenya, cited in Bigsten [2001]), Adenikinju et al [2002] (Cameroon, Cote d’Ivoire, Nigeria and Senegal), Söderling [2000] (Cameroon), Mlambo [2002: pp222,227] (Zimbabwe).
of skills means the importance of human capital in the manufacturing sector.
Based on such results, Biggs and others argued that stagnation of African firms is ascribed to not technological backwardness but to the lack of ‘technological capability’, which is defined as information and skills to effectively utilize technology (Biggs et al [1995]). Through firm interviews, they identified that firms owned by foreigners or minorities (i.e. Asian and European), and exporting firms obtain such information through clients, a parent company and ethnic network, while rest of firms, mainly owned by Africans, do not have access and then are, ‘technically isolated’ (Biggs et al [1995: pp ]). This argument is consistent with findings by Pack [1987].
Table 4 Determinants of Productivity
Biggs et al [1995] Ghana, Kenya, Zimbabwe Mlambo [2002] Zimbabwe Lundvall et al. [2002] Kenya Mazumdar and Mazaheri [2003: Ch10] Ghana, Kenya, Tanzania, Zambia, Zimbabwe Adenikinju et al. [2002] Cameroon, Cote d'Ivoire, Nigeria, Senegal Bigsten et al. [2000b] Zimbabwe, Kenya, Ghana, Cameroon Sodering [2000] Cameroon Bigsten et al. [2000a] Zimbabwe, Kenya, Ghana Dependent Variable Technical Efficiency Technical Efficiency Output Technical Efficiency Value Added TFP growth Technical Efficiency Value Added Value Added Size - +* Age +* +* - + Export - +* +* +* +* +* Technology transfer +* +* Foreign capital +* + - +* Manager’s skill + (education) +* (education) + (age and experience) Workers’ skill +* (share of skilled, training) + (share of skilled) +* (training) +* (share of skilled) +* (share of skilled) +* (education and tenure) Finance +* +* Manager’s race(African) -* -* Competition +* Location (Capital) +* Infrastructure +*
Note: Sign means sign of estimated coefficient of each variable. * indicates the coefficient is significant at 10% level or less.
On the other hand, Collier [1997] laid emphasis on high transaction costs as a source of the stagnation of the manufacturing sector. He argues that the business environment in Africa is characterized as having high transportation cost, imperfect contract enforcement, high information cost and poor public services, and it raises transaction cost. It particularly damages the manufacturing sector requiring more transaction. Elbadawi [1999] showed that transaction cost represented by quality of infrastructure and corruption index has robust and strong correlation with the manufacturing exports, and that it most significantly accounts for the gap of the export
performance in East Asia and SSA, based on cross-country analysis. An empirical test using firm
data is intrinsically difficult as transaction cost do not have sufficient variation within Africa5.
The relatively small size of African firms may affect productivity. Though few studies have tested the relation between size and productivity, robust correlation with export performance has been detected by several studies (Söderbom and Teal [2000], Granér and Isaksson [2002], Mazumdar and Mazaheri [2003: Ch.14], Söderling [2000]). It is inferred that this relation reflects not only the economies of scale, but also the sunk cost necessary for export production, i.e. marketing, development of distribution network, and product customization for the market, which cannot be financed by small firms (Roberts and Tybout [1997]).
The impact of trade policy on productivity has not been empirically tested with African data with a few exceptions. A study by Harrison [1994] using panel data in Cote d’Ivoire, showed productivity growth in manufacturing firms improved after trade liberalization in 1985 containing reduction of
tariff and removal of import quota6.
3.2 Factor Endowment and Labour Costs
The relative endowment of labour to land in SSA as a whole is the least in the world, though there
is large fluctuation among countries7. The Hecsher-Ohlin theorem predicts that such economies have
comparative advantage in land(resource)-intensive industry rather than labour-intensive industry. Wood and Mayer [2001] draws a new implication from the theorem by adding skills as an immobile factor. They argue that as SSA is poorly endowed with skill, the manufacturing sector requiring skilled labour more intensively than the primary sector has a comparative disadvantage. Presenting a robust correlation between the pattern of the endowment and the manufacturing exports, they concluded that stagnation of the manufacturing exports in SSA is mainly due to the factor endowment and therefore, further development has few prospects.
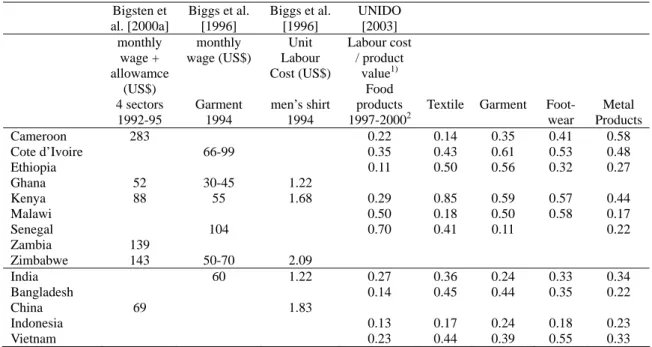
Table 5 compares wage and unit labour cost among low income countries, which partly reflects
labour endowment8. Wage in SSA countries has a large variance; high wage in CFA franc countries
(Cameroon, Cote d’Ivoire and Senegal) and low in Ghana. Except Ghana, wage in SSA is higher than India and China. Comparison of unit labour cost shows the same trend, particularly in garment
5
Significant influence of the ethnicity of the manager on productivity found in several studies indirectly supports the hypothesis. A business community formed by an ethnic group is considered to reduce transaction cost by providing credit, goods and information exclusively with members. The lower productivity of firms owned by African can be attributed to the higher transaction that they face.
6
However, as price margin did not change significantly, the productivity improvement is not a result of enhanced competition.
7
For international comparison of pattern of factor endowment, see Wood and Mayer [2001: Figure 3] and Sudou [2003: Figure 2].
8
The Hecsher-Ohlin theorem predicts equalization of factor prices among countries as a result of trade, but in reality, they are not perfectly equalized due to obstacles to trade.
and footwear industry. In labour-intensive industry, labour cost adjusted by productivity is higher in Africa than one in other low income countries.
Few attempts have been made for an empirical test of the impact of wage on international competitiveness in SSA. Mbaye and Golub [2003] showed robust correlation between unit labour cost and the manufacturing exports using Senegalese panel data.
Table 5 Wage and Unit Labour Cost
Bigsten et al. [2000a] Biggs et al. [1996] Biggs et al. [1996] UNIDO [2003] monthly wage + allowamce (US$) 4 sectors 1992-95 monthly wage (US$) Garment 1994 Unit Labour Cost (US$) men’s shirt 1994 Labour cost / product value1) Food products 1997-20002
Textile Garment Foot-wear Metal Products Cameroon 283 0.22 0.14 0.35 0.41 0.58 Cote d’Ivoire 66-99 0.35 0.43 0.61 0.53 0.48 Ethiopia 0.11 0.50 0.56 0.32 0.27 Ghana 52 30-45 1.22 Kenya 88 55 1.68 0.29 0.85 0.59 0.57 0.44 Malawi 0.50 0.18 0.50 0.58 0.17 Senegal 104 0.70 0.41 0.11 0.22 Zambia 139 Zimbabwe 143 50-70 2.09 India 60 1.22 0.27 0.36 0.24 0.33 0.34 Bangladesh 0.14 0.45 0.44 0.35 0.22 China 69 1.83 Indonesia 0.13 0.17 0.24 0.18 0.23 Vietnam 0.23 0.44 0.39 0.55 0.33
1) Ratio of total labour cost to product value. This is approximation of unit labour cost, substituting labour cost per product with labour cost per production value.
2) Cameroon 1998, Cote d’Ivoire 1997, Ethiopia 2000, Kenya 1999, Malawi 1998, Senegal 1997, India 1999, Bangladesh 1997, Indonesia 1999, Vietnam 2000.
Difference of unit labour cost reflects characteristics of labour market as well as labour endowment. As no reliable study estimating impact of endowment on labour cost is available, contribution of endowment pattern on wage gap is not determined. However, figure 5 shows unit labour costs in industries using unskilled labour, namely garment and footwear industry, are high, which is inconsistent with the prediction by the Wood-Mayer model, which implies that the wage of
unskilled labour is lower than that of skilled labour in SSA9.
On the other hand, studies on wage determination exhibit importance of non-productivity factors, and it is more distinct in SSA countries. For instance, Rama [2000] shows wages in CFA franc countries are much higher than other countries after controlling productivity and skills, and the wage
9
An assembly process of garment industry does not need high skills. A sewing machine operator needs 2 to 3 months training, but it is normally done on the job, and no skills are necessary except minimum reading and writing. In the Wood-Mayer model using education as a proxy of skills, they are categorized as unskilled.
gap between formal and informal sector is larger10. Velenchik [1997] reported that the association of wage with firm size in Zimbabwe is far larger than that in India and Peru, which implies that something represented by firm size (other than productivity) strongly affects wage determination. Studies also revealed that institutional characteristics in the labour market, namely powerful labour unions, strict labour legislation and high wages in government, raise wages (Rama [2000], Mabaye and Goulb [2003], Velenchik [1997], Teal [1996]). Particularly in CFA franc countries, it is reported that governmental intervention in the market through detailed minimum wage setting, recruitment through governmental agencies and strict conditions for retrenchment had been severe. However, even controlling these institutions, wage has a robust correlation with non-productivity factors, such as firm size and profit (Velenchik [1997], Teal [1996]). Currently such association is interpreted as efficiency wage and/or rent sharing. For instance, large firms need substantial monitoring for workers and screening for job applicants in Africa where information is highly imperfect. Then, they may be able to avoid such information cost by paying high wages, which is expected to enhance work incentive or increase the application of skilled workers. Some claim that
large firms protected by government share rent with labour11. But such hypothesis has not been
tested yet.
3.3 Exchange Rates
Empirical studies testing the impact of exchange rate on manufacturing exports indicated a clear correlation among SSA countries. A high real exchange rate, a large deviation from the equilibrium rate, and a large fluctuation of real exchange rate are robustly associated with a low GDP share of the manufacturing exports (Balassa [1990], Ghura and Grennes [1993], Sekkat and Varoudakis [2000], Södering [2000]).
Currencies in Africa had been overvalued consistently since independence, and its deviation from the equilibrium rate was larger than the deviation in other developing countries. The black market premium, a crude measure of misalignment, was 40% on average from the 1960s to 80s, which well exceeds the average in LDCs that was 26% (Collier and Gunning [1999: Table 3]). Correspondingly, deviation of the real exchange rate from the equilibrium rate is estimated as 40.7% on average (1972-87, Ghura and Grennes [1993]). Degree of the misalignment peaked from the late 1970s to early 80s and was as large as 90%, and then it tuned to a decreasing trend in the 90s in many
10
Wage in informal sector is generally regarded to be close to equilibrium wage as it has almost no governmental intervention. Large disparity in wages of informal and formal sectors after controlling skills indicates bias in formal sector wage.
11
Collier and Gunning [1999] argues that African firms which are presumably risk averse due to high transaction cost have motivation of rent sharing. As linkage of wage to profit reducing fluctuation in profit work as a risk sharing with workers.
countries except CFA franc region, reflecting currency depreciation as a part of Structural Adjustment Program (Table 6). CFA franc was devaluated in 1994 by 50%, which had effectively improved misalignment.
The share of the manufacturing exports is following the trend of misalignment, dramatically dropping in the 1980s and gradually recovering in the 90s (Figure 1). It indicates the strong impact of exchange rates. Sekkat and Varoudakis [2000] estimated that if there had not been the misalignment of exchange rates, exports of textile, chemical and metal products would have been greater by 60-100% in Ghana, Kenya, Zimbabwe, Tanzania and Zambia. Also Södering [2000] estimated that the overvalued exchange rate in the 80s reduced manufacturing exports by 30-50% in Cameroon. However, Tybout et al. [1997] showed that increase of the manufacturing exports in Cameroon after the depreciation of CFA franc was mainly brought about by the growth of existing exporters and not by the entrance of non-exporters. This fact shows that the devaluation of exchange rate does not necessarily encourage entrance to exports, presumably due to sunk cost for export production.
Table 6 Exchange Rate in SSA Countries
1970-74 1975-79 1980-84 1985-89 1990-94 1995-99 2000-01 Real Exchange Rate (1995=100) - - 265.9 149.1 114.0 107.6 104.3 Black Market Premium (%)1) 36.9 85.5 89.0 43.1 16.5 2) - -
1) Average except CFA franc countries. 2) Average from 1990 to 96.
Source: World Bank, World Development Indicators (RER), Sekkat and Varoudakis [2000: Table2] (Black Market Premium)
Figure 1 Manufacturing Exports / Commodity Exports (%)
0 10 20 30 40 50 60 70 1 9 6 0 1 9 6 5 1 9 7 0 1 9 7 5 1 9 8 0 1 9 8 5 1 9 9 0 1 9 9 5 2 0 0 0 Sub-Saharan Africa Low income Low & middle incom e
3.4 Discussion
Empirical studies have shown that the productivity of African manufacturing firms is lower and their labour costs are generally higher than other low-income countries, and that those characteristics as well as the overvalued exchange rates have had a significant impact on manufacturing exports. It is corroborated that competitiveness of the African manufacturing sector is relatively weak.
There is no doubt that the overvalued exchange rates seriously discouraged the growth of manufacturing exports in the 1970s and 80s when misalignment was most severe. Though the exchange rates tend to be high due to Dutch disease stemming from natural resource exports in SSA, studies have demonstrated that the exchange rates had been misaligned. However, the depreciation of currency which widely occurred in SSA countries during the 1990s has reduced the degree of misalignment, and recent exchange rates are close to the equilibrium rates. Therefore, the gap between SSA and other developing countries is not accounted for by exchange rate misalignment. The impact of factor endowment on competitiveness is meaningful, because it is out of the control of a government in the short term. Though there are no studies measuring the impact of factor endowment, the reality of SSA economies is not consistent with the theoretical consequence of land-abundant and labour-scarce economies. For instance, the Wood-Mayer model of endowment hypothesis does not explain the fact that the unskilled-labour-intensive industries, such as textile and garment industry have even weaker competitiveness than the other manufacturing sector in SSA, because it implies wage of unskilled labour is lower than wage of skilled labour in skill scarce
economy12. Further, the standard endowment theory predicts labour-scarce economies will achieve
high income levels through high wages, but the lowest income of SSA in the world has the totally opposite consequence. As empirical studies show, high labour costs are mainly because of imperfection in the labour market rather than factor endowment.
Studies on productivity determinants ascribed lower productivity in SSA firms to a lack of access to information on technology and management, poor labour skills, and high transaction cost stemming from a poor business environment. They also demonstrated the robust correlation between firm size and export, which means increasing returns in export production.
These results can be interpreted that poor skill of labour and high transaction costs have discouraged investment and then, have stagnated technological progress. Due to substantially poor skill, public service and infrastructure, performance of technology has been seriously deteriorated in African firms, and accordingly, investment from domestic and foreign sources remains small reflecting a low rate of return. Small investment have slowed down productivity improvement and
12
Such inconsistency is brought by the Wood and Mayer’s assumption that manufacturing sector unanimously employs skilled labour. As mentioned in the footnote 9, however, some manufacturing industries intensively employ unskilled or semiskilled workers.
narrowed access to new technology provided by foreign investors. Likewise, investment for human capital remains small. In fact, RPED data by World Bank shows that about half of sample firms did not invest at all for last three years (Bigsten et al. [2000]). That is, the net investment rate for half of the sample firms was negative.
However, there are obviously difficulties in methodology which explains the low productivity of African firms relying solely on the African firm data. Firstly, causality drawn from the African sample may not be found in other countries. Given that the African sample is a low-productivity group, it is not automatically assumed that the same causality is seen in a high-productivity group. Secondly, the impact of the business environment has nor been empirically tested because of little variance within SSA region. Thirdly, whether productivity determinants in SSA are growth-retarding has to be confirmed. For instance, unless workers’ skills and/or the quality of the infrastructure are poorer in SSA, they are not the sources of low productivity of African firms.
Elbadawi [1999] using cross-country analysis cleared such problems. However, it is known that the corruption index used in his model as a proxy of public service is an endogenous variable to
economic growth13. Given the strong correlation between manufacturing exports and economic
growth, a lower degree of corruption can be a result of growth in manufacturing exports. Similarly a high quality of infrastructure might be a result of economic growth. Therefore, his empirical result should be in question.
In the next section, labour skills, infrastructure and public services are compared with the low-income countries which are relatively industrialized. Comparison with such countries enables us to understand how much SSA countries are poorer in skills and business environment, and to approach the true impact of those variables by reducing the endogeneity bias.
4. International Comparison of Determinants of Productivity
4.1 Perspective in Comparison
There are eight low-income countries whose manufacturing exports dominate more than 50% of commodity exports; Bangladesh, Cambodia, Haiti, India, Indonesia, Nepal, Pakistan, and Togo (World Bank [2003]). Among them, six countries export garments as the main manufacturing
product14. The garment industry, in particular the assembly process, is/was a leading industry in
13
Empirical growth studies detected that corruption index has two-way causality with growth rate of GDP (Acemogule et al. [2001], Block [2001]), and with investment rate (Mauro [1995]).
14
Except Haiti and Togo. The garment exports from India, Bangladesh and Indonesia are ranked in 7th, 8th and 9th in the world. For the other three countries, garment exports account more than 20 % of commodity exports (WTO [2002]).
many developed and developing countries at the initial stage of industrialization, mainly because its technical characteristics matches with the factor endowment of many low-income countries. Therefore, comparisons with countries exporting garments, namely Bangladesh, Cambodia, Indonesia, Nepal, Pakistan and Vietnam will provide a good indication of whether SSA countries will be able to start such a typical industrial process. If the implications from empirical studies are valid, workers’ skills, the quality of infrastructure and governance in those countries must be better than those in SSA.
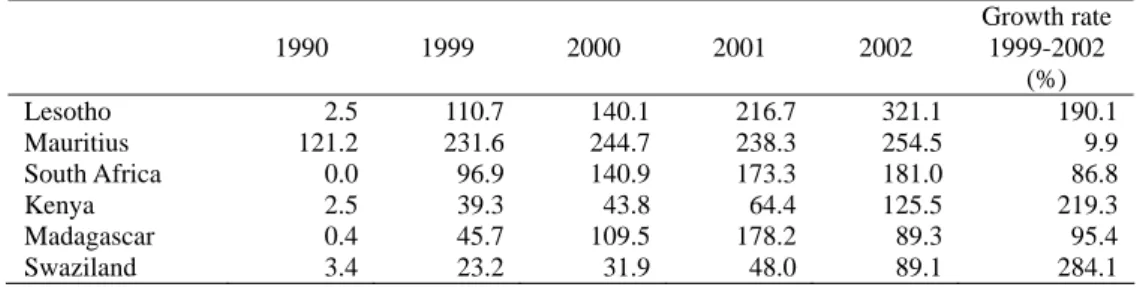
Further, the SSA countries recently increasing garment exports are focused. After the enactment of the African Growth and Opportunity Act (AGOA) in 2000, garment exports from some SSA countries to the US market have been rapidly increasing. AGOA is a US domestic act to remove tariffs on imports from African countries satisfying certain political and economic conditions. For textile and garment products, 17 countries are qualified for duty free exports up to 7% of total US imports. It has a distinctive feature in the rule of origin that allows less developed countries among
those qualified to use fabrics and yarn made in a third country15. This rule makes AGOA far more
attractive than other preferential trade agreements such as the Cotonou Convention, which provides duty free access to the EU market for garments made from domestically produced textile. However, utilization of the AGOA scheme is limited to several African countries; Kenya, Lesotho and Madagascar which have started export recently, Mauritius and South Africa having already exported to EU markets (Table 7). The export development is premature yet, and moreover, there is uncertainty in the future particularly after the termination of the preferential rule of origin. But differentiated supply responses among SSA countries have reflected their competitiveness, and so it is useful to compare the countries which instantly responded to the beneficial opportunity with those which have not. Kenya, Lesotho and Madagascar are selected as countries responding to AGOA, and Ghana, Senegal, Uganda and Zambia are selected as those not responding despite under the same scheme16.
Table 7 Garment Export to US market (million US$)
1990 1999 2000 2001 2002 Growth rate 1999-2002 (%) Lesotho 2.5 110.7 140.1 216.7 321.1 190.1 Mauritius 121.2 231.6 244.7 238.3 254.5 9.9 South Africa 0.0 96.9 140.9 173.3 181.0 86.8 Kenya 2.5 39.3 43.8 64.4 125.5 219.3 Madagascar 0.4 45.7 109.5 178.2 89.3 95.4 Swaziland 3.4 23.2 31.9 48.0 89.1 284.1
Source: US Department of Commerce, Otexa
15
LDBC is defined as a country with less than $1,500 GDP per capita in 1998. Most of the countries except Mauritius, South Africa and Seychelles are LDBCs. For non-LDBC, textile produced in countries qualified for AGOA or United States has to be used for garment production.
16
4.2 Transaction Cost and Labour Skill
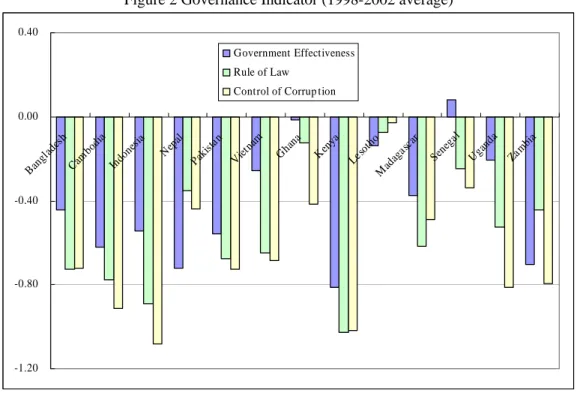
World Bank Institute creates governance indicators in six fields using 18 surveys conducted by research institutes, NGOs and international organizations. Figure 2 indicates three indexes representing public service and contract enforcement; namely ‘government effectiveness’, ‘rule of law’ and ‘control of corruption’.
Except one index of Senegal, all indexes are below the world average. Though indexes for SSA countries have large variance, it does not correspond with the export experience. While among the AGOA group Kenya is poorly evaluated, Ghana and Senegal in the non-AGOA group obtained relatively good scores. Indexes of SSA countries tend to be higher than those of the industrial low income countries except Kenya. No positive relation between the quality of governance and the export performance is shown from this comparison.
Figure 2 Governance Indicator (1998-2002 average)
-1.20 -0.80 -0.40 0.00 0.40 Bangl ades h Cam bod ia Indone sia Nepa l Pak ista n Viet nam Gha na Kenya Leso tho Mada gasc ar Sene gal Ugan da Zam bia Government Effectiveness Rule of Law
Control of Corrup tion
Note: World average is zero. Source: World Bank Institute [2003]
Figure 3 compares length of paved road (per km2 and 1000 people) and number of telephone line
(per 1000 people) as a proxy of infrastructure. Average of road length of the industrialized low income countries is shorter than that of SSA countries. As for telephone lines, while Indonesia, Pakistan and Vietnam have better networks than others, Bangladesh and Cambodia are clearly poorer than SSA countries. The quality of those infrastructures of the AGOA group is not significantly
better than non-AGOA group.
Comparison of the enrollment rate of secondary education as a proxy of skills indicates that the average rate of the industrialized low income countries is higher than that of SSA countries. But in some countries such as Bangladesh, Cambodia and Pakistan the rate is as low as one in SSA countries.
Figure 3 Road, Telephone Line and Enrollment Rate for Secondary Education (Ghana=1.0)
0.00 1.00 2.00 3.00 4.00 5.00 Bangl ades h Camb odia Indo nesi a Nepa l Paki stan Viet nam Ghan a Kenya Leso tho Ma daga scar Seneg al Ugan da Zam bia
Road p aved/(1000p op *km2 land) T elep hone /1000p op
Secondary enrollment
7.23
Note: Average from 1990 to 2001.
Source: World Bank, World Development Indicators
4.3 Source of Weak Competitiveness
International and interregional comparisons demonstrated that there were no clear gaps in business environment and skills between the industrialized low-income countries, the AGOA group and the non-AGOA group. With regard to the development of the garment industry the evidence cast strong doubts in considering those factors as crucial source of weak competitiveness in SSA.
In an interview conducted by the author, managers of exporting firms stressed that smooth clearance of customs, reliable transportation and stable power supply are crucial to satisfy the short
lead time required by buyers, and consequently they affect the productivity17. However, Export
Processing Zones (EPZ), where most exporting firms were located, provide far better infrastructure and public service than other region, for instance electricity is exclusively provided in the EPZ. In
17
The author visited 17 garment firms and manufacturing associations in Kenya and Madagascar as a part of an extensive firm survey in August to September 2003. The interview includes non-exporting firms.
fact, the countries exporting garments despite a poor business environment, namely Bangladesh, Cambodia and Kenya provide EPZ scheme, while non-exporters such as Ghana, Senegal and Zambia
do not18. Hence, the poor business environment in low income countries may be partially
supplemented by EPZ scheme, and conversely, it implies that problems in the business environment can be mitigated without fundamental improvement of infrastructure and governance.
No significant difference in educational level is consistent with characteristics of labour in garment industry. Skills necessary for workers in the assembly process are generally obtained from on-the-job training and do not require high educational experience. This fact indicates that the Wood and Mayer’s argument assuming high demand of skilled labour with education in manufacturing sector does not correspond to the garment industry, and, hence, that poor educational level does not
constrain development of the garment industry19.
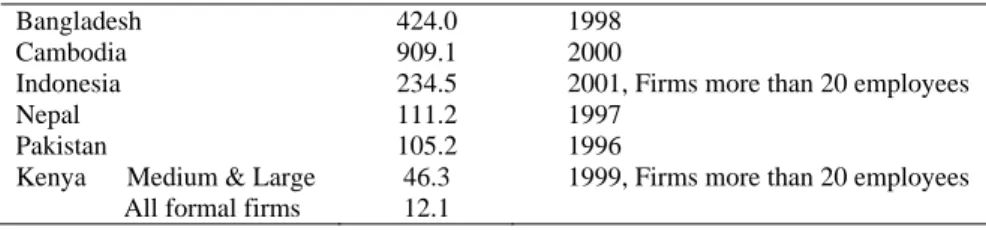
On the other hand, there is a clear distinction in the amount of investment between Asian and African countries. In Asian countries, FDI played a pivotal role at the beginning of industrialization by bringing productive technology and management, which were consequently transferred to domestic firms through spill over. But FDI to the garment industry in SSA countries has been quite small except recent investment to countries in the AGOA group. As mentioned earlier, the domestic investment rate is also quite low, which resulted in very small firm size in SSA (Table 8). How is such a gap in investment rate explained? Have subtle differences of business environment in EPZ and/or unmeasured gap in labour skills between Asia and Africa generated substantial differences in productivity and then brought different consequences in investment?
Table 8 Average Number of Employees of Garment Firms
Bangladesh 424.0 1998
Cambodia 909.1 2000
Indonesia 234.5 2001, Firms more than 20 employees
Nepal 111.2 1997
Pakistan 105.2 1996
Kenya Medium & Large 46.3 1999, Firms more than 20 employees All formal firms 12.1
Source: Sok Hach, Chea Huot and Sik Boreak, Cambodia's Annual Economic Review 2001, Cambodia Development Resource Institute
Central Bureau of Statistics, Nepal, Statistical Yearbook of Nepal 2001 Badan Pusat Statistik, Indonesia, Statistical Yearbook of Indonesia 2002 Bangladesh Bureau of Statistics, Statistical Yearbook of Bangladesh 2000
Federal Bureau of Statistics, Pakistan, Census of Manufacturing Industries 1995-96 Central Bureau of Statistics, Kenya, Statistical Abstract 2000
One possible cause is not through the productivity path but factor-price path. While the average monthly wage of a machine operator is around US$40-50 in the industrial low income countries, that
18
Ghana, Senegal and Zambia provide several investment incentives but not EPZ or industrial park which equips infrastructure. Some EPZs in Kenya and Cambodia are developed by private firms.
19
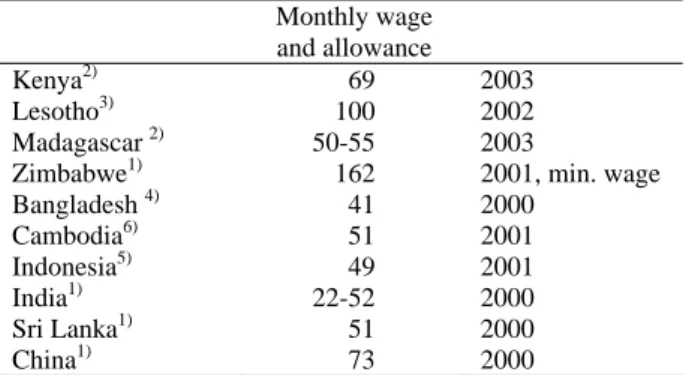
in Kenya and Lesotho is $70-100, which is higher by more than 50% (table 9). Considering that managers of exporting firms evaluate African workers as no more productive than Asian workers (interview by author), unit labour costs would be even higher. In garment exports for the US market, where low price basics are main products, cost is such an important factor that retailers extend supply sources globally to reduce production costs. Labour costs have a significant impact on competitiveness.
Is such wage gap brought by difference in endowment of unskilled labour? It is obvious that relative endowment of unskilled labour to land is smaller in SSA than the industrialized low income countries, because educational level is no significant difference and population density is much smaller in SSA countries. However, if such scarcity of relative endowment affects wage, unemployment rate of unskilled worker must be low in Africa, but clearly it is not consistent with the reality. Therefore, it is strongly inferred that high wage of the unskilled in Africa is not ascribed to the factor endowment.
Table 9 Wage of a sewing machine operator(US$)
Monthly wage
and allowance
Kenya2) 69 2003 Lesotho3) 100 2002 Madagascar 2) 50-55 2003 Zimbabwe1) 162 2001, min. wage Bangladesh 4) 41 2000 Cambodia6) 51 2001 Indonesia5) 49 2001 India1) 22-52 2000 Sri Lanka1) 51 2000 China1) 73 2000
1) Based on ILO [2001] data, the author converted to monthly wage excluding overtime work. 2) Data from interviews with managers and workers by the author in 2003. Wages in EPZ firms. 3) Gibbon [2003]. Average wage including overtime work.
4) Bangladesh Bureau of Statistics, Statistical Yearbook of Bangladesh 2000. 5) Badan Pusat Statistik, Statistical Yearbook of Indonesia 2002.
6) Sok Hach, Chea Huot and Sik Boreak, Cambodia's Annual Economic Review 2002, Cambodia Development Resource Institute.
7) Biggs et al [1996].
Another possible cause is unusual behavior of firms and investors. RPED data showed that while the investment rate is extremely low in the manufacturing sector including the garment industry, the marginal rate of return of capital is as high as 23% (Bigsten et al. [2000]). That is, such extremely low investment does not reflect the return of capital. A study on FDI also reported that the amount of FDI to SSA is significantly smaller than the expected amount drawn from risk, governance and productivity of countries (Jaspersen et al. [2000]). However, such firm and investors’ behavior have not been demonstrated by studies on investment behavior, though there is agreement that financial constraint and market risk play minor role (Fafchamps and Oostendorp [2002], Bigsten et al [1999], Pattilo [2000]). Some economists suggested policy risk, such as large fluctuations in the exchange
rate, interest rate and inflation rate had discouraged investment (Fafchamps and Oostendorp [2002], Bigsten et al [1999]), though it is not empirically tested.
As the comparison proposed here is a first approximation based on macro data, detailed analysis using firm data is necessary to investigate the impact of the business environment and skills on productivity. However, it showed that high labour cost may be more crucial factor of weak competitiveness of the African garment industry than the business environment and skills. Relatively weak competitiveness will induce little investment reflecting little profitability, but empirical evidences indicated that very conservative investment behavior has further reduced investment and slowed down technology improvement.
5. Conclusion
The survey of empirical studies demonstrates that the African manufacturing sector is disadvantageous in primary factors of international competitiveness, namely productivity, labour cost and exchange rate. As a background of such disadvantages, precedent studies pay attention to overvalued exchange rates, factor endowment characterized as labour scarce, and poor business environment, but they seem to provide insufficient explanation.
It is empirically confirmed that exchange rates in SSA countries had been largely misaligned and strongly affected manufacturing exports in the 1970s and 80s, but devaluation of many currencies including CFA franc since the 90s has drastically reduced the degree of misalignment. Therefore, it will not effectively explain the large gaps in manufacturing exports between SSA and other developing countries, which does not shrink even after the 1990s.
High labour cost in SSA countries is consistent with the factor endowment pattern. But empirical studies on African wage suggested that the wage gap with other countries is beyond labour scarcity, and there is robust influence of institutional factors such as a labour union and labour legislation. Factor endowment does not fully explain high labour cost.
Problems in the business environment stemming from poor infrastructure and public services are inferred to push down productivity both directly and indirectly through discouraging investment for technological improvement. However, comparison with Asian low income countries suggested that such countries have also a poor business environment despite much larger manufacturing exports. This suggested no correlation between manufacturing exports and business environment when income level is controlled. The impact of business environment seems not crucial. Detailed analysis based on firm data is necessary to confirm its impact.
On the other hand, wages in the garment industry, which Asian low income countries have competitiveness are significantly lower than wages in SSA countries. Interviews with garment firms also support that high labour cost has a crucial influence on competitiveness, though studies have not
paid sufficient attention yet. Study of its impact on the competitiveness of the African manufacturing sector and background of high wage is strongly needed.
Further, investment from foreign and domestic sources is much smaller in SSA countries than in Asia, despite high marginal return on capital. This conservative investment behavior further reduced investment and technology improvement in the manufacturing sector. Empirical studies reported that foreign direct investment and firm size are associated with productivity and export performance, and experiences of Asian low income countries suggest the importance of foreign direct investment for exports. The background of the conservative investment behavior needs to be investigated.
Given that factor endowment and business environment are not easily modified, hypothesises raised by precedent studies cast strong doubt in the development of the African manufacturing sector. On the contrary if they do not seriously damage the competitiveness of the manufacturing sector as the tentative conclusion of this study shows, there is a good prospect of industrialization in SSA countries. In fact, Lesotho, Kenya and Madagascar were steadily increasing garment exports to US before AGOA was enforced, enhancing competitiveness by devaluation of exchange rates, provision
of attractive investment incentives and improvement of productivity20. To judge whether this growth
trend will continue and to formulate effective industrial policy, precise understanding of the source of stagnation in the African manufacturing sector is crucial. However, neither firm comparison within Africa nor cross-country comparison based on macro data is effective to draw sources of the low performance of African firms. Internationally comparable firm data will bring fruitful analysis.
20
Table 7 shows that these countries had increased exports to US market from 1990 to 99. Madagascar had expanded exports to EU market as well in the same period, mainly due to shift of Mauritian firms to Madagascar.
Appendix: International Competitiveness under Competitive Equilibrium
Assume that exchange rate is determined exogenously, and therefore
e
is given.Product price is equal to marginal cost under competitive equilibrium, then
∗ ∗
=
=
a
w
p
a
w
p
1 1,
2 2 ,where and are price of good 1 and 2, respectively. Wage is equal to marginal product of
labour, 1
p
p
2 ∗ ∗=
=
2 2 1 1,
a
p
w
a
p
w
.Rearranging the above equations, wage ratio is described as
e
p
p
a
a
e
w
w
2 1 1 2⋅
=
∗ ∗ . (5)Then, as relative price of goods is determined between marginal rates of transformation in two countries under equilibrium, we have
2 1 2 1 2 1
a
a
e
p
p
a
a
≥
≥
∗ ∗ .Substituting this to the equation (5), then we obtain the following relationship.
2 2 1 1
a
a
e
w
w
a
a
∗ ∗ ∗≥
≥
. BibliographyAdenikinju, Adeola, Ludvig Södering, Charles Soludo and Aristomène Varoudakis [2002] "Manufacturing
Competitiveness in Africa: Evidence from Cameroon, Cote d'Ivoire, Nigeria, and Senegal," Economic
Development and Cultural Change, Vol.50, No.3.
Acemoglu, Daron, Simon Johnson and James A. Robinson [2001] “The Colonial Origin of Comparative
Development: An Empirical Investigation,” American Economic Review, 91(5), pp.1369-1401.
Balassa, Bela [1990] "Incentive Policies and Export Performance in Sub-Saharan Africa," World Development,
Vol.18, No.3, pp.383-391.
Barr Abigail [2000] “Social Capital and Technical Information Flows in the Ghanaian Manufacturing Sector”, Oxford
Economic Papers 52(3), pp.539-559.
Biggs, Tyler, and Pradeep Srivastava [1996] Structural Aspects of Manufacturing in Sub-Saharan Africa, World
Bank Discussion Paper No.345, Washington D.C.: World Bank.
Biggs, Tyler, Manju Shah and Pradeep Srivastava [1995] Technological Capabilities and Learning in African
Bigsten, Arne [2002], “History and Policy of Manufacturing in Kenya,” in Arne Bigsten and Peter Kimuyu eds.
Structure and Performance of Manufacturing in Kenya, Hampshire: Palgrave.
Bigsten, Arne, Paul Collier, Stefan Dercon, Bernard Gauthier, Jan Willem Gunning, Anders Isaksson, Abena Oduro,
Remco Oostendorp, Cathy Pattilo, Mans Soderbom, Michel Sylvain, Francis Teal and Albert Zeufack [1999]
"Investment in Africa's Manufacturing Sector: A Four Country Panel Data Analysis", Oxford Bulletin of
Economics and Statistics 61(4), pp.489-512.
――――― [2000a] "Rate of Return on Physical and Human Capital in Africa's Manufacturing Sector", Economic Development and Cultural Change 48(4), pp.801-827.
――――― [2000b] Exports and Firm-level Efficiency in African manufacturing, Center for the Study of African Economies Working Paper 2000-16, Oxford University.
Block, Steven A. [2001] “Does Africa Grow Differently?” Journal of Development Economics, 65(2), pp. 443-467.
Bravani, T. A. [1991] "Technical Efficiency in Indian Modern Small Scale Sector: An Application of Frontier
Production Function," Indian Economic Review, Vol.31, pp149-166.
Collier, Paul and Jan Willem Gunning [1999] “Explaining African Economic Performance “, Journal of Economic
Literature 37(1), pp.64-111.
Collier、Paul [1997] "Globalization: Implications for Africa," in Zubair Iqbal and Mohsin S. Khan eds, Trade Reform
and Regional Integration in Africa, Washington D.C.: International Monetary Fund Institute.
Elbadawi, Ibrahim A. [1999] Can Africa Export Manufactures?: The Role of Endowment, Exchange Rates, and
Transaction Cost, Policy Research Working Paper 2120, Washington D.C.; World Bank.
Fafchamps, Marcel [2000] “Ethnicity and Credit in African Manufacturing”, Journal of Development Economics
61(1), pp.205-235.
Fafchamps, Marcel and Remco Oostendorp [2002] "Investment," in Willem Gunning and Remco Oostendorp eds.
[2002] Industrial Change in Africa: Zimbabwean Firms under Structural Adjustment, New York: Palgrave,
pp.153-186.
Gerdin, A. [1997] On Productivity and Growth in Kenya, Ekonomiska Studier utgivna av Nationalekonomiska
institutionen, Handelshogskolan vid Goteborgs Universitet, No. 72, Goteborg.
Ghuna, Dhaneshwar and Thomas J. Grennes [1993] "The Real Exchange Rate and Macroeconomic Performance in
Sub-Saharan Africa," Journal of Development Economics Vol.42, pp.155-174.
Gibbon, Peter [2003] “The African Growth and Opportunity Act and the Global Commodity Chain for Clothing,”
World Development, 31(11).
Granér, Mats and Anders Isaksson [2002] "Export Performance in the Kenyan Manufacturing Sector," in Arne
Bigsten and Peter Kimuyu eds. Structure and Performance of Manufacturing in Kenya, Hampshire: Palgrave.
Harrison, Ann [1994] "Productivity, Imperfect Competition, and Trade Reform: Theory and Evidence," Journal of
International Economics Vol. 36, pp. 53-73.
Hoddinott, John [1996]"Wages and Unemployment in an Urban African Labour Market," Economic Journal 106,
International Labour Organisation [2001] Statistics on Occupational Wages and Hours of Work and on Food Prices,
Geneva: ILO.
Jaspersen, Frederick J., Anthony H. Aylward and A. David Knox [2000] "Risk and Private Investment: Africa and
Other Developing Areas," in Collier, Paul and Catherine Pattillo eds [2000] Investment and Risk in Africa,
London: Macmillan, pp.71-95.
Kalirajan, K.P. and Y.K.Tse [1993] "Technical Efficiency Measures for the Malaysian Food manufacturing
Industry," Developing Economies, Vol.27, pp.174-84.
Lundvall et al. [2002] "Productivity and Technical Efficiency," in Arne Bigsten and Peter Kimuyu eds. Structure and
Performance of Manufacturing in Kenya, Hampshire: Palgrave.
Mauro, Paolo [1995] “Corruption and Growth,” Quarterly Journal of Economics, 110(3), pp.681-712.
Mazumdar, Depak and Ata Mazaheri [2003] The African Manufacturing Firm: An analysis based on firm surveys in
seven countries in sub-Saharan Africa, London: Rutledge.
Mbaye, Ahmadou Aly and Stephen Golub [2003] "Unit Labour Costs, International Competitiveness, and Exports:
The case of Senegal," Journal of African Economies Vol.11 No.2, pp.219-248.
Mlambo, Kupukile [2002] "Productivity Growth and Technical Efficiency in Zimbabwean Manufacturing," in
Willem Gunning and Remco Oostendorp eds. [2002] Industrial Change in Africa: Zimbabwean Firms under
Structural Adjustment, New York: Palgrave, pp.208-231.
Pack, Haward [1987] Productivity, Technology and Industrial Development: A Case Study in Textiles, World Bank
Research Publication, New York: Oxford Press.
Parente, Stephen L. and Edward C. Prescott [2002] Barriers to Riches, Cambridge: The MIT Press.
Pattilo, Catherine [2000] "Risk, Financial Constraints and Equipment Investment in Ghana: A Firm-level Analysis",
in Collier, Paul and Catherine Pattillo, eds [2000] Investment and Risk in Africa, London: Macmillan, pp.96-119.
Pitt, Mark and Lung-fei Lee [1981] "The Measurement and Source of technical Inefficiency in the Indonesian
Weaving Industry," Journal of Development Economics, Vol.9, pp43-64.
Rama, Martin [2000] "Wage Misalignment in CFA Countries: Were Labour Market Policies to Blame?," Journal of
African Economies Vol.9, No.4, pp.475-511.
Ramachandran, Vijaya and Manju Kedia Shah [1999] “Minority Entrepreneurs and Firm Performance in
Sub-Saharan Africa”, Journal of Development Studies 36(2), pp.71-87.
Roberts, M. and Tybout J. [1997] “The Decision to Export in Colombia: An Empirical Model of Entry with Sunk
Cost,” American Economic Review, Vol.87.
Sekkat, K and A. Varoudakis [2000] "Exchange Rate Management and Manufactured Exports in Sub-Saharan
Africa," Journal of Development Economics Vol.61, pp. 237-253
Söderbom, Måns and Francis Teal [2000] "Skills, Investment and Exports from Manufacturing Firms in Africa,"
Journal of Development Studies Vol.37 No.2, pp.13-43.
Söderling, Ludvig [2000] "Dynamics of Export Performance, Productivity and Real Effective Exchange Rate in
Sudou, Hiroyuki [2003] “Floundering Trade and Development in Sub-Saharan Africa: Its Factor Endowment and
Export Substitution Policy,” Africa Report, No.37 (in Japanese).
Teal, Francis [1996]"The Size and Sources of Economic Rents in a Developing Country Manufacturing Lbour
Market," Economic Journal 106, pp963-976.
Teal, Francis [1999] "The Ghanaian Manufacturing Sector 1991-5: Firms Growth, Productivity and Convergence,"
Journal of Development Studies Vol.36 No.1, pp109-127.
Teal, Francis [2000] "Real Wages and the Demand for Skilled and Unskilled Male Labours in Ghana's Manufacturing
Sector: 1991-1995," Journal of Development Economics Vol.61, pp.447-461.
Tybout, James R. [2000] "Manufacturing Firms in Developing Countries: How Well Do They Do, and Why?,"
Journal of Economic Literature Vol.38, pp.11-44.
Tybout, James, Bernard Gauthier, Giorgio Barba Navaretti and Jaime de Melo [1997] "Firm-Level Responses to the
CFA Devaluation in Cameroon," Journal of African Economies Vol.6 No.1 pp.3-34.
Tyler, William and Lung-fei Lee [1979] "On Estimating Stochastic Frontier Production Functions and Average
Efficiency: An Empirical Analysis with Colombian Micro Data," Review of Economics and Statistics, Vol.61,
No.3, pp436-438.
United Nations Industrial Development Organisation [2003] International Yearbook of Industrial Statistics, Vienna:
UNIDO.
Velenchik, Ann D. [1997] "Government Intervention, Efficiency Wages, And the Employer Size Effect in
Zimbabwe," Journal of Development Economics Vol. 53, pp305-338.
Wood, Adrian and Jörg Mayer [2001] "Africa's Export Structure in a Comparative Perspective," Cambridge Journal
of Economics Vol.25 No.3, pp.369-394.
World Bank [2003] World Development Indicators 2003, Washington D.C.: World Bank.
World Bank Institute [2003] Governance Indicators, http://www.worldbank.org/wbi/governance/govdata2002/.

![Table 4 Determinants of Productivity Biggs et al [1995] Ghana, Kenya, Zimbabwe Mlambo [2002] Zimbabwe Lundvall et al](https://thumb-ap.123doks.com/thumbv2/123deta/9911054.1378552/11.892.114.841.414.881/table-determinants-productivity-biggs-zimbabwe-mlambo-zimbabwe-lundvall.webp)