Did the least developed countries benefit from
duty-free quota-free access to the Japanese
market?
著者
Ito Tadashi
権利
Copyrights 日本貿易振興機構(ジェトロ)アジア
経済研究所 / Institute of Developing
Economies, Japan External Trade Organization
(IDE-JETRO) http://www.ide.go.jp
journal or
publication title
IDE Discussion Paper
volume
434
year
2013-12-01
INSTITUTE OF DEVELOPING ECONOMIES
IDE Discussion Papers are preliminary materials circulated to stimulate discussions and critical comments
Keywords: LDCs, Japan, Tariff liberalisation, Duty-free quota-free access, WTO Doha Round JEL classification: F13, F14
◆ Corresponding author: Faculty of International Social Sciences, Gakushuin University, Mejiro 1-5-1, Toshima-ku, Tokyo, Japan; tadashi.itoATgakushuin.ac.jp or Tadashi.ItoATgraduateinstitute.ch. In preparing this paper, I benefited from discussion with Richard Baldwin, Hiroshi Mukunoki, Hiroshi Sato, Akiko Yanai, Takahiro Fukunishi, Toshiyuki Matsuura, Kazunobu Hayakawa, Pierre-Louis Vézina, Solleder Olga, and Andreas Lendle. This paper was done as a part of a study program at the Institute of Developing Economies, when I was affiliated there.
* Fuji Chimera Institute, 1-5, Kodenmacho, Nihonbashi, Chuou-ku, Tokyo 105-0001, Japan: [email protected]
IDE DISCUSSION PAPER No. 434
Did the least developed countries benefit
from duty-free quota-free access to the
Japanese market?
Tadashi Ito
♦, Takahide Aoyagi*
December 2012
Revised September 2017
Abstract
Countries classified as least developed countries (LDCs) were granted duty-free quota-free (DFQF) access to the Japanese market. This study examines the impact of that access and finds that, in general, it benefited the LDCs. The construction of concordance tables for Japan's 9-digit tariff line codes over 19 years enables analyses at the tariff line level, which overcomes a possible aggregation bias. The exogenous nature of DFQF access mitigates the endogeneity problem. The triple difference estimator shows that in general the LDCs benefited from DFQF access to the Japanese market. Tariff lines which were granted zero tariffs and substantial preference margins over other countries resulted in successful import into the Japanese market.
The Institute of Developing Economies (IDE) is a semigovernmental, nonpartisan, nonprofit research institute, founded in 1958. The Institute merged with the Japan External Trade Organization (JETRO) on July 1, 1998.
The Institute conducts basic and comprehensive studies on economic and related affairs in all developing countries and regions, including Asia, the Middle East, Africa, Latin America, Oceania, and Eastern Europe.
The views expressed in this publication are those of the author(s). Publication does not imply endorsement by the Institute of Developing Economies of any of the views expressed within.
INSTITUTE OF DEVELOPING ECONOMIES (IDE), JETRO 3-2-2, WAKABA,MIHAMA-KU,CHIBA-SHI
CHIBA 261-8545, JAPAN
©2013, 2017 by Institute of Developing Economies, JETRO
No part of this publication may be reproduced without the prior permission of the IDE-JETRO.
1
Did the least developed countries benefit from duty-free
quota-free access to the Japanese market?
Tadashi Ito♦, Takahide Aoyagi*
First draft: December 2012, This revised draft: September 2017
Abstract:
Countries classified as least developed countries (LDCs) were granted duty-free quota-free (DFQF) access to the Japanese market. This study examines the impact of that access and finds that, in general, it benefited the LDCs. The construction of concordance tables for Japan's 9-digit tariff line codes over 19 years enables analyses at the tariff line level, which overcomes a possible aggregation bias. The exogenous nature of DFQF access mitigates the endogeneity problem. The triple difference estimator shows that in general the LDCs benefited from DFQF access to the Japanese market. Tariff lines which were granted zero tariffs and substantial preference margins over other countries resulted in successful import into the Japanese market.
Key words: LDCs, Japan, Tariff liberalisation, Duty-free quota-free access, WTO Doha
Round
JEL Classification:F13, F14
◆
Corresponding author: Faculty of International Social Sciences, Gakushuin University, Mejiro 1-5-1, Toshima-ku, Tokyo, Japan; tadashi.itoATgakushuin.ac.jp or Tadashi.ItoATgraduateinstitute.ch. In preparing this paper, I benefited from discussion with Richard Baldwin, Hiroshi Mukunoki, Hiroshi Sato, Akiko Yanai, Takahiro Fukunishi, Toshiyuki Matsuura, Kazunobu Hayakawa, Pierre-Louis Vézina, Solleder Olga, and Andreas Lendle. This paper was done as a part of a study program at the Institute of Developing Economies, when I was affiliated there.
*
Fuji Chimera Institute, 1-5, Kodenmacho, Nihonbashi, Chuou-ku, Tokyo 105-0001, Japan: [email protected]
2
1. I
NTRODUCTIONConflict of interests among World Trade Organization (WTO) member countries have bogged down the Doha Development Round of trade negotiations on major issues such as agriculture, industrial tariffs and nontariff barriers, services, and trade remedies. Started in 2001 at Doha, the round has yet to yield a major agreement. The impasse is so serious that in April 2011, then the WTO Director-General Pascal Lamy "asked members to think hard about 'the consequences of throwing away ten years of solid multilateral work. "Although considerable time and effort has been spent on issues such as agriculture, a key focus of the Doha Round is development. Indeed, one of the few achievements of the Doha round is the duty-free quota-free (DFQF) market access granted by developed countries to products from the least developed countries (LDCs). The Hong Kong Ministerial Declaration of 18 December 2005 says that
“…developed-country Members, and developing-country Members declaring themselves in a position to do so, agree to implement duty-free and quota-free market access for products originating from LDCs ….”
At the time of the declaration, the European Union had already begun to grant preferential tariffs to LDC countries under “Everything But Arms” initiatives, and the United States had been offering similar terms to Sub-Saharan African countries under the African Growth and Opportunity Act (AGOA). Japan started to grant zero tariffs to LDCs from around 2000 and accelerated the pace of this at around 2005.
This study evaluates whether Japan's DFQF access has favourably affected LDC exports to Japan. Analysis is performed at the tariff line level by constructing concordance tables for 9-digit tariff line codes. While most evaluations of trade liberalisation policies, and especially of preferential trade
3
agreements, struggle with endogeneity, DFQF systems have an inherently low level of endogeneity because of their exogenous nature.1
Literature
In terms of the impact of the WTO-led trade liberalisation on the LDCs, previous literature has dealt almost exclusively with possible preference erosion for LDCs. When the Doha Round started in 2001, its aims were across-the-board trade liberalisation. However, LDCs were afraid that the trade preferences they had been enjoying would be eroded as tariffs for other countries were decreased by Doha Round negotiation. In response to this fear, some economists used the Computable General Equilibrium model to study the potential effects of preference erosion; two such studies are Low, Piermartini, and Richtering (2006) and Carrère and de Melo (2009). However, the Doha Round is stalled, and across-the-board tariff liberalisation is far from being achieved. On the other hand, on the front of development issue of the Doha round, the developed countries agreed to grant duty-free quota-free access to the LDCs.2 By 2008, developed countries’ DFQF treatment for LDCs reached
almost 100 percent product coverage. This has provided sufficient data for ex-post analysis. To the best of our knowledge, this paper is the first attempt to carry out an ex-post assessment of the DFQF treatment agreed in the Hong Kong ministerial declaration. One ex-post analysis of the effect of a system similar to the DFQF is the study by Frazer and Van Biesebroeck (2010); their study examines the effect of the AGOA. However, AGOA’s tariff elimination scheme is different from the DFQF scheme in that AGOA is selective on both countries and products. Eligibility for AGOA requires a basic level of political and democratic freedom within the country. In terms of eligible
1 See Baier and Bergstrand (2007) for example for the endogeneity issues related to the evaluation
study of Preferential Trade Agreement. Various attempts to address the endogeneity issues are neatly and well explained in Egger, Egger and Greenaway (2008).
2 An ex-ante analysis on potential benefits from preferential tariffs given to the LDCs by EU under
EBA was done by Hoekman, Ng, and Olarreaga (2002); their analysis uses partial equilibrium simulation. They showed that EBA would induce larger exports from LDCs to the EU market at the expense of other developing countries.
4
products, “the AGOA legislation explicitly allows the president only to grant duty-free treatment for non-apparel articles ‘after the U.S. Trade Representative and the U.S. International Trade
Commission have determined that the article is not import sensitive when imported from African countries…’” (Frazer and Van Biesebroeck (2010)). Frazer and Van Biesebroeck (2010) mention this selection issue as a limitation in their study.
2. D
ATAThis paper uses Japan’s annual tariff data at the tariff line level (HS 9-digit code) from World Integrated Trade Solutions and the corresponding trade (import) data from Japan’s customs office. The period of study is from 1996 to 2014. The year 1996 was chosen as the starting year because Japan began to grant zero tariffs to LDCs from around the year 2000. More reasons for this choice of period are discussed later in the text.
2.1.
Tariff data
It is important to include not only advalorem tariffs but also ad-valorem equivalent tariffs, which can be estimated for non-advalorem tariffs. Developed countries have been reducing the number of non-advalorem tariffs, the majority of which are specific tariffs, by changing them to advalorem tariffs in accordance with WTO member consensus. However, many non-advalorem tariffs remain in effect. Because the DFQF agreements cover essentially all tariff line codes, there are many tariff line codes for which tariffs have been eliminated for LDCs; however, non-advalorem tariffs remain in effect for the other countries. Thus, to evaluate the effects of the DFQF agreements, it is
necessary to simulate advalorem equivalent tariffs to extant advalorem tariffs. For
non-advalorem tariffs, non-advalorem equivalent tariffs computed by UNCTAD 1 are used.3
3 UNCTAD 1 is the first in a list of methods suggested by the United Nations Conference on Trade
and Development for computing ad valorem tariff equivalents. This method was chosen from among four suggested methods to calculate advalorem equivalent tariffs because UNCTAD 1 produces advalorem equivalent tariffs for the largest number of tariff lines.
5 2.2.
Concordance
A major challenge arises when one attempts to perform analyses across highly disaggregated levels, such as the 9-digit level of this study. Since the Harmonised System (HS) (at the 6-digit level) changes on average every five years4, Japan’s 9-digit codes also change to remain in conformity
with the HS.5 Thus, in order to track the same product (i.e., tariff line), we need to make
concordance across codes in different years. Concordance lists of different (9-digit) HS codes are available from the Customs office, Ministry of Finance, Japan, but it is just concordance lists not concordance tables. Thus, we have created concordance tables for Japan’s 9-digit code lines by checking the obsolete-new concordance lists one at a time; this is almost certainly the first such attempt, one of our achievements in this study. Adjusting the algorism proposed by Schott and Pierce (2011) for the US customs codes to our dataset, we concord Japan’s 9-digit HS codes over years. The details for the need of concordance algorism and the procedures are in the appendix. If only those tariff line codes which have an identical code number throughout the years of 1996 to 2014 are used, only 3564 codes out of total number of 9000 codes are left. By using the
concordance tables we have constructed by the algorism, we can keep almost all codes. Some codes are still dropped. This is because some codes are intrinsically unable to be concorded for reasons such as the unknown goods and the ambiguously defined goods.
2.3.
Trade data
Japan’s trade data cover all transactions at the 9-digit level whose amounts are more than or equal to 210000 yen (approximately 2100 US dollars) for all partner countries. Thus, these data cover most commercial trades of Japan. Taiwan is a major trading partner for Japan, and the data cover
4 To be precise, the HS codes changed in 1992, 1996, 2002, 2007 and 2012.
5 The first 6 digits are common across all countries (internationally harmonised), and further
6
trade with Taiwan even though UN COMTRADE data do not cover Taiwan. Data at the 9-digit level are available from 1988. In the analyses that follow, the whole available period (1988–2014) was used when consistent tariff lines were not required, and the period of 1996–2014 was used when consistent tariff lines were required. The concordance has not been extended back to HS 1992 or HS 1988 because the benefit to be gained by doing so is far exceeded by the cost of the
extension. To extend the period covered by the concordances would necessitate construction of concordance tables for HS 1996 - HS 1992 and HS 1992 - HS1988. This would further unavoidably decrease the number of tariff lines to be studied due to intrinsically non-concordable lines between different HS versions. Briefly, a longer study period reduces the number of feasible tariff line codes. For the purposes of this study, extending the concordances offers little benefit because the change of the zero tariff lines took place in the period 1996–2011.
3. D
ESCRIPTIVEA
NALYSISThis section discusses descriptive properties of changes in the number of zero tariff lines by country group (according to tariff type), the evolution of import values by country group, preference
margins, evolution of import values by preference margins, and the incidence of imports, by tariff line, from LDCs.
3.1.
Evolution of zero tariffs
Figure 1 shows time-series of the total number of tariff lines whose tariffs are zero. Japan’s tariff can be grouped into four large categories: most favoured nation (MFN) tariffs, Generalized System of Preferences (GSP) tariffs; GSP tariffs applied to LDCs (LDC-GSP); and tariffs for free trade agreement (FTA) partners. MFN tariffs are imposed on most of Japan’s imports. For WTO members who are developing countries, Japan (and other developed countries) gives preferential tariffs under
7
the GSP. Among the major trading partners of Japan, China is a notable example of a GSP beneficiary. Under the DFQF system, LDCs receive the most preferential treatment.6
The change to zero tariff lines for FTA partners is not shown in the figure. Although Japan has signed FTAs with several countries, tariff eliminations for FTA partners have either been completed only recently or are still in the process; moreover, Japan’s trade level with its FTA partners is still small. From Figure 1, it is evident that Japan accelerated the elimination of tariffs for LDCs shortly before 2000, eliminated a substantial number of tariffs in 2001, and then in 2007 expanded the zero tariff lines to almost 100% of tariff lines. LDC countries currently enjoy about 3500 more zero tariff lines than GSP beneficiaries and about 5000 more zero tariff lines than MFN countries. As the total number of tariff lines is about 9000, this preference is substantial.
=== Figure 1 ===
3.2.
Import value by country group
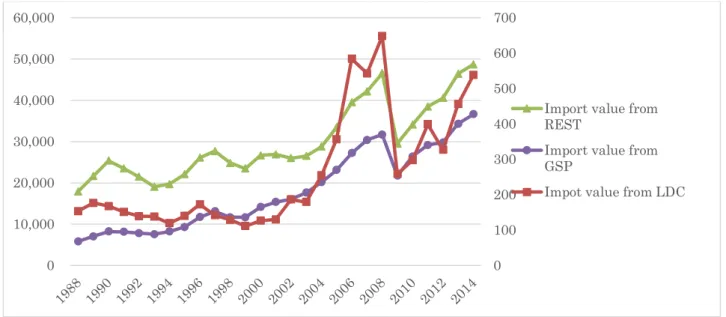
Import values by country group are shown in Figure2. The three main country groups are LDCs, GSP beneficiary countries, and the rest of the world (REST). REST is almost identical to MFN because almost all of Japan’s trading partners are WTO members. Russia is an exception. However, Russia ranks only 20th among import partners of Japan and accounts for only 1.52%, on average, of the
import values in the period of study. Import value from LDCs is substantially lower than from the REST and GSP groups, so the value from LDCs is indicated by the right axis. The right axis has a much smaller scale than the left axis, which corresponds to the MFN and GSP groups. Import value from all country groups increased steadily until 2008; in 2009, the value decreased due to the trade collapse caused by the global financial crisis. It is worth noting that the growth of import value from LDCs between 2003 and 2008 is higher than from the MFN or GSP groups. Since the GSP group
8
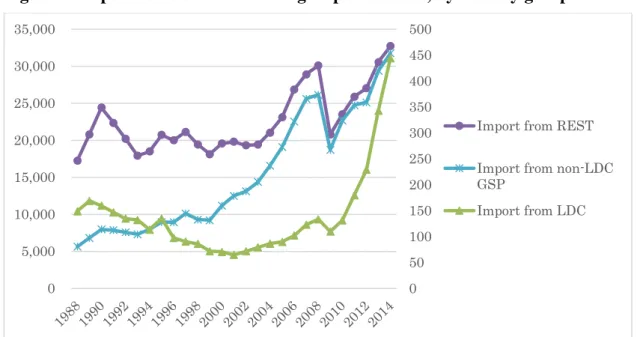
includes large and rapidly expanding BRIC countries (BRICs: Brazil, Russia, India, and China; Russia is not in the GSP group), Figure 3 shows import value with BRIC countries separately. The results with BRIC countries excluded (Figure 3) are qualitatively similar to the results with them included (Figure 2).
=== Figure 2 & Figure 3 === 3.3.
Preference margins
The LDCs enjoy a substantially larger number of zero tariff lines than other countries, and it is also important to examine the magnitude of the preference margins. The 9-digit tariff code which corresponds to the largest preference margin for LDCs is 121299190, “Tubers of konnyaku (Amorphophalus, whether or not cut, dried or powdered),” with a preference margin of 5537.27%. One hundred 9-digit tariff lines have preference margins of more than 100%. These extremely large preferences may enable LDCs to begin exporting the preferentially treated goods to the Japanese market. Table 1 shows the number of tariff line codes for which the preference margin exceeds 10% or 20%. For example, 1081 tariff line codes correspond to products for which LDCs have preference margins of more than 10% with respect to GSP beneficiary countries.
=== Table 1 ===
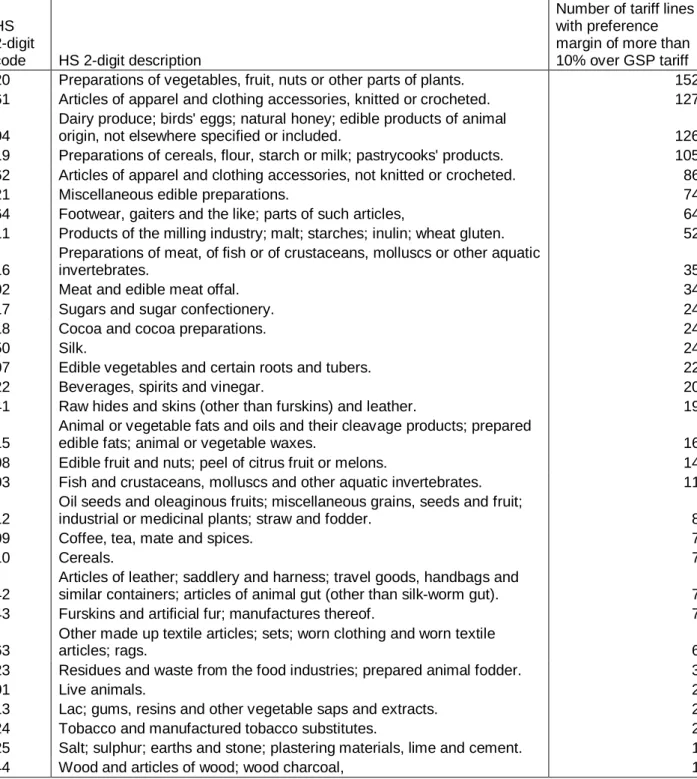
Because goods from LDC are limited in scope (e.g., they do not produce sophisticated industrial goods), it is worth investigating which industries are subject to preference margins. As Table 2 shows, most products are in the Food industry or the Apparel and Textiles industry, in which the LDCs are likely to have comparative advantages. Thus, the DFQF system may have a large impact on LDC exports to the Japanese market.
9
3.4.
Import value by country group and product group
To identify the effect of the DFQF system, tariff line codes are divided into two groups. The treated group is the group of codes for which positive number of tariff rates were applied in 1996 but became zero by the year 2008.7 The non-treated group (control group) is the group of codes for which tariffs
were already zero in 1996. By comparing import value between these two groups and across country group, we can see whether the DFQF system seems to have had a positive impact on LDCs’ exports to Japan. Figures 4 and 5 show the results for non-treated (control) group products and treated group products, respectively. For non-treated (control) group products, the import values from REST and the non-LDC GSP steadily increased from 2001 to 2008 whereas the import value from the LDCs increased only modestly in that period. After the drop in 2009 due to the global financial crisis, the import values from all the three country groups rose but especially from the LDCs. On the other hand, in the case of the treated group products, the import value from the LDCs steeply increased from 2001 to 2008, more than from REST and much more than from the non-LDC GDP. After the drop in 2009, the import values from the rest of the world and the non-LDC GSP almost recovered the pre-financial crisis level by 2014, but that from the LDCs did not. The preference margins granted by the DFQF scheme seem to have a positive impact on LDC countries’ exports to Japan in 2001-2008, pre-financial crisis, but the negative impact of the pre-financial crisis lingered.
=== Figure 4 & Figure 5 === 3.5.
Incidence of imports
The previous section studies the import values, what the literature calls “intensive margins”. The DFQF system might also have induced some products to be exported for the first time, what the literature calls “extensive margins”. Because LDCs are small and very poor (on average, GDP per
7The year 2008 was chosen because Japan's zero tariffication was almost completed by that year.
10
capita of less than 905 US dollars), even a small amount of exports is important especially when a product is exported for the first time. Table 3 shows the number of tariff lines imported, counting duplicates, into the Japanese market by country group and by tariff line group. If two products are both imported into Japan from two countries, the number recorded is four (i.e., 2 ×2). If each of 116 products is imported only from one country, the number is 116. As Table 3 show, within the treated lines, whereas the number changed little for REST (the rest of the world) and the number gradually increased for non-LDC GSP, the increase for the LDC is substantial. The number almost tripled over the years. These results indicate that the DFQF had a positive effect on the “extensive margin”.
=== Table 3 ===
4. E
CONOMETRICA
NALYSISThis section contains a quantitative analysis of the same data used in the descriptive analysis of section 3. This is a case of the program evaluation in the econometrics literature. The program evaluation is usually expressed in the following equation.
(
1 0 1)
(
1 1) (
0 1)
E Y −Y D= =E Y D= −E Y D=
The left-hand side is the Average Treatment effect on the Treated (ATT). The first term in the right-hand side is the mean value (import value in our study) for the countries or products selected; the rightmost term contains the mean value for the country or product as if it had not been selected. That is, the rightmost term is the counterfactual. The first term in the right-hand side is observable, but the second term is not. If E Y D
(
0 = =1)
E Y D(
0 =0)
holds, then ordinary least squares estimation will yield an unbiased estimate. If this equality does not hold, then endogeneity as a consequence of selection becomes a problem; this necessitates careful handling of endogeneity. However, a complete solution of the endogeneity issue is almost always a difficult task, due to unavailability of good11
instrumental variables which satisfies various conditions for good IVs, such as high correlation with the variables to be instrumented or the exclusion restrictions.
Most program evaluation studies examine programs with endogenously given criteria, such as impact studies of preferential trade agreements. LDC status, however, is exogenously decided. Specifically, Japan did not choose which countries are eligible for the DFQF program. Japan is required to grant DFQF treatment to all LDCs. Tariff lines to be liberalised are also not selected. Thus, the DFQF system has the virtue of being almost free from the endogeneity issue. This makes OLS an appropriate estimation method for this study.
We apply the triple difference estimator (i.e., difference-in-difference-in-difference), as is done by Frazer and Van Biesebroeck (2010). The estimation model is:
0 1 2 3 4 Im * * Pr Pr Pr ijt t i j it jt ij ijt
portValue Ineffect LDC Treated oduct CountryPeriod
oductPeriod Country oduct
β β β β β ε = + + + + +
For triple difference analysis, the time dimension (year) is collapsed into two periods: one for the years from 1996 to 2000; the other for the years from 2001 to 2014. This allows the analysis to fully exploit the exogenous nature of Japan's DFQF system since the zero tariffication was gradually done from 2001 onward. The variable of interest is the triple interaction term,
* * Pr
t i j
Ineffect LDC Treated oduct . Here, Ineffecttis a dummy variable which switches from 0 to 1
for all countries and products after 2001; LDCiis a dummy variable which takes value 1 if the importer is an LDC country and 0 otherwise; TreatedProductj is a dummy variable which takes value 1 for those products that are treated in the sense previously described and otherwise takes value 0.Three interactive fixed effects allow for (a) the base level of imports of any product from any country ( CountryProductij ), (b) the overall imports from any country into Japan in any period(CountryPeriodit), and (c) the overall imports of any product into Japan in any period
12
(ProductPeriodjt). There is no need to include uninteracted variables because those effects are absorbed into the three interactive fixed effects. The estimation result is in Table 4 The first column shows a statistically significant positive coefficient of 0.457, indicating that the DFQF initiative had positive impacts on LDCs’ exports to Japan.
Because Japan is far from most LDC countries, the effect of Japan’s DFQF system might be different between Asian LDCs and non-Asian LDCs, which are almost exclusively located in Sub-Saharan Africa. Thus, the estimation was performed with the Asian LDC dummy; results are shown in the second column of Table 4. The coefficient estimate for Asian LDC treatment is positive and statistically significant. The effect for Asian LDCs is more positive and statistically significant than the effect for LDCs without Asian countries. The total effect of the DFQF initiative for Asian LDCs is 0.231+0.397=0.628).
=== Table 4 ===
5. R
OBUSTNESSC
HECKS OFT
RIPLED
IFFERENCEE
STIMATIONThe result in Table 4 seems to square the prediction that the LDCs benefited from DFQF access to the Japanese market, especially Asian LDCs because of their geographical proximity. To check the robustness of the result in Table 4, we have performed the same triple difference estimation, with some changes in the time dimension (year) and tariff lines. First, different time periods from the above bench-mark triple difference estimator are taken. Now, the time is divided into the one for the years from 1996 to 2005 and the other for the years from 2006 to 2014 (column (i) of Table 5), as the DFQF initiative was agreed in December 2005. Second, MFN tariff lines which have zero tariff rates were dropped from the dataset. For products whose MFN tariffs are zero, there is no preference for LDCs (column (ii) of Table 5). Third, both changes, i.e., the newly defined time dimension (year) and the tariff lines excluding zero MFN rate goods are incorporated. (column (iii) of Table 5).
13
With the altered time period, the coefficient estimate for LDC treatment remains statistically significant and positive, but with a smaller magnitude (column (i) of Table 5). The coefficient estimate is now 0.160 while it is 0.457 in the benchmark case (Table 4). When we add Asian LDC treatment, the coefficient estimate for Asian LDC treatment is positive and statistically significant while the coefficient estimate for LDC treatment covariate turns insignificant. These results seem compatible with the descriptive analyses in Figure 4 and Figure 5, in which the positive impact of DFQF initiative seems to have taken place in 2001-2008 period, rather than the later period. Turning our eyes to products without zero MFNs, the estimation (ii), the estimation results are almost the same with the benchmark results in Table 4. Estimation (iii) shows similar results to those in (i).
6. C
ONCLUSIONThis study evaluates the impact of the DFQF access given to LDCs by Japan. The construction of concordance tables and algorism for Japan's 9-digit tariff line codes for a 19-year period makes feasible an analysis at the tariff line level and thereby overcomes a possible aggregation bias. The exogenous nature of DFQF access alleviates potential endogeneity problems. We show that Japan granted the duty-free quota-free (DFQF) access to the LDC countries for all products by the year 2008. The triple difference estimator shows that LDCs, especially Asian LDCs, benefited from DFQF access to the Japanese market. Namely, tariff lines which were granted zero tariffs and substantial preference margins over other countries resulted in successful imports into the Japanese market. The effect is especially prominent for the pre-financial crisis period and for the Asian LDC countries. We conjecture that the stronger effect on the Asian LDC countries is attributable to other assistance of technical (trade procedures) or physical (infrastructures) by the Japanese government to the Asian countries, but are left to be investigated in future research.
14
R
EFERENCESBaier, Scott L., Bergstrand, Jeffrey H., 2007. Do free trade agreements actually increase members'international trade?, Journal of International Economics 71 (2007) 72–95
Carrère, Céline., de Melo, Jaime., 2009.The Doha Round and Market Access for LDCs: Scenarios ffor the EU and US Markets, Working paper E 2009.11 CERDI
Egger, Hartmut., Egger, Peter., and Greenaway, David.,2008. The trade structure effects of endogenous regional trade agreements, Journal of International Economics 74 (2008) 278–298 Frazer, Garth., Van Biesebroeck, Johannes., 2010. Trade and Growth Under the African Growth
and Opportunity Act., The Review of Economics and Statistics, February 2010, 92(1): 128–144 Hoekman, Bernard., Ng, Francis., Olarreaga, Marcelo., 2002. Eliminating Excessive Tariffs on
Exports of Least Developed Countries, World Bank Economic Review (2002) 16 (1): 1-21 Pierce, Justin R., and Schott, Peter K..2009, Concording U.S. Harmonized System Categories Over
Time", NBER working paper 14837.
Low, Patcick., Piermartini, Roberta., Richtering, Jurgen. Non-Reciprocal Preference Erosion Arising From MFN Liberalitzation in Agriculture: What Are the Risks?, WTO Staff Working Paper ERSD-2006-02.
15 Figure 1: Number of zero tariff lines by year
Source: Author’s computation from tariff data.
0 2,000 4,000 6,000 8,000 10,000 12,000
Total number of tariff lines Zero tariff - MFN
Zero tariff - nonLDC GSP Zero tariff - LDC
16 Figure 2: Import value by country group and year
Source: Author’s computation from tariff and trade data.
Figure 3: Import value by country group and year with BRICs separated
Source: Author’s computation from tariff and trade data
0 100 200 300 400 500 600 700 0 10,000 20,000 30,000 40,000 50,000 60,000
Import value from REST
Import value from GSP
Impot value from LDC
0 100 200 300 400 500 600 700 0 5,000 10,000 15,000 20,000 25,000 30,000 35,000 40,000 45,000 50,000 1988 1989 1990 1991 1992 1993 1994 1995 1996 1997 1998 1999 2000 2001 2002 2003 2004 2005 2006 2007 2008 2009 2010 2011 2012 2013 2014
Import value from BRICs
Import value from REST(excluding BRICs)
Import value from non-LDC GSP (excluding BRICs) Import value from LDC
17
Figure 4: Import value of non-treated group tariff lines, by country group
Source: Author’s computation from tariff and trade data
Figure 5: Import value of treated group tariff lines, by country group
Source: Author’s computation from tariff and trade data
Table 1: Number of tariff lines with more than 10% or20% preference margin
Source: Author’s computation from tariff data.
0 50 100 150 200 250 300 350 400 450 500 0 5,000 10,000 15,000 20,000 25,000 30,000 35,000
Import from REST Import from non-LDC GSP Import from LDC 0 100 200 300 400 500 600 0 2,000 4,000 6,000 8,000 10,000 12,000 14,000 16,000 18,000
Import from REST Import from non-LDC GSP
Import from LDC
Over MFN tariff Over GSP tariff Margin>20% 596 566 Margin>10% 1209 1081
18
Table 2: Number of tariff lines with more than 10% preference margin, by industry
HS 2-digit
code HS 2-digit description
Number of tariff lines with preference margin of more than 10% over GSP tariff 20 Preparations of vegetables, fruit, nuts or other parts of plants. 152 61 Articles of apparel and clothing accessories, knitted or crocheted. 127 04
Dairy produce; birds' eggs; natural honey; edible products of animal
origin, not elsewhere specified or included. 126 19 Preparations of cereals, flour, starch or milk; pastrycooks' products. 105 62 Articles of apparel and clothing accessories, not knitted or crocheted. 86
21 Miscellaneous edible preparations. 74
64 Footwear, gaiters and the like; parts of such articles, 64 11 Products of the milling industry; malt; starches; inulin; wheat gluten. 52 16
Preparations of meat, of fish or of crustaceans, molluscs or other aquatic
invertebrates. 35
02 Meat and edible meat offal. 34
17 Sugars and sugar confectionery. 24
18 Cocoa and cocoa preparations. 24
50 Silk. 24
07 Edible vegetables and certain roots and tubers. 22
22 Beverages, spirits and vinegar. 20
41 Raw hides and skins (other than furskins) and leather. 19 15
Animal or vegetable fats and oils and their cleavage products; prepared
edible fats; animal or vegetable waxes. 16
08 Edible fruit and nuts; peel of citrus fruit or melons. 14 03 Fish and crustaceans, molluscs and other aquatic invertebrates. 11 12
Oil seeds and oleaginous fruits; miscellaneous grains, seeds and fruit;
industrial or medicinal plants; straw and fodder. 8
09 Coffee, tea, mate and spices. 7
10 Cereals. 7
42
Articles of leather; saddlery and harness; travel goods, handbags and
similar containers; articles of animal gut (other than silk-worm gut). 7 43 Furskins and artificial fur; manufactures thereof. 7 63
Other made up textile articles; sets; worn clothing and worn textile
articles; rags. 6
23 Residues and waste from the food industries; prepared animal fodder. 3
01 Live animals. 2
13 Lac; gums, resins and other vegetable saps and extracts. 2 24 Tobacco and manufactured tobacco substitutes. 2 25 Salt; sulphur; earths and stone; plastering materials, lime and cement. 1
44 Wood and articles of wood; wood charcoal, 1
19
Table 3: Number of tariff lines, with duplicates, imported into Japan
Source: Author’s computation from tariff data.
How many tariff lines were imported (running number)
years Treated lines Untreated lines Treated lines Untreated lines Treated lines Untreated lines
1996 56 477 1428 13317 3368 39291 1997 47 549 1450 14092 3392 39774 1998 59 568 1411 13803 3323 38951 1999 54 649 1481 14016 3311 38205 2000 62 689 1558 14882 3434 38996 2001 60 722 1643 15481 3517 39859 2002 66 737 1726 15678 3457 39798 2003 63 706 1741 16076 3470 39943 2004 61 779 1797 16667 3454 40426 2005 88 816 1945 17219 3461 40728 2006 72 851 1878 17507 3494 40754 2007 83 846 1870 17691 3402 40658 2008 90 869 1846 17686 3210 39379 2009 91 852 1789 16756 3092 36701 2010 95 894 1805 17011 3127 36850 2011 113 962 1822 17557 3192 37364 2012 104 1114 1898 17943 3256 37182 2013 130 1251 1937 18357 3356 38586 2014 141 1339 1966 18671 3415 38899 LDC non-LDC GSP REST
20 Table 4: Estimation result of triple difference
Source: Author’s computation from tariff data.
Table 5: Robustness check of triple difference analysis
Source: Author’s computation from tariff data.
(1) (2)
Ineffect_LDC_Treated 0.457*** 0.231***
(20.53) (6.91)
lneffect_AsianLDC_Treated 0.397***
(8.87)
Country period dummy Yes Yes
Product period dummy Yes Yes
Country product dummy Yes Yes
R-squared 0.894 0.894
Number of observations 1563745 1563745
t statistics in parentheses
* p < 0.10, ** p < 0.05, *** p < 0.01
(i) (ii) (iii)
(1) (2) (3) (4) (5) (6) lneffect_LDC 0.160*** 0.0446 0.469*** 0.294*** 0.117*** 0.0497 treated (6.91) (1.29) (21.55) (9.02) (5.17) (1.47) lneffect_AsianLDC 0.203*** 0.302*** 0.117** treated (4.37) (6.91) (2.57) Country period
dummy Yes Yes Yes Yes Yes Yes
Product period
dummy Yes Yes Yes Yes Yes Yes
Country product
dummy Yes Yes Yes Yes Yes Yes
R-squared 0.887 0.887 0.894 0.894 0.887 0.887 Number of observations 1563745 1563745 1128081 1128081 1127999 1127999 t statistics in parentheses * p < 0.10, ** p < 0.05, *** p < 0.01
21
A
PPENDIX9-digit code concordance
We need to track Japan’s 9-digit tariff codes that change every year. Adjusting the concordance algorism originally proposed by Pierce and Schott (2009) for US tariff codes to our case of the Japanese HS codes, we have made concordance table over years. Pierce and Schott (2009) refers HS codes concordance relationship as “family trees”, which can be described as the appendix figure 1 and 2 below.
a
b
c
d
e
f
g
t
t+1
t+2
t
t+1
t+2
g
e
f
a
b
c
d
Appendix figure 1: Growing family tree
22
As these figures illustrate, there are some codes which disappear and others which appear over years, which are called “obsolete” codes and “new” codes, respectively. In the case of the US, the US customs office prepares the obsolete-new tables over years. Our first task was to construct the obsolete-new tables for the Japanese case. Obsolete-new list for a single year is gone public by Japan customs, under the Ministry of Finance. But these Obsolete-new lists simply show which HS codes are generated (“new”) or which are deleted (obsolete). Therefore, we painstakingly checked HS codes one by one and made obsolete-new comparison tables over years.
While there are about 9000 HS 9-digit codes for each year before concordance, in the process of concordance, many codes are grouped into “code families”, and thus we are left with approximately 8000 tariff lines over 19 years (1996-2014) after the concordance, and there are about 1000 tariff lines in every year that are the candidate of concordance HS codes.
However, if we limit our analysis to periods within the same HS version, such as HS 2002, which covers 2002–2006, or HS 2007, which covers 2007–2011, substantially more than 8000 tariff line codes remain. Our investigation on the number of consistent tariff line codes between two subsequent years has shown that within the same HS version, the matching rate is about 99%; this rate drops to about 75-80% between years belonging to two different HS versions, such as 2001 and 2002. To strike a balance between the benefits and costs of concordance, this paper has made concordance tables between 1996 - 2014 (which uses HS concordance table from HS1996 to 2002, 2002 to 2006, 2006 to 2007, and Japanese 9 digit’s HS obsolete-new lists by every year). Among years within the same HS version, only the matched codes are kept.
More in-depth explanation for the algorism and procedures can be provided upon request to the authors.
23 List of LDC countries Angola Mali Bangladesh Mauritania Benin Mozambique Bhutan Myanmar
Burkina Faso Nepal
Burundi Niger
Cambodia Rwanda
Central African Republic Samoa
Chad Sao Tome and Principe
Union of Comoros Senegal Democratic Republic of Congo Sierra Leone Djibouti Commonwealth of Dominica Solomon Islands Equatorial Guinea Somalia
Eritrea Sudan
Ethiopia Tanzania
Gambia Timor Leste
Guinea Togo Guinea-Bissau Tuvalu Haiti Uganda Kiribati Vanuatu Laos Yemen Lesotho Zambia Liberia Madagascar Malawi
24
List of GSP beneficiary countries
Afghanistan Gambia Niue
Albania Georgia Pakistan
Algeria Ghana Palau
American Samoa Gibraltar Panama
Angola Grenada Papua New Guinea
Antigua and Barbuda Guatemala Paraguay
Argentina Guinea Peru
Armenia Guinea-Bissau Philippines
Azerbaijan Guyana Rwanda
Bangladesh Haiti Samoa
Belarus Honduras Sao Tome and Principe
Belize India Senegal
Benin Indonesia Serbia
Bhutan Iran Seychelles
Bolivia Iraq Sierra Leone
Bosnia and Herzegovina Côte d’Ivoire Solomon Islands
Botswana Jamaica Somalia
Brazil Jordan South Africa
British Anguila Kazakhstan Sri Lanka
British Virgin Islands Kenya St. Christopher and Nevis
Burkina Faso Kiribati St. Helena and Dependencies
Burundi Kyrgyz St. Lucia
Cambodia Laos St. Vincent
Cameroon Lebanon Sudan
Canary Islands Lesotho Suriname
Cape Verde Liberia Swaziland
Central African Republic Libya Syria
Ceuta and Melilla Macedonia (former Yugoslavia) Tajikistan
Chad Madagascar Tanzania
China (except for Hong Kong and Macao) Malawi Thailand
Chile Malaysia Timor Leste
Colombia Maldives Togo
Union of Comoros Mali Tokelau Islands
Democratic Republic of Congo Marshall Islands Tonga
Republic of Congo Mauritania Tunisia
Cook Islands Mauritius Turkey
Costa Rica Mexico Turkmenista
Cuba Micronesia Turks and Caicos Islands
Croatia Moldova Tuvalu
Djibouti Commonwealth of Dominica Mongolia Uganda
Dominican Republic Montenegro Ukraine
Ecuador Montserrat Uruguay
Egypt Morocco Uzbekistan
El Salvador Mozambique Vanuatu
Equatorial Guinea Myanmar Venezuela
Eritrea Namibia Viet-Nam
Ethiopia Nepal West Bank and Gaza Strip
Falkland Islands and Dependencies Nicaragua Yemen
Fiji Niger Zambia
No. Author(s) Title
433 Sato Kan Hiroshi Toward an Inclusive and a Little Bit Ethical World Trading System:
Listening to the Voices of the People in LDCs 2013 432 Ke DING Platforms and Firm Capabilities: A Study of Emerging Global Value
Chains 2013
431 Shawn ARITA and Kiyoyasu
TANAKA FDI and Investment Barriers in Developing Economies 2013 430 Toshihiro KUDO Myanmar's Apparel Industry in the New International Environment:
Prospects and Challenges 2013
429 Kazunobu HAYAKAWA and
Nuttawut LAKSANAPANYAKUL Impacts of Common Rules of Origin on FTA Utilization 2013
428
Kazunobu HAYAKAWA, HanSung KIM, Nuttawut LAKSANAPANYAKUL, and Kohei SHIINO
FTA Utilization: Certificate of Origin Data versus Customs Data 2013
427 Toshihiro KUDO, Satoru KUMAGAI and So UMEZAKI
Five Growth Strategies for Myanmar: Re-engagement with the Global
Economy 2013
426 Koji KUBO Myanmar’s Non-Resource Export Potential after the Lifting of
Economic Sanctions: A Gravity Model Analysis 2013 425 Masayoshi OKABE Where Does Philippine Education Go? The “K to 12” Program and
Reform of Philippine Basic Education 2013 424 Bo MENG, Zhi WANG and Robert
KOOPMAN
How Are Global Value Chains Fragmented and Extended in China’s
Domestic Production Networks? 2013
423 Shinichi SHIGETOMI Development and Institutionalization of Communitarian Thought in
Thailand 2013
422 Takahiro FUKUNISHI Political Crisis and Suspension of Duty-free Access in Madagascar:
Assessment of Impacts on the Garment Industry 2013 421 Toshihiro KUDO, Satoru
KUMAGAI and Hikari ISHIDO Agriculture Plus Plus: Growth Strategy for Myanmar Agriculture 2013 420 Mai FUJITA The Japanese and Chinese Models of Industrial Organisation:
Fighting for Supremacy in the Vietnamese Motorcycle Industry 2013 419 Mai FUJITA Exploring the Sources of China’s Challenge to Japan: Models of
Industrial Organisation in the Motorcycle Industry 2013 418 Romio MORI, Kaoru NABESHIMA
and Nanae YAMADA
Food Safety Control System of Chinese Eel Exports and its
Challenges 2013
417 Takashi NOMURA, Saori OKADA,
Takeshi YOSHIZAKI Features of IP Rights Enforcement in Korea and China 2013 416 Yasushi UEKI Supply Chain Collaboration and Responsiveness: A Comparison
between Thai Automotive and Electronics Industries 2013 415 Yasushi UEKI Formation of Supply Chain Collaboration and Firm Performance in
the Thai Automotive and Electronics Industries 2013 414 Futaba ISHIZUKA International Labor Migration in Vietnam and the Impact of Receiving
Countries' Policies 2013
413 Chie KASHIWABARA The Central Bank and Bank Credits in the Philippines: A Survey on
Effectiveness of Monetary Policy and Its Measures 2013 412 Takahiro FUKUNISHI and
Tatsufumi YAMAGATA
Slow and Steady Wins the Race: How the Garment Industry Leads
Industrialization in Low-income Countries 2013 411 Tsuruyo FUNATSU Changing Local Elite Selection in Thailand: Emergence of New Local
Government Presidents after Direct Elections and Their Capabilities 2013 410 Hikari ISHIDO Harmonization of Trade in Services by APEC members 2013 409 Koichi KAWAMURA Presidentialism and Political Parties in Indonesia: Why Are All
Parties Not Presidentialized? 2013
408 Emi KOJIN The Development of Private Farms in Vietnam 2013 407 Tadayoshi TERAO Political Economy of Low Sulfurization and Air Pollution Control
Policy in Japan: SOx Emission Reduction by Fuel Conversion 2013 406 Miki HAMADA Impact of Foreign Capital Entry in the Indonesian Banking Sector 2013 405 Maki AOKI-OKABE Research Review: Searching for a New Framework for Thailand’s
Foreign Policy in the Post-Cold War Era 2013 404 Yuka KODAMA Relationship between Young Women and Parents in Rural Ethiopia 2013
No. Author(s) Title 403 Yoshihiro HASHIGUCHI and
Kiyoyasu TANAKA
Agglomeration and firm-level productivity:
A Bayesian Spatial approach 2013
402 Hitoshi OTA India’s Senior Citizens’ Policy and an Examination of the Life of
Senior Citizens in North Delhi 2013 401 Mila KASHCHEEVA Political limits on the World Oil Trade: Firm-level Evidence from US
firms 2013
400 Takayuki HIGASHIKATA Factor Decomposition of Income Inequality Change:
Japan’s Regional Income Disparity from 1955 to 1998 2013 399 Ikuo KUROIWA, Kenmei
TSUBOTA
Economic Integration, Location of Industries, and Frontier Regions:
Evidence from Cambodia 2013
398 Toshitaka GOKAN The Location of Manufacturing Firms and Imperfect Information in
Transport Market 2013
397 Junko MIZUNO An Export Strategy and Technology Networks in the Republic of
Korea 2013
396 Ke Ding, Toshitaka Gokan, Xiwei
Zhu Search, Matching and Self-Organization of a Marketplace 2013 395 Aya SUZUKI and VU Hoang Nam Status and Constraints of Costly Port Rejection: A case from the
Vietnamese Frozen Seafood Export Industry 2013 394 Natsuko OKA A Note on Ethnic Return Migration Policy in Kazakhstan: Changing
Priorities and a Growing Dilemma 2013 393 Norihiko YAMADA Re-thinking of “Chintanakan Mai” (New Thinking): New Perspective
for Understanding Lao PDR 2013
392 Yasushi HAZAMA Economic Voting under a Predominant Party System 2013 391 Yasushi HAZAMA Health Reform and Service Satisfaction in the Poor: Turkey 2013 390 Nanae YAMADA and Shuyan SUI Response of Local Producers to Agro-food Port Rejection: The Case
of Chinese Vegetable Exports 2013
389 Housam DARWISHEH From Authoritarianism to Upheaval: the Political Economy of the
Syrian Uprising and Regime Persistence 2013 388 Koji KUBO Sources of Fluctuations in Parallel Exchange Rates and Policy Reform
in Myanmar 2013
387 Masahiro KODAMA Growth-Cycle Nexus 2013
386 Yutaka ARIMOTO, Seiro ITO, Yuya KUDO, Kazunari TSUKADA
Stigma, Social Relationship and HIV Testing in the Workplace:
Evidence from South Africa 2013
385 Koichiro KIMURA Outward FDI from Developing Countries: A Case of Chinese Firms in
South Africa 2013
384 Chizuko SATO Black Economic Empowerment in the South African Agricultural
Sector: A Case Study of the Wine Industry 2013 383 Nudjarin RAMUNGUL, Etsuyo
MICHIDA, Kaoru NABESHIMA
Impact of Product-related Environmental Regulations/Voluntary
Requirements on Thai Firms 2013
382 Kazushi TAKAHASHI Pro-poor Growth or Poverty Trap? : Estimating the Intergenerational
Income Mobility in Rural Philippines 2013 381 Miwa TSUDA Kenya after the 2007 “Post-Election Violence”: Constitutional Reform
and the National Accord and Reconciliation Act 2013 380 Kazuhiko OYAMADA
Parameterization of Applied General Equilibrium Models with Flexible Trade Specifications Based on the Armington, Krugman, and Melitz Models
2013 379 Yoshihiro NAKANISHI Post-1988 Civil-Military Relations in Myanmar 2013 378 Tadashi ITO Export Platform Foreign Direct Investment: Theory and Evidence 2012 377 Muhamad Takiyuddin Ismail, Ahmad
Fauzi Abdul Hamid
The Misconception of Political Lessons: How UMNO Perceives the
Fall of LDP in Japan 2012
376 Koji KUBO Myanmar’s Two Decades of Partial Transition to a Market Economy: A Negative Legacy for the New Government 2012 375 Bo MENG, Yaxiong ZHANG,
Satoshi INOMATA
Compilation, Application and Challenge of IDE-JETRO’s
International Input-Output Tables 2012 374 Momoe MAKINO What Motivates Female Operators to Enter the Garment Industry in
Pakistan in the Post-MFA Period? 2012 373 Kenta GOTO Is the Vietnamese Garment Industry at a Turning Point?: Upgrading
from the Export to the Domestic Market 2012 372 Kazunobu HAYAKAWA Impact of Diagonal Cumulation Rule on FTA Utilization: Evidence