Abstract:
This paper studies the relationship between poverty and occupational choice in Haiti, focusing on the hypothesis that the lack of job opportunity could be a cause of the severe and persistent poverty. An empirical analysis on occupational choice was conducted using a multinominal logit model. Our findings suggest that obtaining wage employment is expected to be the key to escaping poverty; however, such opportunities are limited to workers with secondary education or higher. Many poor households engage in subsistence agriculture. For these reasons, Haitian households depend on remittance from family members working in abroad in the short run. Therefore, job creation in the non-agricultural sector and more supply of educated workers are needed for Haitian development in the long run.
1. Introduction
Haiti is the poorest country in Latin America and the Caribbean (LAC)1:
its Gross Domestic Product (GDP) per capita was US$729 in 2008 and its UNDP Human Development Index (HDI, 2009) was 0.532, ranked 149th among 182 countries. Its population is currently about 9.9 million, making it the most densely populated country in the Western Hemisphere. The Haitian economy has fallen into a negative trend after the coup in 1991, which was followed by political instability and the embargo period. Haiti
〈研究論文〉
THE LACK OF JOBS
AND POVERTY IN HAITI
Naoko Uchiyama Kobe University
―16― ―17―
has still not recovered the level of GDP per capita it had in 1990, as shown in Figure 1.
According to Lundahl (1983, 2004), the causes of poverty in Haiti lie in the low productivity and overpopulation of the small farming sector that dominates the Haitian economy. As a result, the falling income in the countryside pushes people into the cities, especially to Port-au-Prince, which displays all the characteristics of overcrowding, with high open unemployment, most of the urban labor force in informal self-employment, insufficient physical infrastructure, etc. (Lundahl, 2004)
FIGURE 1. HAITI GDP PER CAPITA (constant 2000 US$) 1990-2010 300 400 500 600 700 19901991 1992 1993 1994 1995 19961997 19981999 2000 20012002 20032004 2005 20062007 2008 20092010 US$
Source: World Bank, World Development Indicators (WDI) Online.
The Living Conditions Survey in Haiti in 2001 shows that nearly 80 percent of the population lives below the poverty line, and about 30 percent of main household providers are unemployed or inactive. In addition, the opportunity for wage employment is very limited (only 10 percent of main household providers are engaged in it). Furthermore, it is estimated that between 70 and 80 percent of the labor force is absorbed by the informal sector (Jadotte, 2004). Thus economic development and the creation of sufficient job opportunities are urgently needed to reduce poverty in Haiti. However, the devastating earthquake in January 2010 has virtually destroyed its economy. The fact that there had not been an autonomous economy in Haiti even before the earthquake will present great challenges for rebuilding a new structure. Taking into account these difficulties, the discussion in this paper will be focused on the relationship between poverty, inequality and the occupational choice of a household.
The next section presents an overview of the poverty and inequality
in Haiti as well as the characteristics of households’ income sources.
Wage income is identified as an important income source that is useful for escaping poverty. In Section 3, we conduct an empirical analysis of the job selection of main household providers using a multinomial logit model. Our analysis reveals the lack of job opportunities in Haiti, and underscores that education and remittance income play important roles in determining the occupations of main providers. Section 4 concludes this paper and presents the implications for job creation and consequently, for poverty reduction.
2. Poverty and Inequality in Haiti
2-1 Overview
Table 1 presents the geographical distribution of poverty in Haiti. At the national level, 77 percent of the population lived below the poverty line of US$2 per day and 56 percent of the population lived in extreme poverty (less than US$1 per day) in 2001. It is noteworthy that poverty was mainly a rural phenomenon because two-thirds of the total population lived in rural areas, of which 67 percent and 88 percent were extremely poor and
poor, respectively. A weighted average (by population) indicated as ‘H1
contribution’ in the table shows that 77 percent of the extreme poor lived in
rural areas.
Extreme Poverty (H1)a Poverty (H2)b Contribution (H1) Population Share
Metropolitan area 23 45 9 23
Other urban area 57 76 14 14
Rural area 67 88 77 63
National 56 77 100 100
a less than US$1 per day. b less than US$2 per day.
Source: Sletten and Egset (2004) Table 3.
TABLE 1. GEOGRAPHICAL DISTRIBUTION OF POVERTY IN HAITI, 2001 (Percent)
Haiti is not only the poorest countries, but also the one with the most unequal distribution of income in LAC, a region that is known as the most
―18― ―19―
unequal region in the world. Haiti’s Gini coefficient is 0.652 in 2001, making
it higher than that of Brazil, the country that had always been regarded as the most unequal among the LAC countries. (Jadotte, 2007).
2-2 Household Income Sources
Figure 2 presents the income composition of the average household in
each income quintile. It shows that self-employment3 has the highest
share among the household income sources (36.7%) while transfers have the second highest (25.4%) at the national level. It should also be noted that self-employment is the most important income source for all the quintiles. Specifically, it accounts for 52.4 percent of the total income in Q1 (the poorest). However, the share of self-employment decreases and that of wage income increases in households of richer quintiles. For instance, wage income accounts for more than 25 percent in the richest quintile (Q5), although its share is well below 10 percent in Q1–Q3. It is also notable that self-consumption is the second most important source of income for Q2–Q4 households, which indicates that the households in these quintiles (Q2–Q4) are most likely engaged in agriculture. In contrast, it is likely that most people who belong to Q5 have non-agricultural work because self-consumption is extremely low.
FIGURE 2. HOUSEHOLD INCOME SOURCES BY QUINTILES, 2001 0% 20% 40% 60% 80% 100%
Q1(poorest) Q2 Q3 Q4 Q5(richest) National
Self-employment Wage works
Transfer Property
Other sources Self-consumption and in kind
In summary, i) Haiti is characterized by extremely high poverty incidence and inequality. ii) The rural population is still dominant and most of the rural poor depend mainly on self-employment and self-consumption. iii) The fact that 77 percent of the population lived below the poverty line suggests that most households belonging to Q1–Q4 are poor, and that self-employment is their principal income source. Access to wage income and transfers plays an important role in enabling escape from poverty in Haiti.
In this respect, agricultural development and increasing wage employment are expected to be key factors for economic growth and poverty reduction in Haiti. Although numerous research efforts have elucidated
agricultural development4, few studies have examined issues relating to
wage job opportunities. Furthermore, agricultural development itself could have limitations due to difficult natural conditions in Haiti, such as the demographic pressure that causes the division of arable land into smaller plots (in 2001, nearly 78% of farmers owned less than 2 ha. of land), a mountainous topography in which two-thirds of the farmland have slopes of more than 20 percent, and severe soil erosion. (World Bank, 2005; MPCE, 2007). Also, as Table 2 shows, although one half of the employment is in agriculture, its value-added is relatively low (less than 30%) compared to other sectors. Therefore, in addition to agricultural reform, the development of non-agricultural sectors which have higher productivity would be indispensable for Haitian economic development, as many development theories suggest, in order to absorb rural overpopulation.
Agriculture Industry Service Agriculture Industry Service
Value Added (% of GDP) 29.7 16.2 54.1 27.9 16.8 55.3
Employment (%) 50.6 10.7 38.7 50.4* 8.0* 41.3*
Note: Data with asterisk are those of 2001 by own calculations based on ECVH 2001. Source: WDI Online
TABLE 2. SECTOR PRODUCTION AND EMPLOYMENT
1999 2002
For these reasons, the remainder of this paper is devoted to issues of job opportunities and occupational choice in Haiti, with a special emphasis on wage employment.
―20― ―21―
3. Lack of Job Opportunities and Occupational Choice
In this section, issues of the occupational choice of main household providers will be analyzed using the Living Conditions Survey in Haiti
2001 (Enquete sur les Conditions de Vie en Haiti: ECVH 2001). This is
a multi-topic national household survey commissioned by the UNDP and implemented by the Haitian statistical office (Institut Haitien de
Statistique et d’Informatique: IHSI) in collaboration with Fafo5. The
data reflect the responses of 7,810 households and 33,007 individuals nationwide. This household survey is the only one available and is most comprehensive microdata on Haiti to date.
3-1 Overview
Table 3 presents the principal jobs of main providers (age 15–65) of households. Main providers who are inactive or unemployed account for as much as 30 percent of the total, not only at the national level, but also in both urban and rural areas. Wage employees are only about 11 percent of the total at the national level (19 percent in urban areas and only 6 percent in rural areas). The rest (about 60 percent) are categorized as self-employed either in agricultural or non-agricultural sectors at the national level. The data clearly indicate that job opportunities are limited in Haiti.
All Urban Rural
1 4 . 0 2 9 9 . 7 1 5 5 . 9 1 e v it c a n I 9 . 7 1 1 . 4 1 2 1 . 0 1 t n e m y o l p m e n U Wage Employment 10.73 18.72 6.28 Self-employment (non-agriculture) 27.52 33.56 24.16 Self-employment (agriculture) 32.09 15.62 41.25 0 0 1 0 0 1 0 0 1 l a t o T Sample Size 5,771 2,062 3,709
Note: ‘Family assistance’ and ‘wage employment in agriculture’ are excluded. Source: Own calculations based on ECVH 2001.
TABLE 3. PRINCIPAL JOBS OF MAIN PROVIDERS (AGE 15-65), 2001 (percent)
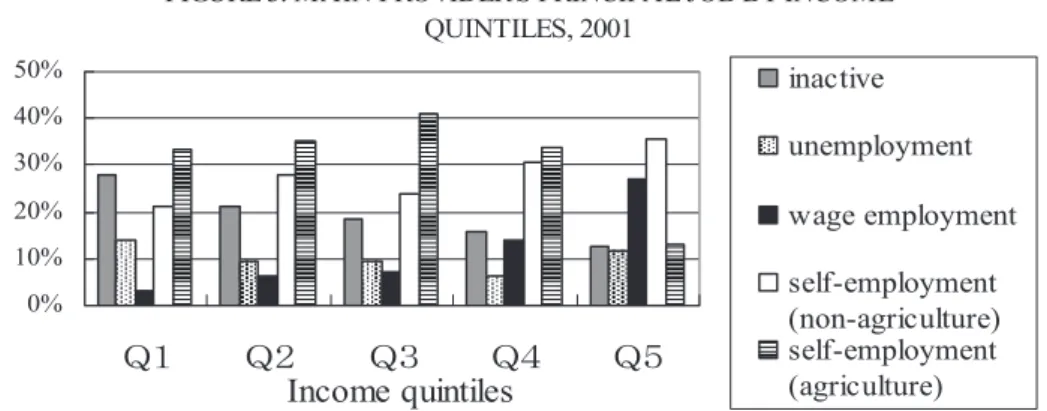
The relationship between occupational distribution and poverty and inequality can be described as follows. Figure 3 presents the main
provider’s occupational choice by income quintiles of households. The share of wage employment is sharply higher (26.9%) among main providers in the richest quintile (Q5), while the share of agricultural self-employment is remarkably low (12.9%). Underscoring the clear difference of job choice between poor (Q1–Q4) and non-poor households (Q5), we can again infer that access to wage employment (especially in the non-agricultural sector)
must play a key role in a person’s escape from poverty.
Previous studies on the job market in Haiti have revealed the importance of education in obtaining wage labor. Uchiyama (2009) estimated a probit model of the probability of becoming a wage worker in Haiti and reported that human capital is an important determinant in participating in the wage-earning job market. Verner (2005, 2008) reported that the probability of getting employment in the non-farm sector is positively and significantly related to education levels in Haiti. Other regression results of earnings functions (income per capita or wage) reveal that education level has positive and strong effects on the level of earnings in Haiti (Sletten and Egset, 2004; Verner, 2005, 2008; Jadotte, 2006; Uchiyama, 2009).
FIGURE 3. MAIN PROVIDER'S PRINCIPAL JOB BY INCOME QUINTILES, 2001 0% 10% 20% 30% 40% 50% 䠭䠍 䠭䠎 䠭䠏 䠭䠐 䠭䠑 Income quintiles inactive unemployment wage employment self-employment (non-agriculture) self-employment (agriculture)
Source: Own calculations based on ECVH 2001.
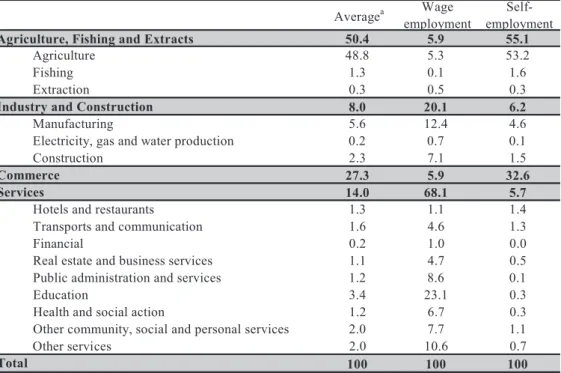
Wage employment requires higher skills than those of other
occupations. Table 4 shows the employment sectors of active workers’
―22― ―23―
service sector. It is also notable that the service sector’s labor force includes
jobs that require high skills such as public administration (8.6 percent), education (23.1 percent), and health (6.7 percent), which suggests that only workers with high skills (signaled by high education) are eligible to become wage workers.
Figure 4 shows the correlation between a main provider’s principal
job and their education level. A clear correlation exists between wage employment and tertiary education: more than 60 percent of those who have tertiary education are engaged in wage employment, although only 10 percent of workers that have completed a primary education live on wages. The share is almost zero for those who have not completed any level of education. Workers with higher education are more likely to be wage workers. We can also observe that the share of self-employment in agriculture is lower for higher education levels. None of the main providers with tertiary education lives on agriculture work.
Averagea Wage
employment employment
Self-1 . 5 5 9 . 5 4 . 0 5 s t c a r t x E d n a g n i h s i F , e r u tl u c i r g A 2 . 3 5 3 . 5 8 . 8 4 e r u tl u c ir g A 6 . 1 1 . 0 3 . 1 g n i h s i F 3 . 0 5 . 0 3 . 0 n o it c a rt x E
Industry and Construction 8.0 20.1 6.2
6 . 4 4 . 2 1 6 . 5 g n ir u t c a f u n a M
Electricity, gas and water production 0.2 0.7 0.1 5 . 1 1 . 7 3 . 2 n o it c u rt s n o C Commerce 27.3 5.9 32.6 Services 14.0 68.1 5.7 4 . 1 1 . 1 3 . 1 s t n a r u a t s e r d n a s l e t o H 3 . 1 6 . 4 6 . 1 n o it a c i n u m m o c d n a s tr o p s n a r T 0 . 0 0 . 1 2 . 0 l a i c n a n i F 5 . 0 7 . 4 1 . 1 s e c i v r e s s s e n i s u b d n a e t a t s e l a e R
Public administration and services 1.2 8.6 0.1 3 . 0 1 . 3 2 4 . 3 n o it a c u d E 3 . 0 7 . 6 2 . 1 n o it c a l a i c o s d n a h tl a e H
Other community, social and personal services 2.0 7.7 1.1 7 . 0 6 . 0 1 0 . 2 s e c i v r e s r e h t O Total 100 100 100
a ‘Average’ includes wage employment, self-employment and family assistance.
Source: Own calculations based on ECVH 2001.
TABLE 4. EMPLOYMENT SECTORS OF ACTIVE WORKER'S PRIMARY JOB, 2001 (Percent)
FIGURE 4. MAIN PROVIDER'S PRINCIPAL JOB BY EDUCATION LEVEL, 2001
0% 20% 40% 60% 80% No Education Primary
Completed SecondaryCompleted Tertiary
inactive unemployment wage employment self-employment (non-agriculture) self-employment (agriculture)
Notes: ‘No education’ includes those who have not completed primary education.
‘Tertiary’ includes those who have not completed tertiary-level education. Source: Own calculations based on ECVH 2001.
Another important determinant of occupational choice is remittances from abroad. As described in the previous section, transfers are the second major income source for Haitian households at an aggregate level (Fig. 2).
The importance of transfers, especially remittances from abroad6, is pointed
out in many studies7. When it comes to the remittance inflows, Haiti’s
figures are outstanding compared to other Latin American countries:
workers’ remittances as a share of GDP increased from 5 percent in 1996
to 21.5 percent in 2006 (Amuedo-Dorantes et al., 2010). More remarkably,
workers’ remittances as a share of exports of goods amount to 211.1
percent in 2006 (Amuedo-Dorantes et al., 2010). In addition, data from the
Living Conditions Survey in Haiti (ECVH 2001) shows that a quarter of all households whose main providers are aged 15-65 receive remittances. Consequently, consumption levels have been maintained by remittances that have increased continually since the mid-1990s, while GDP per capita declined due to political and economic turmoil (World Bank, 2006).
―24― ―25―
FIGURE 5. MAIN PROVIDER’S PRINCIPAL JOB BY REMITTANCES AS A SHARE OF TOTAL HOUSEHOLD INCOME, 2001
0% 10% 20% 30% 40% 50%
0 less than 50% more than 50% Remittances as a Share of Total Household Income
inactive unemployment wage employment self-employment (non-agriculture) self-employment (agriculture) Source: Own calculations based on ECVH 2001.
Figure 5 presents the relationship between job choice and the share of remittances in total household income. The figure shows that main providers are most likely to be self-employed (both in agriculture (37 percent) and in non-agriculture (26 percent)) if they do not receive remittances at all. In contrast, the share of self-employment (especially in agriculture) declines and the respective shares of those who are inactive and unemployed increase as the proportion of remittances exceeds 50 percent. This fact suggests a correlation between job choice (and especially the choice of whether to work or not to work) and the receipt of remittances. The following subsections describe econometric analyses of this occupational choice using a multinomial logit model.
3-2 Model
We assume that the occupational choice of workers can be described by the following multinomial logit function:
suggests a correlation between job choice (and especially the choice of whether to work or not to work) and the receipt of remittances. The following subsections describe econometric analyses of this occupational choice using a multinomial logit model. 3-2 Model
We assume that the occupational choice of workers can be described by the following multinomial logit function:
¦
c c m l i l j i ij p 1exp( ) ) exp( ȕ x ȕ x ,where pij represents the probability that individual i chooses job
j
. There arem
kinds of different job alternatives: five in this case (inactive, unemployment, wage employment in the non-agricultural sector, self-employment in the non-agricultural sector, and self-employment in the agricultural sector). In addition,x
i represents a vector of case-specific independent variables including a constant, variables related to education and remittances, and other control variables that are presumed to affect job choice.3-3 Regression Results
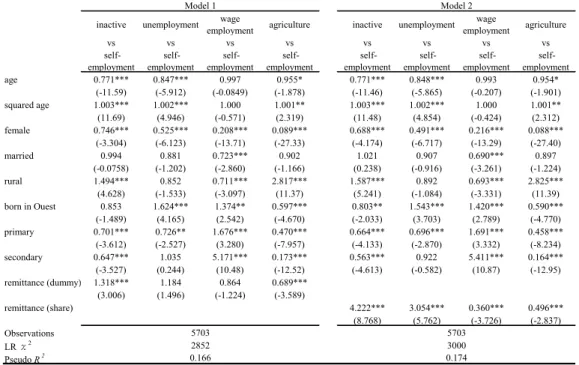
Table 5 presents the regression results of the model described above. The sample only includes main household providers aged 15–65. The control variables are age, age
squared, female dummy (female=1), marriage dummy (married=1), rural dummy (equal
to 1 if the main provider lives in rural areas at present), born in Ouest dummy (equal to 1 if the main provider was born in the Ouest (capital) region). Education related variables (dummies) are primary (equal to 1 if the main provider has completed primary education) and secondary (equal to 1 if the main provider has completed at least a secondary education, including those who have tertiary education). Regarding remittance-related variables, a dummy (equal to 1 if the household receives foreign remittances irrespective of its amount) is used in the first model and the share of foreign remittances in the total household income is used in the second model. The results of the two models are similar, but the second model fits slightly better than the first.
where
suggests a correlation between job choice (and especially the choice of whether to work or not to work) and the receipt of remittances. The following subsections describe econometric analyses of this occupational choice using a multinomial logit model. 3-2 Model
We assume that the occupational choice of workers can be described by the following multinomial logit function:
¦
c c m l i l j i ij p 1exp( ) ) exp( ȕ x ȕ x ,where pij represents the probability that individual i chooses job
j
. There arem
kinds of different job alternatives: five in this case (inactive, unemployment, wage employment in the non-agricultural sector, self-employment in the non-agricultural sector, and self-employment in the agricultural sector). In addition,x
i represents a vector of case-specific independent variables including a constant, variables related to education and remittances, and other control variables that are presumed to affect job choice.3-3 Regression Results
Table 5 presents the regression results of the model described above. The sample only includes main household providers aged 15–65. The control variables are age, age
squared, female dummy (female=1), marriage dummy (married=1), rural dummy (equal
to 1 if the main provider lives in rural areas at present), born in Ouest dummy (equal to 1 if the main provider was born in the Ouest (capital) region). Education related variables (dummies) are primary (equal to 1 if the main provider has completed primary education) and secondary (equal to 1 if the main provider has completed at least a secondary education, including those who have tertiary education). Regarding remittance-related variables, a dummy (equal to 1 if the household receives foreign remittances irrespective of its amount) is used in the first model and the share of foreign remittances in the total household income is used in the second model. The results of the two models are similar, but the second model fits slightly better than the first.
represents the probability that individual i chooses job j.
There are
m
kinds of different job alternatives: five in this case (inactive,self-employment in the non-agricultural sector, and self-self-employment in the
agricultural sector). In addition,
x
i represents a vector of case-specificindependent variables including a constant, variables related to education and remittances, and other control variables that are presumed to affect job choice. 3-3 Regression Results
Table 5 presents the regression results of the model described above. The sample only includes main household providers aged 15–65. The control variables are age, age squared, female dummy (female=1), marriage dummy (married=1), rural dummy (equal to 1 if the main provider lives in rural areas at present), born in Ouest dummy (equal to 1 if the main provider was born in the Ouest (capital) region). Education related variables (dummies) are primary (equal to 1 if the main provider has completed primary education) and secondary (equal to 1 if the main provider has completed at least a secondary education, including those who have tertiary
inactive unemployment employmentwage agriculture inactive unemployment employmentwage agriculture
vs vs vs vs vs vs vs vs
self-employment employment self- employment self- employment self- employment self- employment self- employment self- employment
self-age 0.771*** 0.847*** 0.997 0.955* 0.771*** 0.848*** 0.993 0.954* (-11.59) (-5.912) (-0.0849) (-1.878) (-11.46) (-5.865) (-0.207) (-1.901) squared age 1.003*** 1.002*** 1.000 1.001** 1.003*** 1.002*** 1.000 1.001** (11.69) (4.946) (-0.571) (2.319) (11.48) (4.854) (-0.424) (2.312) female 0.746*** 0.525*** 0.208*** 0.089*** 0.688*** 0.491*** 0.216*** 0.088*** (-3.304) (-6.123) (-13.71) (-27.33) (-4.174) (-6.717) (-13.29) (-27.40) married 0.994 0.881 0.723*** 0.902 1.021 0.907 0.690*** 0.897 (-0.0758) (-1.202) (-2.860) (-1.166) (0.238) (-0.916) (-3.261) (-1.224) rural 1.494*** 0.852 0.711*** 2.817*** 1.587*** 0.892 0.693*** 2.825*** (4.628) (-1.533) (-3.097) (11.37) (5.241) (-1.084) (-3.331) (11.39) born in Ouest 0.853 1.624*** 1.374** 0.597*** 0.803** 1.543*** 1.420*** 0.590*** (-1.489) (4.165) (2.542) (-4.670) (-2.033) (3.703) (2.789) (-4.770) primary 0.701*** 0.726** 1.676*** 0.470*** 0.664*** 0.696*** 1.691*** 0.458*** (-3.612) (-2.527) (3.280) (-7.957) (-4.133) (-2.870) (3.332) (-8.234) secondary 0.647*** 1.035 5.171*** 0.173*** 0.563*** 0.922 5.411*** 0.164*** (-3.527) (0.244) (10.48) (-12.52) (-4.613) (-0.582) (10.87) (-12.95) remittance (dummy) 1.318*** 1.184 0.864 0.689*** (3.006) (1.496) (-1.224) (-3.589) remittance (share) 4.222*** 3.054*** 0.360*** 0.496*** (8.768) (5.762) (-3.726) (-2.837) Observations LR χ2 Pseudo R2 Notes: *** p <0.01, ** p <0.05, * p <0.1 z statistics in parentheses
Estimated coefficients are transformed to relartive risk ratios (exp(â)). Base: self-employment in non-agriculture
Hausman test of independence from irrelevant alternatives (IIA) was not rejected at 5 % level for both models. TABLE 5. RESULTS OF MULTINOMINAL LOGIT MODEL
Model 2 Model 1 5703 2852 0.166 5703 3000 0.174 β
―26― ―27―
education). Regarding remittance-related variables, a dummy (equal to 1 if the household receives foreign remittances irrespective of its amount) is used in the first model and the share of foreign remittances in the total household income is used in the second model. The results of the two models are similar, but the second model fits slightly better than the first.
The results portray the likelihood of being inactive, unemployed, a wage worker or self-employed in agriculture relative to self-employment in non-agriculture. The estimated coefficients are transformed to relative risk ratios8.
First, the effect of education on job choice is positive and significant only for wage employment (the relative risk ratio is larger than 1). Having a certain level of education increases the likelihood of wage employment (relative to self-employment in non-agriculture): the odds of choosing wage employment are about 1.7 times greater if a main provider has completed primary education. The amount increases to more than five times if secondary or higher education is completed, compared to no education completed, which indicates that wage employment demands relatively higher skills (education attainment) than other occupations. In contrast, the probabilities of choosing other job alternatives (inactive, unemployment, or self-employed in agriculture) decrease relative to self-employment in non-agriculture as the education level increases. In particular, main providers engaged in agriculture have a lower educational level even compared to those who are inactive or unemployed (in the case of primary education completed, the odds decrease by about 27–34 percent for inactive and unemployed individuals, and by more than 50 percent for agriculture). The coefficient of the secondary dummy for unemployment is not significant and the odds relative to self-employment in non-agriculture do not change (the relative risk ratio is nearly 1), which might imply that those who have certain education levels seek job opportunities other than agriculture whereas those with much higher education are more likely to become wage workers. Agriculture might not be profitable at all and might serve as the last resort for Haitian households.
education tend to choose non-agricultural jobs (including unemployment); they are more likely to choose wage employment if they have higher education. However, we might also infer the existence of a strong eligibility for wage employment because of the limited supply of skilled workers. Uchiyama (2009) finds that wage premia for more educated (tertiary-level) workers are extremely high because of the lack of supply of these
skilled workers9. In fact, Haitian educational levels are well below the LAC
average. For example, the youth (aged 15–24) illiteracy rate in 2005 was 34 percent in Haiti, in contrast with 2–3 percent in Mexico and 6 percent in the Dominican Republic and throughout the LAC region (Amuedo-Dorantes et al., 2010). Additionally, data from ECVH 2001 show that half of the main providers aged 15–65 had completed no education, although almost 20 percent had completed secondary education; moreover, those who had completed tertiary education comprised only 1 percent.
The problem of education in Haiti is that public resources devoted to education are scarce compared to many other countries in the LAC region. According to Amuedo-Dorantes et al. (2010), the private sector––the primary vehicle by which access to education is possible in Haiti––has become a substitute for public investment rather than a complement. Almost 90 percent of all schools in Haiti are private or parochial. Despite a constitutional guarantee of free education, public schools are costly and are of very low quality. Consequently, access to education remains problematic for vulnerable groups; it can be a heavy financial burden whether the child attends public or private schools (Amuedo-Dorantes et al., 2010). Improving both the education level and quality in Haiti, therefore, is of utmost importance.
However, improvements in education and increases in job opportunities are rather medium or long term objectives. The most practical and only way to earn flow income for the immediate improvement of living conditions, especially after the earthquake, must be via remittances from abroad.
With respect to the effect of foreign remittances on the occupational choice, the regression results show that the likelihood of being inactive or unemployed is higher when the main provider has remittance income
―28― ―29―
and increases concomitantly with the increasing share of total household income. For inactive people, for example, the odds relative to self-employment in non-agriculture becomes 1.3 times higher if the main provider receives some sort of remittance (as in the first model) and four times greater if the household income consists only of remittances (as in the second model). In contrast, main providers are less likely to be engaged in wage employment or in agriculture (compared to self-employment in non-agriculture) if they receive remittances, and such employment likelihood continues to decrease concomitantly with an increase in remittances in the total income. This result suggests that remittance income makes main providers choose not to work, since remittances increase their reservation
wages10. Alternatively, it could be said that they become reliant on
remittances because job opportunities are very limited and they cannot earn sufficient income to satisfy their daily needs.
Some other control variables also present interesting implications. First, female main providers are more likely to choose self-employment in non-agriculture than any other job alternative (the relative risk ratios of the coefficients of the female dummy are all less than 1). With respect to the rural dummy, it can be concluded that living in rural areas increases the probability of choosing agriculture or being inactive compared to self-employment in non-agriculture, and reduces the probability of choosing wage employment. Furthermore, it turns out that whether the main provider was born in the capital region or not is an important determinant of job choice: those who were born in Ouest are more likely to be wage workers or unemployed. Easier access to the capital city could be an advantage in choosing a better job (especially when it comes to choosing wage employment). In this respect, the reason why the likelihood of unemployment increases for those who were born in Ouest can be explained by the lack of job opportunities: people might wait for a good job opportunity, taking advantage of easier access to the capital city (and, therefore, to better information and infrastructure). Age and marriage, on the other hand, seem to have only weak effects on job choice because the magnitude of relative risk ratios is close to unity for most alternatives.
4. Concluding Remarks
This paper began with an overview of the situation of poverty and inequality in Haiti in Section 2, which indicated that wage employment is expected to be the key to escaping poverty. However, household survey data revealed that employment opportunities are very limited in Haiti: the share of wage employment is small (only 10 percent) and access to wage employment is virtually restricted to non-poor households (mostly to the richest quintile). In Section 3, an empirical analysis using the multinomial logit model was conducted to identify the determinants of occupational choice of main household providers. The results present a clear correlation between education and wage employment. However, the fact that only 10 percent of the main providers live on wages also implies a higher eligibility of becoming a wage worker because of the limited supply of highly skilled workers. With respect to the effect of remittances from family members and others in foreign countries, the regression results showed whether main providers receive remittances or not; more importantly, the share of remittances of the total household income is crucial in their decision of whether or not to work.
As mentioned in Section 2, many studies propose agricultural
development as a means of improving Haiti’s economy. However,
considering the disadvantages and limitations of Haitian agriculture (especially those related to overpopulation), it is crucial to expand job opportunities (and in particular, wage employment) by developing non-agricultural industries across the country to reduce severe poverty and inequality in Haiti. In fact, even though the employment rate in the industrial sector is small (9%), more than 90 percent of total Haitian
exports come from the industrial (manufacturing) sector11 (UN Comtrade
data 2005). Production assembly was the sole and most viable industrial sector of the Haitian economy for more than 30 years. Prior to the coup in 1991, the industrial sector was more diversified and there were a number of foreign-owned firms. Today, employment in this sector has been reduced to about two-thirds and virtually all of the companies are owned by Haitians
―30― ―31―
(I-PRSP, 2006; Lundahl, 2004). As a result, a lot of qualified people migrated from Haiti during the embargo years (Lundahl, 2004).
With respect to the service sector, while tourism was once a vital sector of the Haitian economy (representing over 20 percent of exports (MPCE, 2007)), it has also been seriously damaged by political and social turmoil since the 1960s. Thus, inviting foreign direct investment (FDI) by taking
advantage of Haiti’s abundant labor must be one of the crucial strategies for
a rapid and efficient development of these sectors12.
At the same time, improving the educational level and quality is indispensable to supplying qualified workers to the labor market and fostering the economic development mentioned above and poverty reduction as pointed out in Section 3. However, improvement in education cannot be achieved in the short run.
Meanwhile, considering the scarcity of job opportunities that has further been reduced by the damage of the earthquake, and the crucial dependence on remittances by Haitian households, as discussed in this paper, remittances are the only way to for Haitians to be financially supported in the short run. Amuedo-Dorantes et al. (2010) points out that remittances ameliorate the negative disruptive effect of household
out-migration on children’s schooling in some migrating communities and
therefore, contribute to the accumulation of human capital in the midst of extreme poverty. Developed countries could accept Haitian migrants more actively under appropriate conditions so that remittance income could contribute not only to the reconstruction of the economy, but also to poverty reduction. It would also be necessary to establish a scheme that would make more efficient use of foreign remittances by directing them towards
investments in education13.
Finally, this study is mainly based on one-year household survey data from 2001. Therefore, it has limitations in obtaining robust conclusions and policy implications. More detailed analyses using new comparative micro data will remain for a future study.
RefeRences
Amuedo-Dorantes, Catalina, Annie Georges and Susan Pozo, “Migration, Remittances and Children’s Schooling in Haiti,” The Annuals of the American Academy of Political and
Social Science 2010 630, pp. 224-244, July 2010.
Arias, Diego, Emily Brearley and Gilles Damais, “Restoring the Competitiveness of the Coffee Sector in Haiti,” Economic and Sector Study Series, Region II, Inter-American Development Bank, April 2006.
Cameron, Colin A. and Pravin K. Trivedi, Microeconometrics Using Stata, Texas, Stata Press, 2009.
IHSI, Enquête sur les Conditions de Vie en Haïti 2001 (ECVH) (Survey of Living Conditions in
Haiti) Volume I and II, Port-au-Prince, Institut Haïtien de Statistique et d’Informatique,
2003.
Jadotte, Evans, “Characterization of Inequality and Poverty in the Republic of Haiti”, Estudios
Sociales, Vol. 15, No. 29, pp. 9-56, Enero-Junio de 2007.
Jadotte, Evans, “International Migration, Remittances and Labor Supply: The Case of the Republic of Haiti,” UNU-WIDER Research Paper No. 2009/28, May 2009.
Lundahl, Mats, The Haitian Economy: Man, Land, and Markets, London, Croom Helm, 1983. Lundahl, Mats, “Sources of Growth in the Haitian Economy,” Economic and Sector Study
Series, Region II, Inter-American Development Bank, June 2004.
MPCE, Carte de Pauvreté d’Haïti Version 2004, Port-au-Prince, Ministère de la Planification et la Coopération Externe, 2004.
MPCE, Growth and Poverty Reduction Strategy Paper (2008–2010): Making a Qualitative
Leap Forward, English Translation of official Original Document in French, Ministry of
Planning and External Cooperation, November 2007.
Orozco, Manuel, “Understanding the Remittance Economy in Haiti,” Final Draft, Paper commissioned by the World Bank, March 2006.
Republic of Haiti, A Window of Opportunity for Haiti (Interim Poverty Reduction Strategy Paper – I-PRSP), 2006.
Sletten, Pål and Willy Egset, Poverty in Haiti, Fafo, 2004.
Uchiyama, Naoko, “Determinants of Job Opportunity and Wage Income in Haiti,” Rokkodai
Ronshu: Kokusai Kyoryoku Kenkyu Hen, Vol. 10, pp. 1-19, January 2009.
Verner, Dorte, “Making the Poor Haitians Count Takes More Than Counting the Poor: A Poverty and Labor Market Assessment of Rural and Urban Haiti Based on the First Household Survey for Haiti,” World Bank, April 2005.
Verner, Dorte, “Labor Markets in Rural and Urban Haiti: Based on the First Household Survey for Haiti,” Policy Research Working Paper 4574, Sustainable Development Division, World Bank, March 2008.
World Bank, Haiti: Agriculture and Rural Development: Diagnostic and Proposals for Agriculture
―32― ―33― World Bank, Haiti: Options and Opportunities for Inclusive Growth, Country Economic
Memorandum, Washington, D.C., June 2006.
AcKnOWLeDGeMenT
The author is grateful to Nobuaki Hamaguchi and Shoji Nishijima of Kobe University for the instruction and support and to the anonymous referees for helpful comments. She also thanks the Inter-American Development Bank (IDB) for providing the data. This paper is partially based on a research conducted during a summer internship at IDB in 2007. In addition, the research was partly financed by 2008 Tazaki Scholarship of Research Institute for Economics and Business Administration (RIEB) of Kobe University. The views expressed in this paper are entirely those of the author.
enDnOTes
1 World Bank Country Brief: http://web.worldbank.org/ (accessed on 08/06/2010) 2 Calculation based on household survey data in 2001 (Jadotte, 2007).
3 Income from self-employment consists of market sales of both agricultural and non-agricultural goods and excludes self-consumption.
4 For rural poverty analyses and agricultural development, see World Bank (2005, 2006) and Verner (2005, 2008). Arias et al. (2006) examine coffee sector, which has been the most important sector for agricultural export. For the government’s agricultural development strategies, see I-PRSP (2006), MPCE (2007), etc.
5 Fafo is a Norwegian independent and multidisciplinary research foundation.
6 Three quarters of the transfers are foreign remittances (Sletten and Egset, 2004). According to Lundahl (2004), the Ministry of Haitians Living Abroad estimates about 2.5 million Haitian emigrants living in the United States, Canada, the Dominican Republic, Caribbean countries, and France, which represent more than a quarter of the total population of Haiti.
7 See Orozco (2006) for details about remittance economy in Haiti especially the conditions of migrants in the United States.
8 The odds ratio or relative risk ratio of choosing alternative j rather than alternative 1 (base) is given as
World Bank, Haiti: Agriculture and Rural Development: Diagnostic and Proposals for Agriculture and Rural Development Policies and Strategies, Washington, D.C., October 2005.
World Bank, Haiti: Options and Opportunities for Inclusive Growth, Country Economic Memorandum, Washington, D.C., June 2006.
ACKNOWLEDGEMENT
The author is grateful to Nobuaki Hamaguchi and Shoji Nishijima of Kobe University for the instruction and support and to the anonymous referees for helpful comments. She also thanks the Inter-American Development Bank (IDB) for providing the data. This paper is partially based on a research conducted during a summer internship at IDB in 2007. In addition, the research was partly financed by 2008 Tazaki Scholarship of Research Institute for Economics and Business Administration (RIEB) of Kobe University. The views expressed in this paper are entirely those of the author
ENDNOTES
1 World Bank Country Brief: http://web.worldbank.org/ (accessed on 08/06/2010)
2 Calculation based on household survey data in 2001 (Jadotte, 2007).
3 Income from self-employment consists of market sales of both agricultural and
non-agricultural goods and excludes self-consumption.
4 For rural poverty analyses and agricultural development, see World Bank (2005, 2006)
and Verner (2005, 2008). Arias et al. (2006) examine coffee sector, which has been the most important sector for agricultural export. For the government’s agricultural development strategies, see I-PRSP (2006), MPCE (2007), etc.
5 Fafo is a Norwegian independent and multidisciplinary research foundation.
6 Three quarters of the transfers are foreign remittances (Sletten and Egset, 2004).
According to Lundahl (2004), the Ministry of Haitians Living Abroad estimates about 2.5 million Haitian emigrants living in the United States, Canada, the Dominican Republic, Caribbean countries, and France, which represent more than a quarter of the total population of Haiti.
7 See Orozco (2006) for details about remittance economy in Haiti especially the
conditions of migrants in the United States.
8 The odds ratio or relative risk ratio of choosing alternative j rather than alternative 1
(base) is given as ) exp( ) 1 Pr( ) Pr( j i i i y j y xcȕ
so exp(ȕjk)gives the proportionate change in the relative risk of choosing alternative
j rather than alternative 1 (base) when xik changes by one unit (Cameron and Trivedi,
2009: p.486).
so
World Bank, Haiti: Agriculture and Rural Development: Diagnostic and Proposals for
Agriculture and Rural Development Policies and Strategies, Washington, D.C.,
October 2005.
World Bank, Haiti: Options and Opportunities for Inclusive Growth, Country Economic Memorandum, Washington, D.C., June 2006.
ACKNOWLEDGEMENT
The author is grateful to Nobuaki Hamaguchi and Shoji Nishijima of Kobe University for the instruction and support and to the anonymous referees for helpful comments. She also thanks the Inter-American Development Bank (IDB) for providing the data. This paper is partially based on a research conducted during a summer internship at IDB in 2007. In addition, the research was partly financed by 2008 Tazaki Scholarship of Research Institute for Economics and Business Administration (RIEB) of Kobe University. The views expressed in this paper are entirely those of the author
ENDNOTES
1 World Bank Country Brief: http://web.worldbank.org/ (accessed on 08/06/2010) 2 Calculation based on household survey data in 2001 (Jadotte, 2007).
3 Income from self-employment consists of market sales of both agricultural and non-agricultural goods and excludes self-consumption.
4 For rural poverty analyses and agricultural development, see World Bank (2005, 2006) and Verner (2005, 2008). Arias et al. (2006) examine coffee sector, which has been the most important sector for agricultural export. For the government’s agricultural development strategies, see I-PRSP (2006), MPCE (2007), etc.
5 Fafo is a Norwegian independent and multidisciplinary research foundation. 6 Three quarters of the transfers are foreign remittances (Sletten and Egset, 2004).
According to Lundahl (2004), the Ministry of Haitians Living Abroad estimates about 2.5 million Haitian emigrants living in the United States, Canada, the Dominican Republic, Caribbean countries, and France, which represent more than a quarter of the total population of Haiti.
7 See Orozco (2006) for details about remittance economy in Haiti especially the conditions of migrants in the United States.
8 The odds ratio or relative risk ratio of choosing alternative j rather than alternative 1 (base) is given as ) exp( ) 1 Pr( ) Pr( j i i i y j y xcȕ
so exp(ȕjk)gives the proportionate change in the relative risk of choosing alternative
j rather than alternative 1 (base) when xik changes by one unit (Cameron and Trivedi,
2009: p.486).
gives the proportionate change in the relative risk of choosing alternative j rather than alternative 1 (base) when
World Bank, Haiti: Agriculture and Rural Development: Diagnostic and Proposals for
Agriculture and Rural Development Policies and Strategies, Washington, D.C.,
October 2005.
World Bank, Haiti: Options and Opportunities for Inclusive Growth, Country Economic Memorandum, Washington, D.C., June 2006.
ACKNOWLEDGEMENT
The author is grateful to Nobuaki Hamaguchi and Shoji Nishijima of Kobe University for the instruction and support and to the anonymous referees for helpful comments. She also thanks the Inter-American Development Bank (IDB) for providing the data. This paper is partially based on a research conducted during a summer internship at IDB in 2007. In addition, the research was partly financed by 2008 Tazaki Scholarship of Research Institute for Economics and Business Administration (RIEB) of Kobe University. The views expressed in this paper are entirely those of the author
ENDNOTES
1 World Bank Country Brief: http://web.worldbank.org/ (accessed on 08/06/2010) 2 Calculation based on household survey data in 2001 (Jadotte, 2007).
3 Income from self-employment consists of market sales of both agricultural and non-agricultural goods and excludes self-consumption.
4 For rural poverty analyses and agricultural development, see World Bank (2005, 2006) and Verner (2005, 2008). Arias et al. (2006) examine coffee sector, which has been the most important sector for agricultural export. For the government’s agricultural development strategies, see I-PRSP (2006), MPCE (2007), etc.
5 Fafo is a Norwegian independent and multidisciplinary research foundation. 6 Three quarters of the transfers are foreign remittances (Sletten and Egset, 2004).
According to Lundahl (2004), the Ministry of Haitians Living Abroad estimates about 2.5 million Haitian emigrants living in the United States, Canada, the Dominican Republic, Caribbean countries, and France, which represent more than a quarter of the total population of Haiti.
7 See Orozco (2006) for details about remittance economy in Haiti especially the conditions of migrants in the United States.
8 The odds ratio or relative risk ratio of choosing alternative j rather than alternative 1 (base) is given as ) exp( ) 1 Pr( ) Pr( j i i i y j y xcȕ
so exp(ȕjk)gives the proportionate change in the relative risk of choosing alternative
j rather than alternative 1 (base) when xik changes by one unit (Cameron and Trivedi,
2009: p.486).
changes by one unit (Cameron and Trivedi, 2009: p.486). 9 Even the primary and secondary completed workers have wage premia (Uhicyama, 2009), which indicates lower level of worker’s skill (education attainment) in Haiti.
10 Jadotte (2009) assesses the impact of remittances on labor market outcomes using data from ECVH 2001. He indicates that remittances increase the recipients’ reservation wages because
of the access to the non-market income flow. Furthermore, when we compare the average wage earnings between remittance receivers and non-receivers, remittance receivers earn higher wage (statistically significant at 5%). However, there is no statistically significant difference between wage workers in urban areas, but rural wage workers do have significant differences. 11 Haiti could take advantages of the geographical proximity to the United States once the infrastructure and institutional capacity are improved. Also, there is a preferential treatment for Haitian export of textile and garment (HOPEII) to the United States.
12 Haitian government recognizes the importance of these two sectors for the country’s development as well as agricultural improvement. See, for example, I-PRSP (2006) and MPCE (2007) for the government’s development strategies.
13 IDB has started a project to channel remittances toward human capital accumulation in Central America in 2010, which is still a pilot project in El Salvador.