Dishonesty and Future Public Servant's
Identity
著者
Ojima Takeshi, Tsuruta Manami, Hayashi Reona,
Morikawa So
journal or
publication title
TUPD Discussion Papers
number
4
page range
1-20
year
2021-05
Tohoku University Policy Design Lab Discussion Paper
TUPD-2021-004
Dishonesty and Future Public Servant’s Identity
Takeshi Ojima
Faculty of Economics and Business Administration, Fukushima University Policy Design Lab, Tohoku University
Manami Tsuruta
Doshisha University
Reona Hayashi
Fukushima University
So Morikawa
The University of Tokyo
May 2021
TUPD Discussion Papers can be downloaded from:
https://www2.econ.tohoku.ac.jp/~PDesign/dp.html
Discussion Papers are a series of manuscripts in their draft form and are circulated for discussion and comment purposes. Therefore, Discussion Papers cannot be reproduced or distributed without the written consent of the authors.
Dishonesty and Future Public Servant’s Identity
* Takeshi Ojimaa Fukushima University Manami Tsuruta Doshisha University Reona Hayashi Fukushima University So Morikawa The University of TokyoMay, 2021
Abstract
The injustice caused by public-sector workers can cause great harm to society. In this study, we conducted an experiment to investigate the misconduct of public-sector workers. We divided prospective public servants into two groups: treatment and control groups. To measure their cheating behaviors in the treatment group, participants were required to carry out a priming task to strengthen their awareness as future public servants, before conducting a cheating task (20 rounds). In the control group, participants conducted a cheating task after carrying out a task unrelated to public service. We found a non-monotonic effect of the treatment on misbehavior. We believe that our treatment had an effect on mitigating dishonest behaviors as well as promoting loss-averse behaviors. We infer that the priming effect promoted the dishonest behavior in future public servants in the loss domain.
JEL codes: C91, D73, K42
Keywords: Decision making, Laboratory experiments, Cheating, Public sector, Priming, Dishonesty
*This study design was approved by the Research Ethics Committee in Fukushima University. I am
deeply indebted to Ryohei Hayashi (Kochi University of Technology), Shinsuke Ikeda (Kwansei Gakuin University), Shunichiro Sasaki (Kindai University), and Shoko Yamane (The Papalaka Research Institute, Ltd.) for their comments and advice. This work was supported by JSPS KAKENHI Grant Number JP20K01626.
a Corresponding author. Faculty of Economics and Business Administration, Fukushima University,
1.
Introduction
The corruption of workers in the public sector causes great losses to society. Studies have long reported that increased fraudulent behavior in the public sector reduces a country's economic growth (Mo, 2001). This problem has led to numerous theoretical studies on fraudulent behavior in the public sector and the proposal of various policy implementations to keep such behaviors in check (e.g., Acemoglu & Verdier, 1998; Becker & Stigler, 1974; Besley & McLaren, 1993; Wadho, 2016). According to the results of a survey conducted by the Ministry of Internal Affairs and Communications of Japan, in the 2018 fiscal year, disciplinary proceedings were initiated against 1,782 people for general service violations, against 106 people for bribery, and against 76 people for cheating in examinations and recruitment. Therefore, it is important to investigate effective fraud prevention measures to bring such instances in check. Even though measures in economics, such as wage systems, monitoring of corruption, and employee selection have previously been devised, there is still a need to deepen our understanding of prevention measures.
To this end, this study aimed to investigate the priming effect of future public servants’ dishonesty. In our experiment, a group of aspiring public servants were given a priming task to strengthen their awareness of their status as future public servants. First, we recruited students taking a public service examination course at Fukushima University. Then, we divided the participants into two groups: the treatment and the control group. In the former, participants completed the priming task and were then engaged in a cheating task so their cheating behavior could be measured. The participants were not required to inform the experimenters of their cheating behavior. Participants could, therefore, cheat without their social image being impacted. We found a non-monotonic effect of the treatment on cheating behaviors. We hypothesized that the treatment mitigates dishonest behaviors and promotes loss-averse behaviors. Therefore, we inferred that the priming effect promoted dishonest behaviors of future public servants in a loss domain.
In the context of public administration, van der Wal et al. (2008) demonstrated that lawfulness and incorruptibility are more valued by managers in the public sector compared to the private sector. Additionally, Olsen et al. (2018) noted that behavioral dishonesty has a strong negative correlation to public service motivation. The present study is the first to investigate the priming effect of future public servants on dishonest behaviors. Our findings may suggest policies for the monitoring of the public sector in the loss domain or the introduction of a wage system that supports richer compensation at the time of loss.
Hanna and Wang (2017), who recruited Indian university students and engaged them in cheating tasks, found that dishonest students, who had high scores on the cheating task, are more likely to aspire to work in the public sector and in civil service. On the other hand, in the context of developed countries with low levels of corruption, we inferred that high ethical standards have been achieved in the public sector. The novelty of our paper is that we conducted the experiment
with students who aspire to work in the public sector in the context of a developed country and investigated the priming effect of future public servants’ dishonesty.
Hanna and Wang (2017) also measured the absenteeism rate of nurses in the Indian civil service and conducted an experiment on cheating tasks among nurses. The results explained nurses’ absenteeism rates—high scores on the cheating tasks indicated high absenteeism rates. Based on their findings, we analyzed new methods to deter misbehavior among students who aspire to become public servants.
There are many analyses in economics that focus on the priming effect, where prior stimuli unconsciously influence subsequent behavior (e.g., Benjamin et al., 2010, 2016; Chen et al., 2014; Cohn et al., 2015; Callen et al., 2014). The priming method employed in this study is based on the method of Cohn et al. (2015), who investigated the priming effect on the dishonest behavior of prisoners. In their experiment, half of the participants were asked questions that reminded them that they were incarcerated criminals, to prime the salience of their criminal identity. Subsequently, participants performed a cheating task. The results showed that priming promotes the cheating behaviors of prisoners.
2. Experimental Design
In this study, we employed the cheating task developed by Fischbacher and Föllmi-Heusi (2013). We recruited 66 students who took a public service examination course at Fukushima University and conducted the experiments from August to November 2019. During the experiment, participants were moved into a room simultaneously and given envelopes containing the surveys and a single dice in a cup. They were not privy to the actions of the other participants because they were all partitioned off. The participants were presented with a payoff structure of the dice number and a corresponding reward: each point on the dice corresponded with a gift certificate worth JPY 300.1 Thus, number one on the dice corresponded to one gift certificate (JPY 300); the
number two corresponded to two gift certificates (JPY 600); number three corresponded to three gift certificates (JPY 900); number four corresponded to four gift certificates (JPY 1200), and number five corresponded to five gift certificates (JPY 1500); number six corresponded to 0 gift certificates (JPY 0). Hereafter, we will refer to the number 6 on the dice as 0 for convenience.
We used the paper and pencil experiment. After receiving the instructions, the participants completed the experimental questionnaire, the priming task, the cheating task, and the
1 While cash rewards would have been preferable, it was not permitted at Fukushima
University. However, gift certificates sufficed, because there is a convenience store near the campus, where these gift certificates are accepted.
experimental questionnaire in that order. To investigate the priming effect on dishonest behavior, the priming task for the participants in the treatment group comprised questions related to the future public servant’s identity, while the questions in the control group were unrelated. These questions can be found in Appendix A.2. They were then asked to indicate their current emotional state using the Positive and Negative Affect Schedule (PANAS) (Watson et al., 1988).2
Subsequently, we conducted a manipulation check comprising six questions. The cheating task consisted of 20 rounds—in each round, participants rolled the dice, wrote down the number they rolled on a sheet of paper, and placed the paper in a sealed envelope. They had the option of cheating by writing down a higher number than they actually rolled. After the experiment, they went into another room one by one and rolled a sided dice. The number they rolled on the 20-sided dice would be the round that dictated their payoff. An experimenter opened the corresponding envelope (out of 20 envelopes) from the dice roll, and the number in the sheet was the reward the participants would receive. The show up fee was JPY 900 and the experiment lasted approximately 45 minutes.
3. Theory and hypothesis
We adopted the identity framework from Chon et al. (2015) and assumed that students have two identities. The first is a future public servant’s identity (FPSI) that does not cheat and the second is an economic identity (EI) that might cheat. Let 𝑥𝑑𝑖𝑐𝑒 denote the number on the dice. As mentioned above, the number 6 on the dice is referred to as 0; that is, 𝑥𝑑𝑖𝑐𝑒∈ {0,1,2,3,4,5}. 𝑥𝑑𝑖𝑐𝑒
corresponds to the amount of reward. 𝑥𝑃,𝑟𝑒𝑝𝑜𝑟𝑡 represents the number which FPSI wants to
report whereas 𝑥𝐸,𝑟𝑒𝑝𝑜𝑟𝑡 represents the number which EI wants to report. For simplicity, let
𝑥𝑃,𝑟𝑒𝑝𝑜𝑟𝑡 and 𝑥𝐸,𝑟𝑒𝑝𝑜𝑟𝑡 be continuous variables in [0,5]. We assume that FPSI desires to report
the true number on the dice
𝑥𝑃,𝑟𝑒𝑝𝑜𝑟𝑡∗ = 𝑥 𝑑𝑖𝑐𝑒.
Next, we assume that EI desires to report a higher number than they actually rolled for the higher corresponding reward and also suffer the psychological cost of their lying 𝜆(𝑥𝐸,𝑟𝑒𝑝𝑜𝑟𝑡−
𝑥𝑑𝑖𝑐𝑒) 2
.3 Given the dice number 𝑥
𝑑𝑖𝑐𝑒, we assume that EI’s utility is:
𝑈(𝑥𝐸,𝑟𝑒𝑝𝑜𝑟𝑡|𝑥𝑑𝑖𝑐𝑒) = 𝑥𝐸,𝑟𝑒𝑝𝑜𝑟𝑡− 𝜆(𝑥𝑟𝑒𝑝𝑜𝑟𝑡− 𝑥𝑑𝑖𝑐𝑒) 2
,
2 We use a Japanese version of the PANAS scales (Sato & Yasuda, 2001) since our experiment
was conducted in Japanese.
EI’s optimal reporting number is determined to maximize the utility as: 𝑥𝐸,𝑟𝑒𝑝𝑜𝑟𝑡∗ = { 1 2𝜆+ 𝑥𝑑𝑖𝑐𝑒, 𝑖𝑓 𝜆 2+ 𝑥𝑑𝑖𝑐𝑒< 5 5, 𝑜𝑡ℎ𝑒𝑟𝑠.
The student reports the number 𝑥𝑟𝑒𝑝𝑜𝑟𝑡 ∈ [0,5] to maximize the following utility: max 𝑥𝑟𝑒𝑝𝑜𝑟𝑡 −𝑤(𝑠)(𝑥𝑃,𝑟𝑒𝑝𝑜𝑟𝑡− 𝑥𝑟𝑒𝑝𝑜𝑟𝑡) 2 − (1 − 𝑤(𝑠)) (𝑥𝐸,𝑟𝑒𝑝𝑜𝑟𝑡− 𝑥𝑟𝑒𝑝𝑜𝑟𝑡) 2
where 𝑤(𝑠) ∈ [0,1] is the weight placed on the FPSI and 𝑠 represents the current strength of the FPSI, that is, 𝑤′ > 0. Thus, each optimal action lies between the optimal actions of the two
identities:
𝑥𝑟𝑒𝑝𝑜𝑟𝑡∗ = 𝑤(𝑠)𝑥𝑃,𝑟𝑒𝑝𝑜𝑟𝑡∗ + (1 − 𝑤(𝑠))𝑥𝐸,𝑟𝑒𝑝𝑜𝑟𝑡∗ .
Priming FPSI salience has the effect of moving their optimal action toward that identity. Therefore, we hypothesize that priming would mitigate future public servants’ dishonest behaviors. However, the results show that (i) on average, priming had no effect on mitigating dishonest behaviors; (ii) it did, however, have an effect on promoting loss-averse behaviors.
4. Results
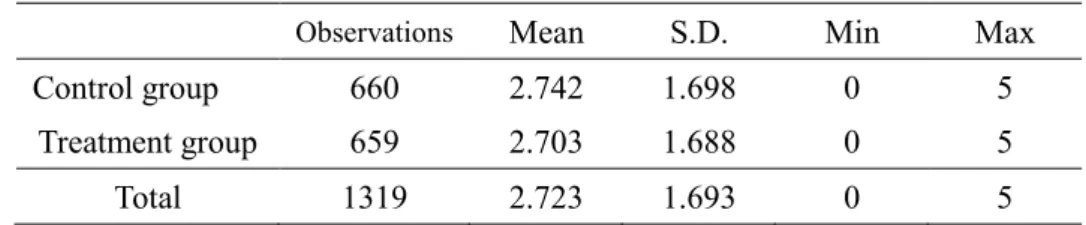
We excluded an envelope from one person since the number written on the sheet was illegible. Thus, the sample size for this study was 1319 (20 rounds × 66 persons - 1). As observed in Table 1, which shows the descriptive statistics for the subjects in the control and treatment groups, there is no significant difference in personal attributes between control and treatment groups. The part-time income refers to the value of monthly income (in thousands of yen) earned from a part-part-time job. Cognitive ability is the number of correct answers given to three questions on the cognitive reflection test (Frederick, 2005). Positive and negative emotions were measured using a questionnaire with the PANAS scale after priming. Altruism is calculated by the answer provided in the dictator game without monetary reward in the post-questionnaire. Specifically, the question is “Suppose that you are going to get JPY 1000 and you can distribute some of it to an anonymous student who participates in the same experiment. How would you distribute the money?”. We used the answer as a measure of altruism.
Not only did the priming remind them of their aspirations to work in public service, it also reminded them of their aspirations to become working members of the society.4 They believed
that they need to be prepared to be a working member of the society when they obtain a job after graduating from college. For example, they believed that they need to be proactive in their work, be punctual with their work schedule, share information in the workplace, and work smoothly and cooperatively with coworkers. To identify the effect of salience of awareness of a working member of society, we asked them two questions, “In general, what kind of attitude do you think is necessary to become a working member of society? Please select from the following the attitudes based on your preferences.” and “Based on the above answers, how much are you currently prepared to be a working member of society?”. We used their response to the second question in the post-questionnaire as a measure of their awareness of a working member of society.
[Figure 1] [Table 2]
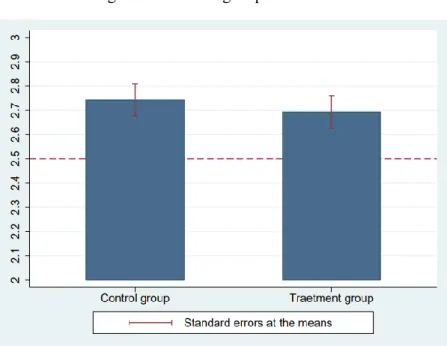
Figure 1 and Table 2 show the average reported number in control and treatment groups. In Figure 1, the red dashed line indicates the theoretically expected value that all participants reported honestly. The average reported number was not significantly different between the control and treatment groups (one-sided t-test, t = 0.4273, p = 0.3346). Thus, on average, priming had no effect on mitigating dishonest behaviors.
[Figure 2] [Table 3]
Figure 2 indicates the distribution of reported numbers by treatment condition and control condition. The red dashed line indicates the theoretical distribution that all participants honestly reported their results (a uniform distribution of 1/6). Table 3 shows the descriptive statistics of the reported number. We find that most of the participants were honest. We assumed that all of the participants who reported 0 did so truthfully. The proportion of participants who reported the number 0 was 13.64%. In contrast, Abeler et al. (2019), who combined data from 429 experiments in 90 papers involving over 44,000 participants from 47 countries, found that the mean proportion of participants reporting the lowest outcome was around 7%.
[Table 4]
As observed in Figure 2, both the control and treatment groups have a high percentage of reported numbers with high reward amounts and a low percentage of reported numbers with low
4 Many students work a part-time job but they spend most of their time on their studies.
Therefore, their awareness as a student is stronger compared to their awareness as a working member of society.
reward amounts. A binomial test was conducted for both the groups independently to see if the percentage of reported numbers was different from 1/6 when the value was honest. The results, summarized in Table 4, found that the percentage of reported numbers for the control group was significantly different from 1/6 for the reported numbers of 0, 1, 4, and 5; the treatment group was significantly different from 1/6 for the reported numbers of 0, 2, and 3. Therefore, we presumed that there were two directions of the treatment effect. First, the distribution was slightly flattened. Second, the proportion of those reporting 2 decreased, while the proportion of those reporting 3 increased. The latter effect implies that priming promoted cheating behavior only in situations where students reported number 2 without priming. We performed a multinomial probit regression to focus on this priming effect.
[Table 5]
The sample size 𝑁 is 1319 and the estimation results are shown in Table 5. Let the selected reported numbers be 𝑥𝑖 (𝑖 = 1, … , 𝑁) and the vector of explanatory variables be 𝒛𝒊𝒋 (𝑗 =
0,1,3,4,5). The multinomial probit model based on the reported number of 2 can be expressed as: 𝑥𝑖 = 𝑗, if max
𝑗∈{0,1,2,3,4,5}𝑢𝑖𝑗 ∗
𝑢𝑖𝑗∗ = 𝛼𝑗+ 𝜷′𝒛𝒊𝒋+ 𝑣𝑖𝑗, 𝑗 = 0, 1, 3, 4, 5.
Here, 𝑢𝑖𝑗∗ represents the utility for each reported number, which is normalized to 𝑢 𝑖2
∗ = 0. 𝜷
is the regression coefficient, and 𝒗𝒊= (𝑣𝑖0, 𝑣𝑖1, 𝑣𝑖3, 𝑣𝑖4, 𝑣𝑖5) is the error term following a
five-variate normal distribution with mean 𝟎 and variance-covariance matrix 𝚺.
In Table 5, Treatment is a dummy variable indicating the presence of FPSI salience priming. As shown in Table 5, the probability of reporting 1 and 3 is higher in the treatment effect, which shows a non-monotonic effect on the participants’ cheating behaviors. We presumed that treatment would have two effects: mitigating the cheating effect and intensifying loss-averse preference. The detailed discussion is provided in Section 5.
The other dummy variables include a female dummy variable and a dummy variable indicating the student's major. The round indicates the number of tasks out of a total of 20. In this experiment, the probability of reporting a 1 decreased with the each passing round, which can be inferred as an increase in lying. The higher the monthly part-time income, the lower the probability of reporting 0, and the higher the probability of reporting 5. This might be because people who earn higher part-time income have a higher opportunity cost per unit of time. They might expect more compensation for participating in the experiment and be more strongly incentivized to lie. We can confirm from Table 5 that people with a stronger awareness of their status as a working member of society were less likely to lie; however, those who were more altruistic were no less likely to lie. Thus, the treatment effect is still significant, even with altruism and the awareness of being a working member of society. Furthermore, while we instructed the
subjects not to share the contents of the experiment with each other, we also controlled for the session because the later the session was, the more the subjects shared the contents of the experiment with each other, which may have influenced their behavior. Finally, similar to Cohn et al. (2015), we controlled for emotion and cognitive ability.
5. Discussion
As shown in Section 2, two directions were reported for the treatment effect. First, the proportion of those reporting number 2 decreased while those reporting 1 increased. Second, the proportion of those reporting 2 decreased while the proportion of those reporting 3 increased. There was a non-monotonic effect on the cheating behaviors exhibited by the participants. We presumed that the treatment had two effects: mitigating the cheating effect and intensifying the preference for loss-aversion. We now explain why loss-averse participants were less likely to report number 2 and are more likely to report number 3. Consider a participant comparing payoffs between reporting number 𝑥 and 𝑥 + 1. The marginal benefit is JPY 300, and the marginal cost is the psychological cost of cheating. We assume that the reference point is expected dice number 2.5. Then, the loss domain is {0,1,2} and the gain domain is {3,4,5}. When 𝑥 = 1, the marginal utility from JPY 300 is small because the reported number remains in the loss domain. In contrast, when 𝑥 = 2, the marginal utility from JPY 300 is relatively large because the reported number moves from a loss to a gain domain. Therefore, when 𝑥 = 2, the marginal utility is likely to be larger than the disutility from the psychological costs. Thus, loss-averse participants were less likely to report number 2 and more likely to report number 3.
Our conjecture is well-supported by several existing papers. Garbarino et al. (2019) showed that loss-averse agents were more likely to lie to avoid receiving a low payoff, both theoretically and empirically. Likewise, Deslatte et al. (2020) also showed that public employees have a higher tendency for loss-aversion. These results implied that priming the salience of their FPSI activated their traits, high tendency for loss-aversion as well as incorruptibility, and promotes the cheating behaviors of subjects.
In our experiment, we needed to demonstrate that priming would promote loss-averse behavior and that students would have a reference point of 2.5. However, while we found no concrete evidence (which we shall re-examine in a future study), we did manage to find weak evidence for the same. While recruiting participants for the experiment, we presented an expected amount of rewards (JPY 1650). However, we did mention that their rewards would depend on their performance, which could range anywhere from JPY 900-2400. In the instructions, participants were also informed that their fee for taking part in the experiment was JPY 900. As such, participants should have been easily able to calculate that their expected reward, without a show up fee, was JPY 750. Therefore, it was possible that participants believed they would receive
JPY 1650, and that they had a reference point of 2.5. As such, it is possible that cheating was used as a loss-aversion tactic, and that priming future public servants increased the tendency of loss aversion, thus resulting in a decrease in those reporting 2 and an increase in those reporting 3.
In manipulation check, we asked the students to solve five fill-in-the-blank questions for Chinese characters, e.g., 自__. Priming was assumed to be effective if they answered 自治体 (municipality), which is related to the public sector, and ineffective if they answered 自分 (myself), which is completely unrelated. The number of answers related to the public sector was used as the score. Unfortunately, this manipulation check did not work and no significant difference in the scores between the control and treatment groups was observed. To check the validity of results for priming effects, we removed the subjects with a score of zero (10 people) and analyzed the results again.
[Table 6] [Figure 3]
[Table 7]
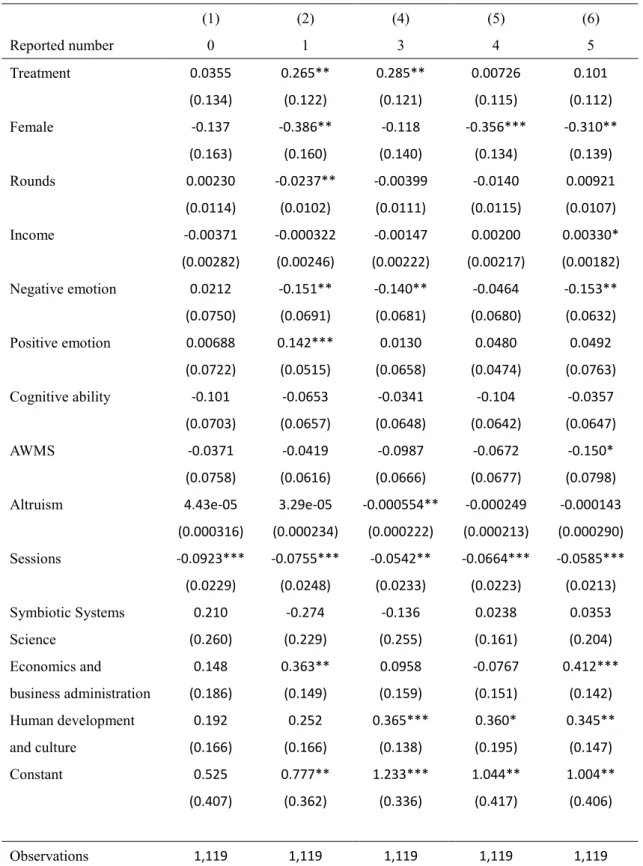
Table 6 shows that there is no significant difference in personal attributes between control and treatment groups after removing the samples. As shown in Figure 3, the treatment effect persists. The distribution was slightly flattened, with a decrease in the proportion of those reporting 2, and an increase in those reporting 3. From the results of a multinominal probit regression in Table 7, the removal of the subjects with a score of zero highlights the treatment effects. The probability of reporting one and three was higher in the treatment effect and the coefficient was larger than the previous result in Table 5. Thus, we can conclude that the manipulation check did not work; However, our results are robust.
6.
Conclusion
We found that priming future public servants increased the tendency toward loss-aversion, which resulted in a decrease in the proportion of those reporting number 2 and an increase in those reporting 3. While priming future public servants mitigates dishonest behavior, it also promotes cheating behavior as a loss-aversion tactic. Therefore, on average, priming had no mitigating effect on dishonest behavior. The policy implication is that fraud prevention measures in the loss domain probably effective. In any future work building from this study, it is necessary to compare the degree of loss aversion between workers in the private and public sector, to clarify the conditions under which a worker in the public sector is more likely to take risks, and to clarify that cheating is indeed a loss-aversion tactic.
A. Appendix
A.1 Explanation of the Experiment
⚫ This is an experiment on economic behavior.
⚫ Before the experiment, please read these instructions carefully. If you have any
questions, please raise your hand and call the experimenter.
Gratuity for the experiment
⚫ You will receive QUO cards (gift cards) worth JPY 900 as a reward for participating
in the experiment.
⚫ In this experiment, you will first answer Form A, B, and C, in that order. Next, you
will roll the dice in the cup on your desk, write the results on a small sheet of paper,
and place them in the small envelopes. Finally, answer the questionnaire in Form D.
Please ensure that all forms are placed in their respective envelopes.
⚫ Your final reward will be JPY 900 (the participation reward) plus the result of one of
the 20 tasks randomly selected after the experiment.
⚫ You will not know in advance result will be chosen. Please note that the 20 tasks are
all weighted equally.
A.2 Priming task A.2.1 Treatment group
1. On average, how much time per week do you spend studying for the civil service
exam?
2. What job would you to work in after you become a public servant?
3. Why do you want the said job?
4. What do you think should be changed in the current work system, in terms of salary,
duties and other factors? Please give up to 3 answers.
5. What kind of personality do you think is suitable for a civil servant? Please give up
to 3 answers.
6. What do you think is the probability that you will pass the civil service examination?
A.2.2 Control group
video sites, applications, and online games) for entertainment purposes? If you
answered "0 hours", please proceed to question 6.
2. What kind of websites (applications) do you browse on the Internet for
entertainment?
3. Why you use such sites (applications)? Please provide up to three reasons.
4. What, if any, improvements can be made to the sites (applications) that you prefer?
Please provide give up to three suggestions.
5. What attributes (e.g., gender, age, occupation) do you think are common among
people who like your preferred site? Please provide up to three answers.
6. What, in your opinion, is the percentage of college students who do not use the
Internet for entertainment purposes?
A.3 Answer sheet for the cheating task (below is the answer sheet for Round 1)
Task ①
As shown below, place the dice in the cup and cover it. Shake the
cup to roll the dice, check the number that comes up (the top side)
and fill it in the sheet of paper.
Payoff structure of dice number and a corresponding reward
Number shown on the dice is ___
Number shown on
the dice
1
2
3
4
5
6
Reward (
yen
)
300
600
900
1200
1500
0
ID No.__
See the dice in the cup
Report the number
shown on the dice
References
Abeler, J. Nosenzo, D. and Raymond, C.: Preferences for truth-telling. Econometrica 87, 1115– 1153 (2019)
Acemoglu, D. and Verdier, T.: Property rights, corruption and the allocation of talent: a general equilibrium approach. The Economic Journal 108 (450):1381–1403. (1998)
Becker, G. S. and Stigler, G. J.: Law enforcement, malfeasance, and compensation of enforcers. The Journal of Legal Studies 3 (1), 1–18. (1974)
Benjamin, D. J., Choi, J. J. and Fisher, G.: Religious Identity and Economic Behavior. The Review of Economics and Statistics 98(4), 617-637. (2016)
Benjamin, D. J., Choi, J. J. and Stricland, J. A.: Social Identity and Preferences. American Economic Review 100, 1913–1928. (2010)
Besley, T. and McLaren, J.: Taxes and bribery: the role of wage incentives. The Economic Journal 103 (416), 119–141. (1993)
Callen, M., Isaqzadeh, M., Long, J. D. and Sprenger, C.: Violent Trauma and Risk Preference: Experimental Evidence from Afghanistan. American Economic Review 104, 123–148. (2014)
Chen,Y., Li, S. X., Liu, T. X. and Shih, M.: Which Hat to Wear? Impact of Natural Identities on Coordination and Cooperation. Games and Economic Behavior 84, 58–86. (2014)
Cohn, A., Maréchal, M.A., Noll, T.: Bad boys: how criminal identity salience affects rule violation. Review of Economic Studies 82, 1289–1308. (2015)
Fischbacher, U., and Föllmi-Heusi, F.: Lies in disguise — an experimental study on cheating. Journal of the European Economic Association 11(3), 525–547. (2013)
Garbarino, E., Slonim, R., and Villeval, M. C.: Loss aversion and lying behavior. Journal of Economic Behavior and Organization 158, 379–393. (2019)
Hanna, R., Wang, S.: Dishonesty and selection into public service: Evidence from India. American Economic Journal: Economic Policy 9, 262–290 (2017)
Olsen, A. L., Hjorth, F., Harmon, N., and Barfort, S.: Behavioral dishonesty in the public sector. Journal of Public Administration Research And Theory 572–590 (2019)
Sato, A., and Yasuda, A.: Development of the Japanese version of Positive and Negative Affect Schedule (PANAS) scales. The Japanese Journal of Personality 9, 138–139. (2001)
van der Wal, Z. Graaf, G.D. Lasthizen, K.: What’s valued most? Similarities and differences between the organizational values of the public and private sector. Public Administration 86, 465-482. (2008)
Wadho, Waqar Ahmed.: Corruption, tax evasion and the role of wage incentives with endogenous monitoring technology. Economic Inquiry 54 (1), 391–407. (2016)
Watson, D., Clark, L.A., and Tellegen, A: Development and validation of brief measures of positive and negative affect: the PANAS scales. Journal of Personality and Social Psychology 54(6), 1063–1070. (1988)
B. Tables
Table 1. Descriptive statistics for subjects in the control and treatment groups Control group Treatment group t-test two-sided P value Number of females 10 11 Number of males 23 22 Female percentage (%) 30.303 33.333 𝑡 = −0.2604 𝑝 = 0.7954 Average reported number
2.742 2.703 𝑡 = 0.4273, 𝑝 = 0.6692 Average part-time work income (in
thousands of yen) 33.879 35.424
𝑡 = −0.2431, 𝑝 = 0.8087 Average cognitive skills
1.848 1.576 𝑡 = 1.0884, 𝑝 = 0.2805 Average positive emotions
2.370 2.458 𝑡 = −0.4285, 𝑝 = 0.6697 Average negative emotions
2.057 2.136 𝑡 = −0.2967, 𝑝 = 0.7676 Average awareness as a working member
of society 3.455 3.758 𝑡 = −1.6357, 𝑝 = 0.1068 Average altruism 418.182 392.424 𝑡 = 0.4882, 𝑝 = 0.6271 Table 2. Descriptive statistics for reported number by conditions
Observations Mean S.D. Min Max Control group 660 2.742 1.698 0 5
Treatment group 659 2.703 1.688 0 5 Total 1319 2.723 1.693 0 5
Table 3. The proportion of reported numbers by conditions 統制群 処置群 合計 0 Observations 90 90 180 (%) (13.64) (13.66) (13.65) 1 Observations 92 102 194 (%) (13.94) (15.48) (14.71) 2 Observations 108 92 200 (%) (16.36) (13.96) (15.16) 3 Observations 111 132 243 (%) (16.82) (20.03) (18.42) 4 Observations 126 116 242 (%) (19.09) (17.6) (18.35) 5 Observations 133 127 260 (%) (20.15) (19.27) (19.71) Total N 660 659 1,319 (%) 100 100 100 Table 4. The result of binominal test (p-value)
Control group Reported number 0 1 2 3 4 5 One-sided test X<1/6 0.986 0.975 0.599 0.475 0.055* 0.011** X>1/6 0.019** 0.032** 0.442 0.567 0.956 0.992 Two-sided test 0.037** 0.060* 0.876 0.917 0.095* 0.019** Treatment group Reported number 0 1 2 3 4 5 One-sided test X<1/6 0.975 0.806 0.975 0.019** 0.233 0.060* X>1/6 0.032** 0.225 0.032** 0.985 0.798 0.952 Two-sided test 0.063* 0.458 0.063* 0.034** 0.427 0.111 **, * indicate statistical significance at the 5 and 10 percent levels, respectively.
Table 5. The result of multinomial probit regression (1) (2) (4) (5) (6) Reported number 0 1 3 4 5 Treatment 0.0631 0.173* 0.278** 0.0814 0.107 (0.112) (0.103) (0.113) (0.108) (0.0990) Female -0.189 -0.299** -0.259* -0.384*** -0.286** (0.137) (0.148) (0.137) (0.132) (0.128) Rounds -0.00550 -0.0261*** -0.00651 -0.0116 0.00708 (0.0105) (0.00977) (0.00989) (0.0103) (0.00982) Income -0.00545** -0.000407 0.000135 0.000784 0.00432** (0.00240) (0.00217) (0.00215) (0.00241) (0.00200) Negative emotion 0.0224 0.144*** 0.0612 0.0631 0.0109 (0.0547) (0.0448) (0.0626) (0.0492) (0.0667) Positive emotion -0.0296 -0.133** -0.147** -0.100 -0.130** (0.0704) (0.0667) (0.0631) (0.0733) (0.0594) Cognitive ability -0.0942 -0.0559 -0.0674 -0.0790 -0.0162 (0.0574) (0.0623) (0.0608) (0.0625) (0.0551) AWMS -0.0225 -0.0441 -0.138** -0.102 -0.161** (0.0727) (0.0726) (0.0689) (0.0763) (0.0820) Altruism -2.16e-06 -0.000199 -0.000214 -0.000138 -4.08e-05
(0.000264) (0.000231) (0.000242) (0.000190) (0.000274) Sessions -0.0838*** -0.0554** -0.0407* -0.0298 -0.0510*** (0.0193) (0.0245) (0.0247) (0.0247) (0.0189) Symbiotic Systems Science 0.145 -0.218 -0.310 -0.0851 0.136 (0.174) (0.201) (0.245) (0.170) (0.168) Economics and business
administration
0.219 0.293** 0.0942 -0.0292 0.287** (0.166) (0.133) (0.146) (0.152) (0.122) Human development and
culture 0.172 0.117 0.181 0.107 0.243* (0.146) (0.168) (0.193) (0.200) (0.135) Constant 0.687* 0.782** 1.220*** 1.104** 0.977** (0.399) (0.377) (0.314) (0.441) (0.388) Observations 1,319 1,319 1,319 1,319 1,319 Base outcome is reported as number 2. Standard errors in the parenthesis are clustered by individual level.
Table 6. Balance Check after removing sample with a score zero Control group Treatment group t-test two-sided P value Number of females 10 9 Number of males 23 14 Female percentage (%) 30.303 39.13 𝑡 = −0.2604, 𝑝 = 0.7954 Average reported number
2.742 2.678 𝑡 = 0.6337, 𝑝 = 0.5264 Average part-time work income (in
thousands of yen) 33.879 37.043 𝑡 = −0.4650, 𝑝 = 0.6438 Average cognitive skills
1.848 1.609 𝑡 = 0.8394, 𝑝 = 0.4049 Average positive emotions
2.370 2.505 𝑡 = −0.5683, 𝑝 = 0.5722 Average negative emotions
2.057 2.179 𝑡 = −0.4059, 𝑝 = 0.6864 Average awareness as a working member
of society 3.455 3.739 𝑡 = −1.3086, 𝑝 = 0.1962 Average altruism 418.182
347.826 𝑡 = 1.2219, 𝑝 = 0.2271
Table 7. The result of multinomial probit regression after removing sample with a score zero (1) (2) (4) (5) (6) Reported number 0 1 3 4 5 Treatment 0.0355 0.265** 0.285** 0.00726 0.101 (0.134) (0.122) (0.121) (0.115) (0.112) Female -0.137 -0.386** -0.118 -0.356*** -0.310** (0.163) (0.160) (0.140) (0.134) (0.139) Rounds 0.00230 -0.0237** -0.00399 -0.0140 0.00921 (0.0114) (0.0102) (0.0111) (0.0115) (0.0107) Income -0.00371 -0.000322 -0.00147 0.00200 0.00330* (0.00282) (0.00246) (0.00222) (0.00217) (0.00182) Negative emotion 0.0212 -0.151** -0.140** -0.0464 -0.153** (0.0750) (0.0691) (0.0681) (0.0680) (0.0632) Positive emotion 0.00688 0.142*** 0.0130 0.0480 0.0492 (0.0722) (0.0515) (0.0658) (0.0474) (0.0763) Cognitive ability -0.101 -0.0653 -0.0341 -0.104 -0.0357 (0.0703) (0.0657) (0.0648) (0.0642) (0.0647) AWMS -0.0371 -0.0419 -0.0987 -0.0672 -0.150* (0.0758) (0.0616) (0.0666) (0.0677) (0.0798) Altruism 4.43e-05 3.29e-05 -0.000554** -0.000249 -0.000143
(0.000316) (0.000234) (0.000222) (0.000213) (0.000290) Sessions -0.0923*** -0.0755*** -0.0542** -0.0664*** -0.0585*** (0.0229) (0.0248) (0.0233) (0.0223) (0.0213) Symbiotic Systems Science 0.210 -0.274 -0.136 0.0238 0.0353 (0.260) (0.229) (0.255) (0.161) (0.204) Economics and business administration 0.148 0.363** 0.0958 -0.0767 0.412*** (0.186) (0.149) (0.159) (0.151) (0.142) Human development and culture 0.192 0.252 0.365*** 0.360* 0.345** (0.166) (0.166) (0.138) (0.195) (0.147) Constant 0.525 0.777** 1.233*** 1.044** 1.004** (0.407) (0.362) (0.336) (0.417) (0.406) Observations 1,119 1,119 1,119 1,119 1,119 Base outcome is reported as number 2. Standard errors in the parenthesis are clustered by individual
C. Figures
Figure 1. The average reported number
Figure 2. The proportion of reported numbers by conditions.
0 5 10 15 20 0 1 2 3 4 5 0 1 2 3 4 5 Control Treatment p e rce n t
Figure 3. The proportion of reported numbers after removing sample with a score zero 0 5 10 15 20 0 1 2 3 4 5 0 1 2 3 4 5 Control Treatment p e rce n t Graphs by treat