Influence of location of osseointegrated
implant on stress distribution in implant
supported longitudinal removable partial
dentures: 3-dimensional finite element
analysis
著者
劉 洋
学位授与機関
Tohoku University
博⼠論⽂
INFLUENCE OF LOCATION OF OSSEOINTEGRATED IMPLANT
ON STRESS DISTRIBUTION IN IMPLANT SUPPORTED
LONGITUDINAL REMOVABLE PARTIAL DENTURES:
3-DIMENSIONAL FINITE ELEMENT ANALYSIS
LIU YANG
A Dissertation Submitted For Degree Of Doctor Of Philosophy Department of Advanced Prosthetic Dentistry
Graduate School of Dentistry Tohoku University
Table of Contents
Table of Contents Abstract
List of Tables and Figures
Chapter 1: INTRODUCTION 1
Chapter 2: MATERIALS AND METHODS 5
2.1 Experimental materials and equipment 5
2.2 Models 5
2.3Experimental methods 6
2.4 Hypothesis of mechanical parameters and experimental conditions of the material 10
2.5 Loading conditions and constraint conditions 10
2.6 Selection and finite element analysis of analytical data 11
2.7 Statistical method 11 Chapter 3: RESULTS 13 3.1 Implant 13 3.2 Cortical bone 13 3.3 Cancellous bone 14 3.4 Mucosa 14
3.5 Displacement of the denture framework 15
Chapter 4: DISCUSSION 17
4.1 Impact of implant assistance on the sustentacular tissue and denture 17
4.2When an implant is at different positions 19
Chapter 5: CONCLUSION 22
References 23
Abstract
Purpose: The purposes of the study were to evaluate the biomechanical behavior of a
mandibular distal extension removable partial denture associated with an implant, including its different distribution on stress within bone, alveolar mucosa, and implant, as well as on the displacement of alveolar mucosa and RPD.by 3-dimensional Finite Element method.
Materials and methods: The 3-dimensional finite element analysis method was selected to
evaluate the stress values, distribution and displacement in six geometric 3-D models which were prepared by FEM software package and CT scan of patient mandible, composed of: mandibular, alveolar mucosa, nature tooth and distal extension RPD with implant support. All implants have the same specifications 4.1 *10 mm. Six mandible models were simulated: model A containing tooth 31-33,41,42 and the distal alveolar edge; model B–similar to model A, but with a conventional removable partial denture to replace the absent teeth; model C–F to simulate the situation of different distribution positions; 50 N vertical forces were utilized as load cases. Stress distribution and Von Mises stress values were assessed for simulated tissues and implants. Also 3-dimensional displacement of alveolar mucosa and RPD were evaluated using FEM software.
Results: 1. With or without implant support, stress concentrations occur in the buccal side of
the alveolar ridge in the premolar area.2. Using implant to support RPD can reduce the Von Mises stress on the cortical bone and alveolar mucosa. At the same time, the deformation of
the denture and alveolar mucosa is reduced, and the Von Mises stress of the cancellous bone is increased under load.3. Under the functional load, the denture is prone to uneven deformation, and it appears in the mistal retainer. With the support of the implant, the denture displacement is reduced and the deformation is uniform.4. As the implant moves in the distance, the support for the premolar area has gradually eased and support for the molar area has increased. The implant bears most of the load under functional loading.
Conclusions: 1. The maximum stress of cortical bone, cancellous bone and mucous under
the functional load of traditional longitudinal partial denture is concentrated on the buccal side of the premolar area.2. The support of the implant reduces the burden on the abutment while making the occlusal force distribution more uniform.3. The maximum stress of the implant is concentrated in the neck and 1/3 of the root.4. In the premolar area, the implant effectively disperses the force and reduces the stress value of the cortical bone; In the molar area, the cortical bone takes more occlusal force and the implant is protected.
List of Tables and Figures
Table 1. Group of Experiments
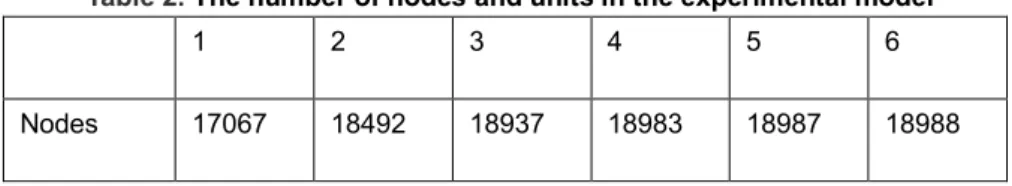
Table 2. The number of nodes and units in the experimental mode Table 3. Material mechanics parameter
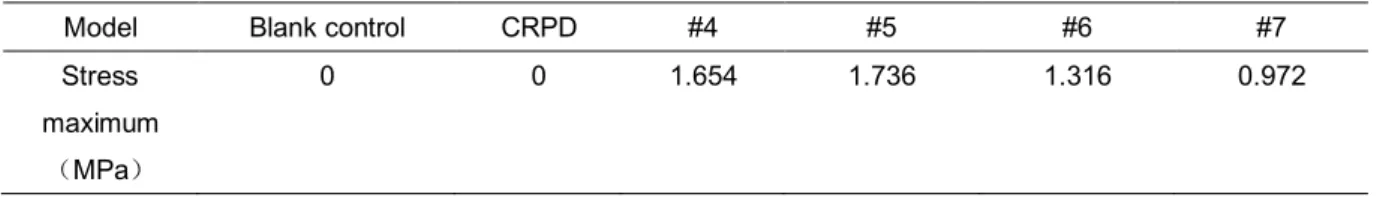
Table 4. Maximum stress of an implant
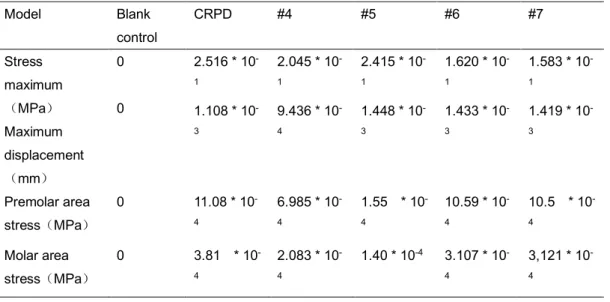
Table 5. The maximum stress value of cortical bone of an implant Table 6. Maximum stress for cancellous bone at the time of one implant Table 7. The maximum stress value of the mucosa of an implant
Table 8. The maximum deformable value of a denture of an implant
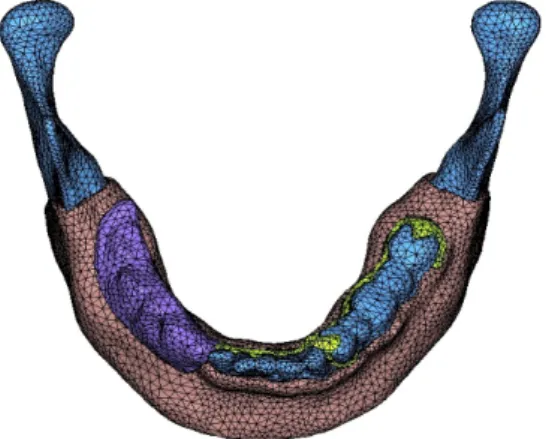
Figure 1. CBCT scan of mandible before implantation with unilateral free dentition defect Figure 2. Mandibular-mucosa 3d finite element model
Figure 3. Mandible-mucosa-implant 3d finite element model Figure 4. 3d finite element model of denture
Figure 5. Mandibular - mucosa - denture 3d finite element model 3d Figure 6. Assemble an implant to the diagram
Figure 7. Diagram of loading conditions Figure 8. The implant is located at 4 Figure 9. The implant is located at 5
Figure 10. The implant is located at 6 Figure 11. The implant is located at 7 Figure 12. Maximum stress of an implant Figure 13. Blank control group
Figure 14. CRPD control group Figure 15. The implant is located at 4 Figure 16. The implant is located at 5 Figure 17. The implant is located at 6 Figure 18. The implant is located at 7
Figure 19. The maximum stress value of cortical bone of an implant Figure 20. Blank control group
Figure 21. CRPD control group Figure 22. The implant is located at 4 Figure 23. The implant is located at 5 Figure 24. The implant is located at 6 Figure 25. The implant is located at 7
Figure 26. Maximum stress for cancellous bone at the time of one implant Figure 27. The stress of CRPD group
Figure 29. The implant is located at 4 Figure 30. The implant is located at 5 Figure 31. The implant is located at 6 Figure 32. The implant is located at 7 Figure 33. The implant is located at 4 Figure 34. The implant is located at 5 Figure 35. The implant is located at 6 Figure 36. The implant is located at 7
Figure 37. The maximum stress value of the mucosa of an implant Figure 38. CRPD control group
Figure 39. The implant is located at 4 Figure 40. The implant is located at 5 Figure 41. The implant is located at 6 Figure 42. The implant is located at 7
1
Chapter 1. INTRODUCTION
Conventional removable partial dentures (RPD) are often used to repair Kennedy class II dentition defect with unilateral distal extension absence. As a result of the dissimilarity of the periodontal ligament of the abutment teeth and the mucosa and also the differences in such separability, the denture base sinks towards the tissue under the action of the occlusal force, leading to unstable phenomena such as rotational motion with the end abutment teeth as a fulcrum. In addition, the setting of the indirect retainer on the opposite side of the fulcrum line is likely to cause damage to the abutment teeth. If long-term use of distal extension RPD, due to the constant pressure on the abutment teeth and the tissue, as well as the permanent existence of the absorption of the alveolar ridge in the edentulous area, it will inevitably result in abutment loose, poor retention and stability and also low chewing efficiency [1]. Further,
in general, as the molars and premolars are missing, the center of the occlusal force gradually moves toward the mistal direction. The loss of occlusal contact at the distal extension often breeds temporomandibular joint syndrome.
In the division of RPD, Wang Zhengshou[2] described the sixth category as that most or
all of the teeth on one side of the arch are missing, the abutment teeth were all on the other side of the arch and the abutment teeth side may also have anodontia by the design form of dentures, the teeth missing position and the number of gaps. In this situation, the retainer is usually placed on the opposite side of the edentate arch to form a partial denture supported
2
by the longitudinal fulcrum line. This method is prone to buccal and lingual rotation along the front and back rotation axis of the denture and leading to more severe instability. Although Xu Jun [3] proposed the idea of placing the retention arm on the lingual side in this
case, However, while ameliorating the force of the abutment, it puts higher demands on the alveolar ridge and the mucosa. Therefore, the repair and stress distribution of the longitudinal partial denture for the Kennedy class II dentition defect deserve more attention.
In recent years, the combination of implants and partial dentures has been used to repair the distal extension absence, providing a new treatment option for patients in these cases. The support of the implant can effectively disperse the occlusal force of abutment teeth and the tissue, reduce bone resorption, prolong the life of abutment teeth and thus better stability and health preservation of soft and hard tissues. Some studies [2,3,4] have shown that even a
short implant can provide support for distally extension removable partial dentures and it is expected to reduce overload. Rocha [5] also reached the same conclusion. In an in vitro
experiment, Maki [6] measured the difference between the displacement of the denture and
the stress on the soft tissue based on the distal extension RPDs with and without the assistance of the implant. The result showed that the displacement and stress of the implant-assisted denture were significantly smaller than those of conventional partial dentures. Thus, it proved that the placement of the implant can prevent the displacement of the distal extension partial denture and reduce the pressure on the soft tissue. Grossmann et al [7,8,9,10] recommended the
3
second molar position of the implant to enhance support and stability, meantime, the implant be placed near the distal abutment event the posterior alveolar ridge in bad condition. Compared with CRPD (conventional removable partial denture), the ISRPD (implant support removable partial denture) can be designed to have a smaller denture support area and provide much more comfort for patients. Therefore, an implant can appropriately reduce the area of the denture base, reduce the number of clasps, improve the aesthetic and chewing efficiency, producing better self-cleaning performance, which is beneficial to the maintain oral hygiene. Kuzmanovic et al. [11] had a significant effect on the Kennedy class I edentulous cases with
removable dentures and bilateral posterior implants. No complications were found during 2 years of follow-up. In the in vivo experimental study [12] on the implant-assisted partial
denture, it concluded that the implant-assisted RPDs are better in comfort, chewing efficiency, retention and stability than traditional dentures.
In the clinical use, the longitudinal partial denture shows great instability, difficulties in repairing and poor restoration effect. Further, there are only a small number of related literatures of basic research and clinical research, suggesting its great degree of difficulty. In this study, the Kennedy class II dentition defect with the loss of most unilateral teeth is selected as the research object. The implant is placed into the distal-extension absent alveolar ridge to support the longitudinal denture in a bid to change the linear support of the longitudinal denture into the surface support to secure the stability. Analyze and discuss the
4
stress distribution of the implant-assisted longitudinal partial denture by finite element analysis (FEA) is an attempt to go deeper into the safety and stability of the implant and the health situation of the tissue, to provide references for related research and work in the future.
5
Chapter 2. MATERIALS AND METHODS 2.1 Experimental materials and equipment
2.1.1 Hardware: KaVo 3D eXam, KaVo inc., German CT scanner; Dell commercial desktop,
processor memory 64GB, 128G hard disk, operating system win7 64-bit.
Soft tissue horizontal implant, standard neck, diameter 4.1mm, length 10 mm. Healing base platform height: 2mm.
2.1.2 Software: Mimics 17 (Materialise, Inc); Geomagic studio2012 (Geomagic,
Inc);Hypermesh 12.0(Altair, Inc);Abaqus 6.13(SIMULIA, Inc)
2.2 Models
Six mandibular unilateral partially edentulous models missing the canine to the second molar was created by computer-aided design (CAD) modeling based on the patients’ image, followed by an assembly process, as described in previous publications. [5,6,7]
A 4.1 *10 mm implants (Standard RN; Straumann AG, Basel, Switzerland) were inserted in the edentulous residual ridge vertical to the occlusal plane. A healing abutment was placed on the implant so that 2 mm of the abutment protruded from the soft tissue, and directly contact with the resin.
The experimental ISRPD consisted of a cobalt–chromium alloy metal frame equipped with two A-ker clasps on the other side arch as a direct retainer for the left first premolar and
6
third molar, and acrylic resin for the denture base material. The major connector was designed as a lingual plate. The bracing and supporting elements were designed so that the plate was in contact with the anterior tooth. The artificial tooth was also made from the same denture base material and fabricated parallel to the occlusal plane.
The number of implants was divided into 0 and 1, which simulated the blank control group with no implants and no dentures, the ordinary control group without implants but with traditional partial dentures, and the situation that an implant was located in different positions. Details of the Model ① to ⑥ are shown in the table. (Table 1)
2.3 Experimental methods 2.3.1 Data acquisition
In 2017, the patients in the department of prosthodontics of Dalian stomatological hospital who wanted to receive implant-supported partial denture treatment were selected as the research subjects. The patients did not receive invasive treatment within 6 months before surgery, and denied the systematic medical history and drug allergy history. The right mandibular molar area was implanted. CBCT was taken before and after surgery. (Figs 1)
Craniofacial axial tomography was performed on the test subjects with a resolution of 0.2mm, mAs=20.27, KVP=120, and the acquisition time was 14.7s. The patients were seated and the orbital plane was parallel to the horizontal plane. Because the metal part of the denture
7
affects CT imaging, the patient's intraoral plaster model is reproduced to make the denture in place. 3D scanning is conducted on the plaster model with the denture. The scanned images are processed and saved in STL format.
2.3.2 Establish a geometric model of mandible and denture.
Read the DICOM data obtained through CT scanning of the mandible through Mimics 17.0 3D, the medical reconstruction software. Generate the point cloud region of the mandible by setting thresholds within the range of bone, and determine the thickness of the cancellous bone, cortical bone, and mucous membrane through the operations such as erosion and expansion and then generate corresponding 3D point cloud models respectively.
To model the denture part, scan the model's outer contour of the denture through the handheld scanning device 3shape to obtain a file in stl format containing point cloud information.
Edit the mask, remove the unwanted parts and divide the model into mandible, mucous membrane and denture. Create three separate masks for mandible, mucous membrane and denture respectively based on the gray value, smooth each mask, generate a 3D geometric model and then export a file in stl format.
Import the exported file in stl format into the reverse engineering software Geomagic Studio 2012 to generate a 2D facet. Work on the geometric discontinuous features by using the grid doctor function and remove irregular and abrupt geometric features over surface
8
selection, filling, deleting, noise reduction, point-surface transformation, etc. to generate a smooth NURB curved surface. Optimize and package the curved surface to make the 3D model more beautiful and accurate and finally generate and export the geometry in images format. (See Figs 2, 3, 4)
2.3.3 Establish a 3D geometric model of the implant system.
Physically map the implant, central screw and abutment using a digital caliper, create a 3D geometric model of the implant system through the UG software in combination with the parameters provided by the manufacturer and export the model in IGES format. Establish a physical model of the mucosa between the denture and the mandible using the Dilate command of the Mimics software.
2.3.4 Establish a 3D finite element model.
Import the mandible model and implant system model established above into the finite element pre-processing software Hypermesh in IGES format and stitch the previously established curved surface model to establish and assemble a solid model (Figs. 5, 6). Cut the geometrical part through Boolean operation and embed the implant into the mandible to create a mandibular model containing an implant and ensure that there is no interference between different parts. Treat the geometry of the joints so that each element does not give rise to geometric problems such as warping and distortion.
9
jacobi matrix through the tetrahedron element to ensure the continuity of the element. First, make mesh generation in an automatic manner and set the maximum value of the mesh unit within 1.2mm and the size of the membrane around 0.5mm. Ensure the continuity of the mesh and manually check the automatically divided meshes. Further refine the meshes where the denture and the mucosa contact and make the shortest mesh length at 0.4mm. In the end, perform the mesh convergence test to ensure that the mesh size meets the calculation requirements.
2.3.5 Finite element pre-processing
Perform pre-processing of finite element calculation analysis in the Abaqus software, and check the element's quality and create sets. Create static analysis steps and set the contact surfaces between cancellous bone and cortical bone, cortical bone and mucous membrane, mucous membrane and denture, denture and implant, implant and mandible, etc. Adjust the parameters in the contact settings to enable iterative convergence of the analysis steps. Connect the implant to various parts of the mandible and set 100% binding to the bone.
Define the node set and face set (Table 2), and set the field and history variables that the analysis steps need to output. Assign mesh attributes to the element and calculate by the C3D4 element. As for the device load and boundary conditions, apply vertically downward pressure on the upper part of the denture, constrain both sides of the mandible and calculate the force and stress distribution of the overall model. Smooth the final meshes and assign
10
corresponding material properties, such as elasticity modulus and density. Set the contact faces of each part as a separate face set and export them together with the element model.
2.4 Hypothesis of mechanical parameters and experimental conditions of the material
Regard various materials and tissues in the model as continuous, homogeneous, and isotropic linear elastic materials. The implant-bone interface is completely bonded and thus no relative sliding will occur during loading.
The elastic modulus and Poisson's ratio of the material are obtained based on previous literature. [13,14,15] See Table 3.
2.5 Loading conditions and constraint conditions 2.5.1 Boundary conditions
Assume that the bone-mucosa interface, implant-bone interface and the interface between the implant and the upper abutment are continuous and rigid interfaces without relative displacement. The implant and the denture are in contact with each other through metal, and the mucosa-denture tissue surfaces are in contact with each other, allowing vertical displacement. Fix the left and right sides of the mandible and the bottom cortical bone in all directions to prevent lateral movement. Allow the denture, mucosa and bone to move in the Y-axis direction, thereby simulating the displacement of the denture and the deformation of
11
the mucosa and the bone.
2.5.2 Loading conditions
Select the center of the joint of the mandible 33, 34, 35, 36 and 37 as the loading points and load vertically with the loading force being 50N. Apply the same load to all the six models in an evenly distributed manner. (See Fig. 7)
2.6 Selection and finite element analysis of analytical data
Extract the Von Mises stress distribution cloud maps of the implant-bone interface cortical bone region, the implant, the lower mucous membrane of denture and the alveolar bone under different loading conditions and also the displacement and deformation maps of the mucous membrane and the denture to observe the change characteristics of the stress-strain distribution of each model. Extract the Von Mises stress peaks (Max EQV) of the implant-bone interface cortical bone region, the implant, the lower mucous membrane of denture and the alveolar bone under different loading conditions and the maximum displacement values of the mucous membrane and denture to compare and analyze the data of models ①-⑥.
2.7 Statistical method
12
compare the stress peaks of the implant-bone interface cortical bone region, the implant, the lower mucous membrane of the denture and the alveolar bone under different loading conditions and also the maximum displacement values of the mucous membrane and denture, which holds statistical significance when P<0.05.
13
Chapter 3. RESULTS 3.1 Implant
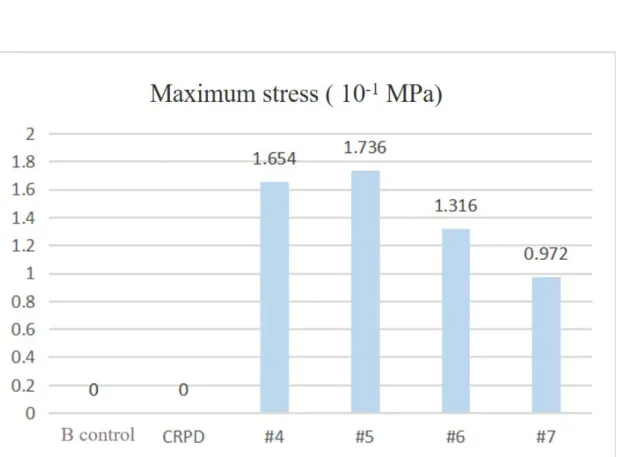
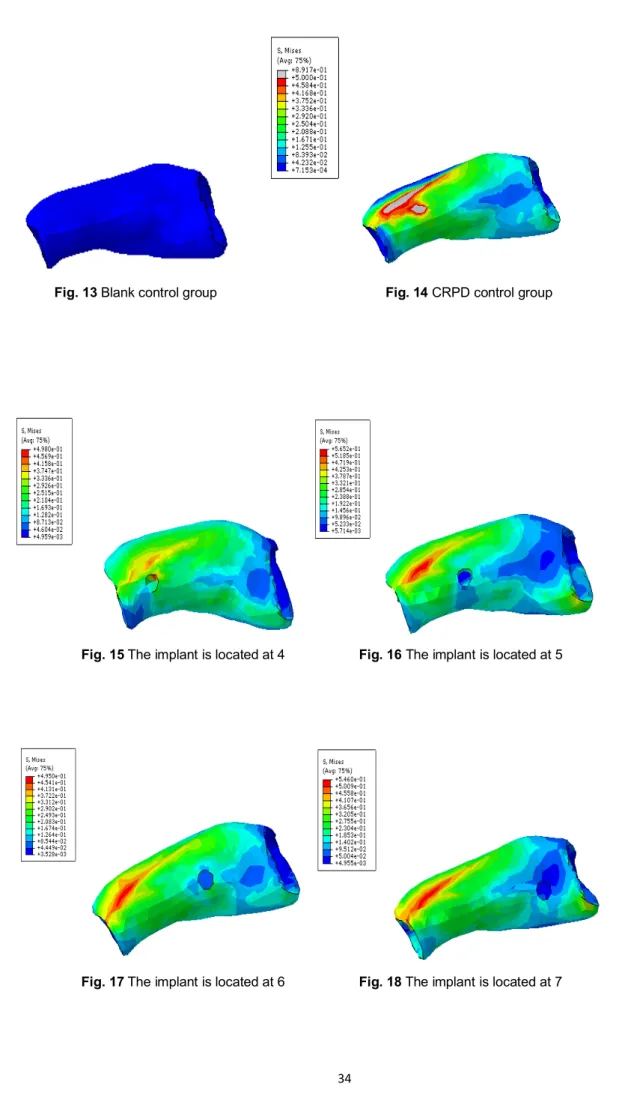
(1) From the stress cloud diagram (Table 4, Fig. 12), the maximum stress concentrate on the neck and 1/3 of the root of the implant. Wherein, the maximum stress occurred when the implant is at #5 (Table 4, Fig. 12). The trend of stress shows when the implant moved towards the distal side (Figs. 8-11), the stress on the root of the implant decreased gradually, while that on the neck increased.
(2) It can be seen from the Von Mises stress value chart (Table 4), the implant bore greater stress when it is placed on the premolars than on the molars. The maximum exists at #5 and the minimum exists at #7.
3.2 Cortical bone:
(1) From the stress cloud diagram (Table 5, Fig. 19), Compared with the blank control group (Fig. 13, 14), the CRPD group mainly focused on the alveolar buccal side of the premolar area. The maximum stress is 8.917 * 10-1 MPa.
(2) After placing an implant, the maximum stress was smaller than the corresponding area of the CRPD group, regardless of the premolar area or the molar area (Table 5).
(3) It can be seen from the Von Mises stress value chart (Table 5), When the implant is at #5, the stress value is the largest, while at #6, the stress value is the smallest.
14 3.3 Cancellous bone
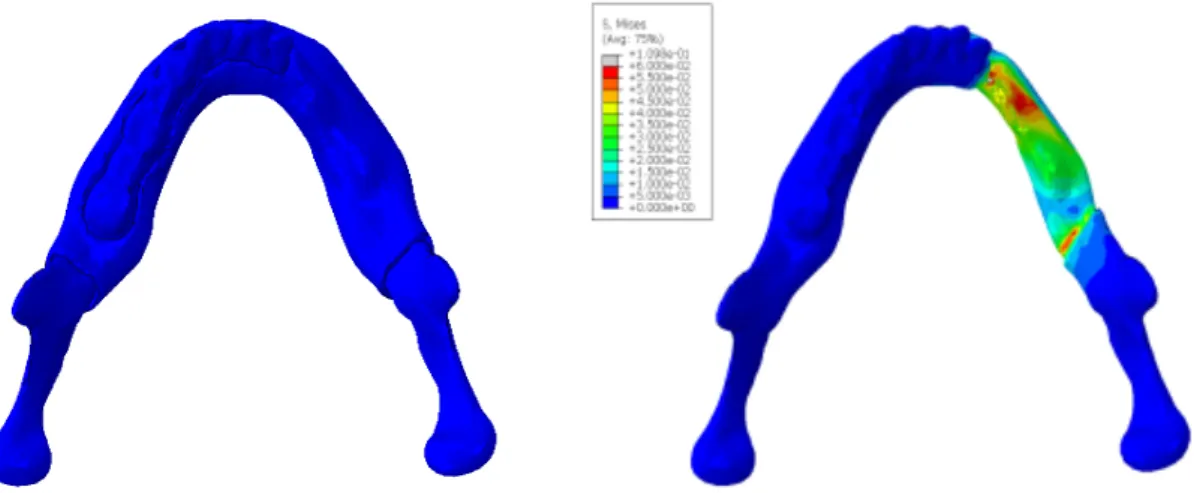
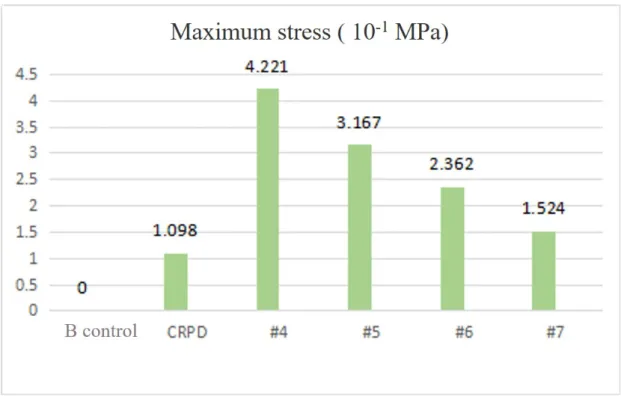
(1) From the stress cloud diagram, it can be seen that the CRPD group is compared with the blank control group (Fig. 20,21).,the cancellous bone in the edentulous area is strongly stressed, and the stress is mainly concentrated on the buccal side of the alveolar ridge in the premolar area. The maximum stress is 1.098*10-1 MPa. The high stress area appears in the premolar area, and the low stress area is in the molar area. The former stress value is about 2 times larger than the latter.
(2) From the stress cloud diagram (Fig. 22-25), the stress in the premolar area or the molar area was less than that in the CRPD group after implant support. As the implant moves to the distal end, the stress in the premolar region gradually increases, and the stress in the molar region gradually decreases.
(3) However, from the Von Mises stress value (Table 6), the maximum stress of cancellous bone after implant support is greater than that without implant, and as the implant moves to the distal end, and the maximum value gradually decreases.
3.4 Mucosa
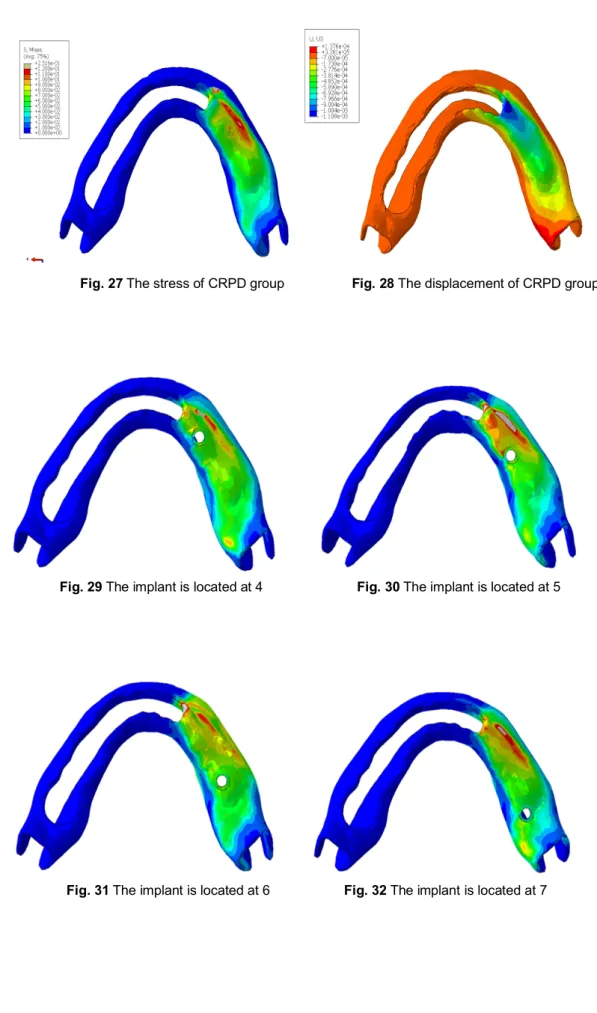
(1) From the mucosa deformation and stress distribution map (Fig. 27-36), the stress is
concentrated on the buccal side of the premolar region. In the edentulous area, the mucosa mainly shows compressive stress, while in the contralateral arch, the mucosa shows tensile
15
stress.
(2) The maximum displacement also occurs in the premolar area.
(3) From the Von Mises stress table (Table 7), the maximal stress of the implant-supported mucosa was less than that without implant support.
(4) The maximum value appears when the implant is at #5, at which time the mucosa deformation is greatest. When the implant is at #7, the maximum stress on the mucosa is minimal.
(5) The maximum value of mucosa displacement deformation (Table 7), except that the #4 group was slightly smaller than the CRPD group, the other groups were larger than the control group.
3.5 Displacement of the denture framework
(1) From the denture displacement diagram (Fig. 38), the denture base is expressed as compressive stress, and the retainer is shows tensile stress; the maximum deformation occurs on the mistal clasp of the Metal bracket.
(2) For the displacement of the denture base, the maximum displacement appeared on the buccal side of the premolar area, except #4 was slightly smaller than the CRPD group, other groups were slightly larger than those of control group (Fig. 38-42).The Von Mises stress value shows that the denture base displacement tends to increase as the implant moves distally.
16
(3) For the displacement of the contralateral retainer: the stress cloud map (Fig. 39-42) shows that the displacement of the retainer after implant support is more uniform than that of the control group. The Von Mises stress value shows (Table 8) that as the implant moves toward the distally, the displacement of the retainer tends to decrease.
17
Chapter 4. DISCUSSION
4.1 Impact of implant assistance on the sustentacular tissue and denture
Conventional removable partial dentures (CRPD) in functional state suggested that there
were large difference of alveolar ridge stress and mucosa displacement in the premolar area and the molar area of the CRPD group, stress concentrate on the mesial clasp in the denture retainer indicated that the distal denture base sunk unevenly and compressed the tissue as well as large load on the abutment teeth. This coincides with the opinions of many scholars. For example, some scholars [16,17,18] believed that the CRPD made the edges of the alveolar
ridge and the abutment teeth overloaded, which may lead to potential destruction to these tissues. These results suggest that clinical attention should be paid to increasing the strength of the denture, reducing the load in the premolar area, and improving the stress on the abutment teeth. Xu Jun [19] proposed placing the retention arm on the lingual side when
repairing longitudinal dentition defects, serving the purpose of protecting the abutment teeth. On the other hand, it virtually increases the burden of mucous and alveolar ridges. Hence, support is needed in the contralateral arch. The choice of retaining the residual roots of the sputum or using the implant can play the support role. The implant is connected to the abutment and the denture for better rigidity support. At the same time, the implants that simulate the residual roots have a shorter interpupillary distance, and also avoid the hidden danger of excessive lateral force due to poor crown/plant ratio, and also have certain
18
protection for the implant. When foreign scholars [20] studied the retention structure above the
implant, they found that the experimental group with a single fixed implant and a single crown supporting the CRPD produced significant displacement, and the implant bore excessive load. Despite the limitations of that study, it still verified the possibility of failed osseointegration.
With the support of an implant, the stress on the alveolar ridge and the mucosa in the edentulous area are all less than that of the corresponding area of the CRPD group. While the stress concentrate area is still on the buccal side of the premolar zone. This is consistent with the findings of other scholars. When Ohkubo et al. [21] studied the Kennedy class I distal
implants to support RPDs, it is found that the implantation of distal implants can significantly reduce the pressure of the mucosa and the alveolar bone, and prevent the denture sinking and also avoid other instable phenomena. That same conclusion is also supported by a large number of clinical studies [22,23]. The above observations suggest that implants with gaps
produce good supporting effect, reducing the pressure on the soft and hard tissues under the denture base, thus benefiting the health of these tissues. The displacement of the denture shows that with implant support significantly reduces tensile stress on the denture clasp, making the force more uniform, indicating that the support of the implant changes the stress state of the abutment teeth, reducing its effect on the anterior abutment teeth, and increasing the force on the posterior abutment teeth. Radhwan [24] showed that the use of implants
19
reduces the lever arm of the distal denture base, and also reduces its effect on the abutment teeth. The shift from the longitudinal support to flat support disperses the stress on each part and retains physiological stimulation while relieving stress, and is thus favorable for the healthy long-term development of tissues and the abutment teeth.
Chikahiro [20] believed that because of the implant-bone bond, there is no periodontal
ligament with a feedback mechanism and that the load can neither be absorbed nor buffered. Thus, the ISRPD had a theoretically larger occlusal force than the CRPD. However, the results show that each organization has a tend to reduce stress and distribute evenly, indicating that the implant bears most of the force and also changes the structure of the force transmission.
4.2 When an implant is at different positions
In this experiment, the load is applied on the surfaces of all artificial teeth in a vertical,
static and even manner. Under the same load, given the stressed area of the premolar area is smaller than that of the molar area, the CRPD group had significantly higher stress on the alveolar bone in the premolar area and deformation on the mucosa than in the molar area. When implants are placed in the highly stressed area of the CRPD, the stress is greatly diluted and the uneven distribution ameliorated. This situation had the shortest arm of force of the sinking effect and the optimal supporting effect. As the implant moved towards the distal
20
side, the arm of force lengthened gradually and gave gradually decreased support to the premolar area and as a result, the Von Mises stress value of premolar area gradually increased. At the same time, the supporting role of the implant on the molar area gradually increased as it moved to the distal side. Although the degree is reduced, it still plays a supporting role. The conclusions of the study by Rocha et al., Pellizzer et al [25,26] suggested that the bonding
of the implant and DERPD relieved the stress on the alveolar ridge, which consistent with the result of this experiment.
The implant endured more stress in the premolar area than in the molar area, indicating that in the premolar area where the stress concentrated on, the implant bore most stress, thus reducing the burden of tissues. Yoshiki's [27] study on implant-assisted partial denture stress
indicated that about half of the load is applied to the implant regardless of its position. In this regard, some scholars had come to different conclusions. Cunha et al [28]observed the
maximum stress of ISRPD implants found that the implants had a positive effect on the stress distribution when they were closer to the abutment teeth. In the molar area where the stress concentration is relatively small, the implant is not stressed, but the cortical bone shares more stress. It shows that in the molar area, the implant is protected.
In terms of the displacement of the denture, the denture base had a negative displacement value, suggesting that the denture base and tissues below it endured compressing stress, while the framework had a positive displacement value, indicating that the retainer on the abutment
21
teeth is under tensile stress. With the implant supported, the retainer is significantly reduced, suggesting that the effect on the abutment is alleviated. As the position of the implant moves toward distally, the difference in the mistal retainer and distal retainer is gradually reduced, and the distribution tends to be uniform. It indicates that implant in the molar region has a significant effect on improving the force of the abutment.
22
Chapter 5. CONCLUSION
Within the scope of this experimental study, quantitative data of load distribution of denture, implant, alveolar ridge and mucosa were obtained when different implant distribution locations. The following conclusions are drawn from the results of this study: 1. The maximum stress of cortical bone, cancellous bone and mucous under the functional load of traditional longitudinal partial denture is concentrated on the buccal side of the premolar area.
2. The support of the implant reduces the burden on the abutment while making the occlusal force distribution more uniform.
3. The maximum stress of the implant is concentrated in the neck and 1/3 of the root.
4. In the premolar area, the implant effectively disperses the force and reduces the stress value of the cortical bone; In the molar area, the cortical bone takes more occlusal force and the implant is protected.
23 References
[1] Kelly E. Changes caused by a mandibular removable partialdenture opposing a maxillary complete denture. J ProsthetDent. 1972;27:140–150.
[2] Giffin KM. Solving the distal extension removable partial denture base movement dilemma: A clinical report. J Prosthet Dent. 1996;76:347-349.
[3] Keltjens HM, Kayser AF, Hertel R,et al. Distal extension removable partial dentures supported by implants and residual teeth: Considerations and case reports. Int J Oral Maxillofac Implants. 1993;8:208-213
[4] Lum LB. A biomechanical rationale for the use of short implants. J Oral Implantol. 1991;17:126-131.
[5] Rocha EP, Luersen MA, Pellizzer EP, et al. Distal–extension removable partial denture associated with an osseointegrated implant. Study by the finite element method. J Dent Res. 2003;82:B-254.
[6] Maki Sato,*,Yasunori Suzuki, Daisuke Kurihara, Hidemasa Shimpo, Chikahiro Ohkubo; Effect of implant support on mandibular distal extension removable partial dentures:Relationship between denture supporting area and stress distribution;Journal of Prosthodontic Research 57(2013)109–112.
[7] Witter DJ, de Haan AF, Kayser AF, van Rossum GMJM. A 6-year followup to study of oral function in shortened dental arches. Part I. Occlusal stability. J Oral Rehabil
24
1994;21:113–25.
[8] Witter DJ, de Haan AF, Kayser AF, van Rossum GMJM. A 6-year follow-up to study of oral function in shortened dental arches. Part II. Craniomandibular dysfunction and oral comfort. J Oral Rehabil 1994;21:353–66.
[9] Pellecchia M, Pellecchia R, Emtiaz S. Distal extension mandibular removable partial denture connected to an anterior fixed implant-supported prosthesis: a clinical report. J Prosthet Dent 2000;83:607–12.
[10] Maeda Y, Sogo M, Tsutsumi S. Efficacy of a posterior implant support for extra shortened dental arches: a biomechanical model analysis. J Oral Rehabi l2005;32:656– 60.
[11] Kordatzis K, Wright PS, Meijer HJ. Posterior Mandibular Residual Ridge Resorption in Patients with Conventional Dentures and Implant Overdentures. Int J Oral Maxillofac Implants. 2003 May-Jun;18(3):447-52
[12] Chikahiro Ohkubo, Mariko Kobayashi, Yasunori Suzuki, Toshio Hoso;Effect of Implant Support on Distal-Extension Removable Partial Dentures: In Vivo Assessment;The International Journal of Oral&Maxillofacial Implants Volume 23,Number 6,2008 1095-1101
[13] Haldun iplikcioglu, Kivanc AKca; Comparative evaluation of the effect of diameter, length and number of implants support three-unit fixed partial prostheses on stress
25
distribution in the bone. journal of Dentistry,30(2002)41-46;
[14] Verri FR, Pellizzer EP, Rocha EP. Influence of length and diameter of implants associated with distal extension removable partial dentures. Implant Dent 2007;16:270Y276
[15] Cunha LD, Pellizzer EP, Verri FR, et al. Evaluation of the influence of location of osseointegrated implants associated with mandibular removable partial dentures. Implant Dent 2008;17:278Y287
[16] Rocha EP, Luersen MA, Pellizzer EP, et al. Distal-extension removable partial denture associated with an osseointegrated implant. Study by the finite element method. J Dent Res. 2003;82 (Spec Iss B):1948.
[17] Verri FR, Pellizzer EP, Rocha EP, et al. Influence of length and diameter of implants associated with distal extension removable partial dentures. Implant Dent.
2007;16:270-280
[18] Chou TM, Caputo AA, Moore DJ. et al. Photoelastic analysis and comparison of force-transmission characteristics of intracoronal attachments with clasp distal-extension removable partial dentures. J Prosthet Dent. 1989;62:313-319.
[19] Xujun.Design of full denture and removable partial denture,2005,China Encyclopedia Publishing House,ISBN:7500072619
26
PhD/Toshio Hosoi, DDS, PhD,Effect of Implant Support on Distal-Extension Removable Partial Dentures: In Vivo Assessment ,The International Journal of Oral & Maxillofacial Implants ,Volume 23, Number 6, 2008 ,1095-1101
[21] Ohkubo C, Kurihara D, Shimpo H, et al. Effect of implant support on distal extension removable partial denture: in vitro assessment[J]. J Oral Rehabil,2007, 34(1): 52-56. [22] Pellizzer EP, Lucas LVM, Rocha EP, et al. Influence of bite force in RPD associated
with osseointegrated implant. J Dent Res. 2004;83(Spec Iss A):1707.
[23] Verri FR, Pellizzer EP, Rocha EP, et al. Influence of length and diameter of implants associated with distal extension removable partial dentures. Implant Dent. 2007;16:270-280.
[24] Hasan RH. Biomechanical Assessment of Implant Supported Removable Partial Denture: 3-D Finite Element Analysis Study. 2012;
[25] Lucas L, Pellizzer E, Rocha E and Pereira J. Avaliação da influência da força de mordida na prótese parcial removível classe I mandibular associada a implante, pelo método dos elementos finitos. Revista do Curso de Odontologia da UniEvangélica 2008; 10: 05-12. [26] Rocha EP, Luersen MA, Pellizzer EP and Del Belcury AA. Distal-extension removable
partial denture associated with an osseointegrated implant. Study by the finite element method. Journal of Dental Research 2003; 82: B254-B254
27
Load distribution on abutment tooth, implant andresidual ridge with distal-extension implant supported removable partial denture; Journal of prosthodontic research 60(2016)282-288.
[28] Ohkubo C, Kurihara D, Shimpo H, Suzuki Y, Kokubo Y, Hosoi T. Effect of implant support on distal extension removable partial dentures: in vitro assessment J Oral Rehabil. 2007 Jan;34(1):52-6.
28
Tables and Figures
Table 1. Group of Experiments
number position ① 0 blank control ② 0 CRPD ③ 1 #4 ④ 1 #5 ⑤ 1 #6 ⑥ 1 #7
Table 2. The number of nodes and units in the experimental model
Table 3. Material mechanics parameter
Part Elastic Modulus Poisson's ratio
Implant 107000 0.33 Cortical bone 13700 0.30 Cancellous bone 1370 0.30 Periodontal ligament 69 0.45 Mucosa 3 0.45 Natural tooth 20290 0.3 Denture base 2352 0.33 1 2 3 4 5 6 Nodes 17067 18492 18937 18983 18987 18988
29 Table 4. Maximum stress of an implant
Table 5.The maximum stress value of cortical bone of an implant
Table 6. Maximum stress for cancellous bone at the time of one implant
Model Blank control CRPD #4 #5 #6 #7
Stress maximum (MPa) 0 0 1.654 1.736 1.316 0.972 Model Blank control CRPD #4 #5 #6 #7 Stress maximum (MPa) Premolar area stress (MPa) 0 0 0 8.917 * 10-1 4.980 * 10-1 5.652 * 10-1 4.950 * 10 -1 5.460 * 10-1 2.13 * 10-1 1.74 * 10-1 2.11 * 10-1 2.04 * 10 -1 2. 07 * 10-1 Molar area stress (MPa) 0.813 * 10-1 0.44 * 10-1 0.459 * 10-1 0.692 * 10 -1 0.343 * 10 -1 Model Blank control CRPD #4 #5 #6 #7 Stress maximum (MPa) 0 1.098 * 10-1 4.221 * 10-1 3.167 * 10-1 2.362 * 10 -1 1.524 * 10-1 Premolar area stress (MPa) 0 0.8 * 10-1 0.2 * 10-1 0.45 * 10-1 0.63 * 10 -1 0.78 * 10-1 Molar area stress (MPa) 0 0.37 * 10-1 0.35 * 10-1 0.22 * 10-1 0.16 * 10 -1 0.16 * 10
30
Table 7. The maximum stress value of the mucosa of an implant
Table 8 The maximum deformable value of a denture of an implant
Model Blank control CRPD #4 #5 #6 #7 Negative displacement (mm) 0 1.351 * 10-3 1.249 * 10-3 1.733 * 10-3 1.734 * 10-3 1.713 * 10-3 Positive displacement (mm) 0 3.150 * 10-4 2.432 * 10-4 1.287 * 10-4 1.758 * 10-4 4.553 * 10-5 Model Blank control CRPD #4 #5 #6 #7 Stress maximum (MPa) Maximum displacement (mm) 0 0 2.516 * 10 -1 2.045 * 10 -1 2.415 * 10 -1 1.620 * 10 -1 1.583 * 10 -1 1.108 * 10 -3 9.436 * 10 -4 1.448 * 10 -3 1.433 * 10 -3 1.419 * 10 -3 Premolar area stress(MPa) 0 11.08 * 10 -4 6.985 * 10 -4 1.55 * 10 -4 10.59 * 10 -4 10.5 * 10 -4 Molar area stress(MPa) 0 3.81 * 10 -4 2.083 * 10 -4 1.40 * 10-4 3.107 * 10 -4 3,121 * 10 -4
31
Fig. 1 CBCT scan of mandible before implantation with unilateral free dentition defect
Fig. 2 Mandibular-mucosa 3d finite element model
Fig. 3 Mandible-mucosa-implant 3d finite
32
Fig.6 Assemble an implant to the diagram Fig. 7 Diagram of loading conditions
Fig. 8 The implant is located at 4 Fig. 9 The implant is located at 5
Fig. 4 3d finite element model of denture Fig. 5 Mandibular - mucosa - denture 3d
finite element model 3d finite element mode
33
Fig. 10 The implant is located at 6 Fig. 11 The implant is located at 7
34
Fig. 13 Blank control group Fig. 14 CRPD control group
Fig. 15 The implant is located at 4 Fig. 16 The implant is located at 5
35
Fig. 19 The maximum stress value of cortical bone of an implant
Fig. 20 Blank control group Fig. 21 CRPD control group
36
Fig. 22 The implant is located at 4 Fig. 23 The implant is located at 5
Fig. 24 The implant is located at 6 Fig. 25 The implant is located at 7
37
Fig. 27 The stress of CRPD group Fig. 28 The displacement of CRPD group
Fig. 29 The implant is located at 4 Fig. 30 The implant is located at 5
38
Fig. 33 The implant is located at 4 Fig. 34 The implant is located at 5
Fig. 35 The implant is located at 6 Fig. 36 The implant is located at 7
39
Fig. 38 CRPD control group Fig. 39 The implant is located at 4
Fig. 40 The implant is located at 5 Fig. 41 The implant is located at 6
Fig. 42 The implant is located at 7
40
Fig. 43 The maximum deformable value of a denture at the time of an implant Negative displacement(10-3mm) Positive displacement(10-4mm)