interactions in Alzheimer's disease and aged
brains: increased levels correlate with
neuropathology.
著者
Mendsaikhan Anarmaa, TOOYAMA Ikuo, BELLIER
Jean-Pierre, SERRANO Geidy E, SUE Lucia I, LUE
Lih-Fen, BEARCH Thomas G, WALKER Douglas
Gordon
journal or
publication title
Acta Neuropathologica Communications
volume
7
number
1
page range
215
year
2019-12-21
URL
http://hdl.handle.net/10422/00012607
doi: 10.1186/s40478-019-0862-8(https://doi.org/10.1186/s40478-019-0862-8) (C) The Author(s). 2019 This article is distributed under the terms of the Creative Commons Attribution 4.0 International License (http://creativecommons.org/licenses/by/4.0/), which permits unrestricted use, distribution, and reproduction in any medium, provided you give appropriate credit to the original author(s) and the source, provide a link to the Creative Commons license, and indicate if changes were made. The Creative Commons Public Domain Dedication waiver (http://creativecommons.org/publicdomain/zero/1.0/) applies to the data made available in this article, unless otherwise stated.R E S E A R C H
Open Access
Characterization of lysosomal proteins
Progranulin and Prosaposin and their
interactions in Alzheimer
’s disease and
aged brains: increased levels correlate with
neuropathology
Anarmaa Mendsaikhan
1, Ikuo Tooyama
1, Jean-Pierre Bellier
1, Geidy E. Serrano
2, Lucia I. Sue
2, Lih-Fen Lue
2,3,
Thomas G. Beach
2and Douglas G. Walker
1,3*Abstract
Progranulin (PGRN) is a protein encoded by the GRN gene with multiple identified functions including as a neurotrophic factor, tumorigenic growth factor, anti-inflammatory cytokine and regulator of lysosomal function. A single mutation in the human GRN gene resulting in reduced PGRN expression causes types of frontotemporal lobar degeneration resulting in frontotemporal dementia. Prosaposin (PSAP) is also a multifunctional neuroprotective secreted protein and regulator of lysosomal function. Interactions of PGRN and PSAP affect their functional properties. Their roles in Alzheimer’s disease (AD), the leading cause of dementia, have not been defined. In this report, we examined in detail the cellular expression of PGRN in middle temporal gyrus samples of a series of human brain cases (n = 45) staged for increasing plaque pathology. Immunohistochemistry showed PGRN expression in cortical neurons, microglia, cerebral vessels and amyloid beta (Aβ) plaques, while PSAP expression was mainly detected in neurons and Aβ plaques, and to a limited extent in astrocytes. We showed that there were increased levels of PGRN protein in AD cases and corresponding increased levels of PSAP. Levels of PGRN and PSAP protein positively correlated with amyloid beta (Aβ), with PGRN levels correlating with phosphorylated tau (serine 205) levels in these samples. Although PGRN colocalized with lysosomal-associated membrane protein-1 in neurons, most PGRN associated with Aβ plaques did not. Aβ plaques with PGRN and PSAP deposits were identified in the low plaque non-demented cases suggesting this was an early event in plaque formation. We did not observe PGRN-positive neurofibrillary tangles. Co-immunoprecipitation studies of PGRN from brain samples identified only PSAP associated with PGRN, not sortilin or other known PGRN-binding proteins, under conditions used. Most PGRN associated with Aβ plaques were immunoreactive for PSAP showing a high degree of colocalization of these proteins that did not change between disease groups. As PGRN supplementation has been considered as a therapeutic approach for AD, the possible involvement of PGRN and PSAP interactions in AD pathology needs to be further considered.
Keywords: Amyloid, Aggregation, Growth factors, Alzheimer’s disease, Progranulin, Prosaposin, Neuropathology, Tangles, Interactions
© The Author(s). 2019 Open Access This article is distributed under the terms of the Creative Commons Attribution 4.0 International License (http://creativecommons.org/licenses/by/4.0/), which permits unrestricted use, distribution, and reproduction in any medium, provided you give appropriate credit to the original author(s) and the source, provide a link to the Creative Commons license, and indicate if changes were made. The Creative Commons Public Domain Dedication waiver (http://creativecommons.org/publicdomain/zero/1.0/) applies to the data made available in this article, unless otherwise stated.
* Correspondence:[email protected];[email protected]
1
Molecular Neuroscience Research Center, Shiga University of Medical Science, Seta, Otsu, Otsu 520-2192, Japan
3School of Life Sciences and Neurodegenerative Disease Research Center,
Biodesign Institute, Arizona State University, Tempe, AZ, USA Full list of author information is available at the end of the article
Introduction
Alzheimer’s disease (AD) is the most frequent cause of de-mentia in elderly populations and currently affecting an estimated 47 million people worldwide [1], but as the ages of populations in most countries are increasing, the inci-dence of AD will significantly increase. The brains of AD-affected subjects show accumulations of amyloid beta (Aβ) plaques and neurofibrillary tangles (NFT), the hall-mark pathological features of this disease [2]. Preventing the formation of these pathological structures is consid-ered the key to preventing cognitive decline, the main clinical feature of AD, but the mechanisms and sequence of events leading to the accumulation of plaques and tan-gles, neuronal death and cognitive decline are not fully understood. To date, in spite of promising experimental data in AD animal models, therapies to prevent or remove Aβ have generally had limited effects in clinical trials to slow down cognitive decline [3–5]; other approaches are also needed.
Progranulin (PGRN) is a glycosylated protein of 75–80 kDa that can be secreted or transported to lysosomes [6]. It is expressed in many different tissues and cell-types [7]. PGRN protein is composed of seven and a half repeats of a highly conserved cysteine-containing motif that can be cleaved into granulin peptides (A-G), some with proinflam-matory properties [8]. In brain, PGRN has been demon-strated to regulate neuroinflammation [9, 10], neurite branching and outgrowth [11, 12], and lysosomal function [13,14]. The role of PGRN in AD has attracted attention in recent years since the discovery that mutations in GRN, the gene for progranulin, is one cause of frontotemporal de-mentia (FTD) resulting from frontotemporal lobar degener-ation (FTLD) [15,16]. In FTD, loss of function mutations in the GRN gene resulting in significantly reduced levels of PGRN protein lead to neurodegeneration [15]. It has been hypothesized that reduced PGRN results in neurodegenera-tion due to enhanced neuroinflammaneurodegenera-tion [10, 17]. The mechanism of reduced PGRN causing enhanced neurode-generation in FTD and AD has been investigated using gene deletion rodent models but with conflicting results de-pending on the model [18–22]. Complete loss of PGRN re-sults in enhanced neuroinflammation and disturbance of lysosomal function, but the clinical phenotypes of mice with heterozygous GRN deletion were variable [13,23,24]. Increasing PGRN levels in animal models of FTD, AD and Parkinson’s disease (PD) have been reported to reduce both pathological and clinical features [19,23,25–27]. However, there are increased levels of PGRN protein in human AD-affected brains and AD mouse models [19]. It has been sug-gested that the onset of AD might be caused by a drop in PGRN levels prior to the end-stage increase, but this has only been demonstrated in AD mouse models not human subjects [19]. The single nucleotide polymorphism (SNP) rs5848 (T) allele has been associated with an increased risk
of AD due to its effect on PGRN protein levels, but these effects were not large [28,29]. Biomarker studies of PGRN levels in human cerebrospinal fluid (CSF) and plasma in AD subjects have shown changes with disease progression but limited diagnostic utility [28, 30]. While most experi-mental studies on PGRN in brain have employed animal models of FTD with single mutation or GRN gene knock-out, the number of studies relating to PGRN and AD are limited, but one feature observed in studies of AD trans-genic mice and human brain samples was that PGRN accu-mulated around Aβ plaques [19, 31–34]. An additional study that employed granulin domain-specific antibodies showed immunoreactivity of neurons, microglia and struc-tures associated with plaques [35].
Prosaposin (PSAP) is also a lysosomal regulatory protein with significant neuroprotective properties [36–38]. Re-cent studies have shown biochemical interactions between PGRN and PSAP, with these interactions affecting the trafficking of these proteins to lysosomes [39–41]. There were reduced levels of PSAP in neurons of GRN-deficient mice and in samples from FTD patients with GRN muta-tions [42]. Transgenic mice with reduced PSAP expression demonstrated similar pathological and behavioral changes as GRN gene-deficient mice [42]. PSAP deficiencies in mice led to significant impairment of PGRN trafficking to lysosomes but increased circulating levels of PGRN [41]. Experimental models of neuronal injury resulted in in-creased levels of PSAP in neurons and microglia [38,42,
43]. The interactions of PGRN and PSAP are complex as both PSAP reduction and overexpression resulted in ele-vated levels of extracellular/secreted PGRN in different cellular models [4]. Overexpression of PSAP increased the concentration of PGRN oligomers, while PSAP knock-down increased concentrations of PGRN monomers [39]. These interactions affecting the levels, localization and ag-gregation of PGRN might have significant effects on its different biological activities. A recent proteomics study of CSF identified PSAP as a biomarker to discriminate be-tween preclinical AD and control cases [44].
As a result of the previous reports of increased PGRN expression in AD brains in contrast to the deficits occur-ring in FTD due to GRN mutations, detailed investigations using immunohistochemistry and biochemical techniques were carried out to address the question how increased expression of PGRN, a documented protective molecule, could be associated with pathology in AD. We employed a series of human brain samples from non-demented cases with low plaque and high plaque pathology, along with samples from demented AD cases with high plaque and tangle pathology to study the progression of changes of PGRN and PSAP expression and their interactions. We identified that PGRN and PSAP expression were increased in AD cases, and their interaction could be demonstrated in human brain samples. The interaction with PGRN and
PSAP occurred early in plaque development being detect-able in plaques present in the low plaque control cases, and PGRN associated with Aβ plaques in all cases were positive to differing extents for PSAP. Overall, these re-sults suggest that the protective and inflammatory modu-lating properties of PGRN might not be functional in AD, and PSAP bound-aggregated PGRN associated with pla-ques might lack the biological activities associated with this protein. This can be the basis for further experimental studies, but could be an important issue when considering PGRN supplementation if the protein becomes seques-tered into non-active or pathological forms associated with plaques.
Materials and methods
Human brain samples
All human brain tissue samples used in this study were ob-tained from the Banner Sun Health Research Institute Brain and Body Donation Program (Sun City, Arizona, U.S.A.) as part of the Arizona Study of Aging and Neurodegenerative Diseases (AZSAND) [45]. The operations of the Brain and Body Donation Program have received continuous approval of different Institutional Review Boards (IRB). Current op-erations have been reviewed by Western IRB (Puyallup, WA, U.S.A.). Tissue studies carried out in the U.S.A. were considered non-human subject research under exemption 4 (C.F.R 46.101). Tissue studies carried out in Japan were approved by Shiga University of Medical Science Ethical Committee (Certificate no. 29–114). A summary of demo-graphic details of cases used in this study is presented in Table1. The details of cases used for immunohistochemis-try are described in Table 1a, while those cases used for protein analysis are described in Table1b. The cases used for protein analysis were all included in the larger group used for immunohistochemistry.
Human brain autopsy and neuropathological diagnosis
At autopsy, brains were sectioned into 1 cm thick coronal slices. Tissue taken from the right hemisphere of each brain donor was frozen on dry ice, while coronal slices from the
left hemisphere were fixed for 2 days in 4% paraformalde-hyde or 10% formalin, followed by cryoprotection in phos-phate buffered glycol/glycerol solution. Frozen brain slices were stored at− 70 to − 80 °C and retrieved for dissection when samples were required for biochemical studies.
All donated brains received full neuropathological diag-nosis including reference to pre-mortem clinical history of each case. Consensus clinical and neuropathological cri-teria were used to diagnose AD, Dementia with Lewy bod-ies (DLB) or Parkinson’s disease (PD) in donated cases [46,47]. To assess severity of AD pathology in each case, tissue sections from 5 brain regions (entorhinal cortex, hippocampus, frontal cortex, temporal cortex and parietal cortex) were stained with thioflavin-S, Gallyas and Campbell-Switzer histological stains, and assessed semi-quantitatively for the density of neurofibrillary tangles and amyloid plaques. These methods of assessing pathological load are carried out by the neuropathology department of the Banner Sun Health Research Institute Brain and Body donation program on each donated brain as part of diag-nostic procedures. In brief, for each case, each brain re-gion was ranked on a scale of 0–3 based on 0 being no plaques or tangles, 1 being few plaques or tangles, 2 being moderate numbers of plaques and tangles and 3 being nu-merous plaques and tangles. By combining the measures across these 5 brain regions, assessment of total AD path-ology can be ranked on an ordinal scale of 0–15 for pla-ques and tangles [48]. The cases were classified into low-plaque non-demented (LP) (low-plaque score < 6), high-low-plaque non-demented (HP) (plaque score 6–14) and AD with de-mentia (plaque score > 12). The severity of Lewy body pathology as a score of 0–40 was assessed in 10 different brain regions using immunohistochemistry for phosphory-lated alpha-synuclein according to the Unified Staging Scheme for Lewy body disorders [49].
Apolipoprotein E genotyping
Apolipoprotein E genotypes were determined for most cases using a polymerase chain reaction (PCR)/restriction endonuclease fragment polymorphism method employing
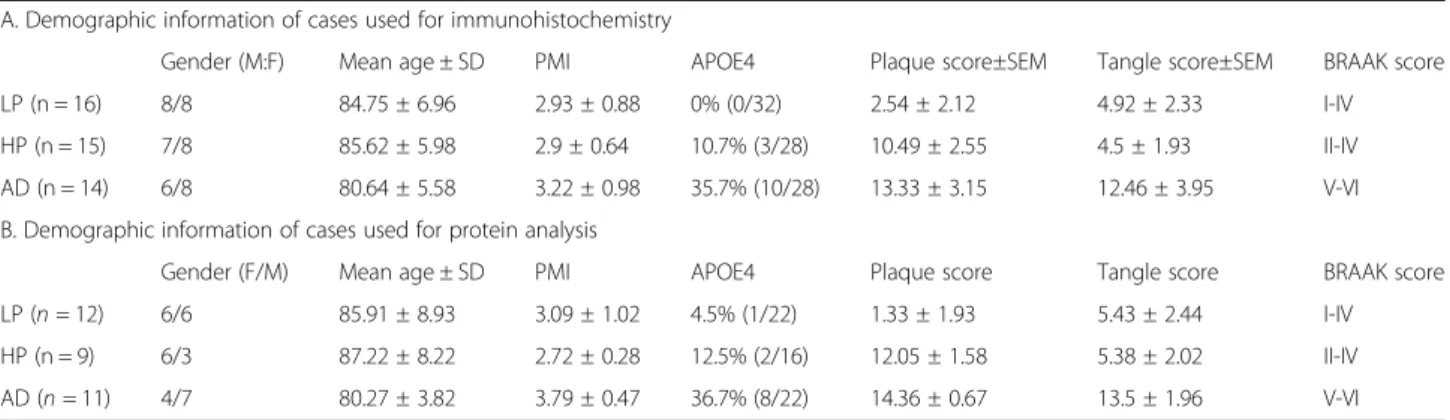
Table 1 Demographic details of cases used in study
A. Demographic information of cases used for immunohistochemistry
Gender (M:F) Mean age ± SD PMI APOE4 Plaque score±SEM Tangle score±SEM BRAAK score LP (n = 16) 8/8 84.75 ± 6.96 2.93 ± 0.88 0% (0/32) 2.54 ± 2.12 4.92 ± 2.33 I-IV HP (n = 15) 7/8 85.62 ± 5.98 2.9 ± 0.64 10.7% (3/28) 10.49 ± 2.55 4.5 ± 1.93 II-IV AD (n = 14) 6/8 80.64 ± 5.58 3.22 ± 0.98 35.7% (10/28) 13.33 ± 3.15 12.46 ± 3.95 V-VI B. Demographic information of cases used for protein analysis
Gender (F/M) Mean age ± SD PMI APOE4 Plaque score Tangle score BRAAK score LP (n = 12) 6/6 85.91 ± 8.93 3.09 ± 1.02 4.5% (1/22) 1.33 ± 1.93 5.43 ± 2.44 I-IV HP (n = 9) 6/3 87.22 ± 8.22 2.72 ± 0.28 12.5% (2/16) 12.05 ± 1.58 5.38 ± 2.02 II-IV AD (n = 11) 4/7 80.27 ± 3.82 3.79 ± 0.47 36.7% (8/22) 14.36 ± 0.67 13.5 ± 1.96 V-VI
DNA extracted from cerebellum to discriminate between APOE2, APOE3 and APOE4 alleles [50]. Results in Table
1 are presented as number of APOE4 alleles out of total numbers of APOE alleles identified in each group.
Immunohistochemistry
Paraformaldehyde or formalin-fixed tissue sections from temporal cortex (middle temporal gyrus) were used for localization of progranulin (PGRN)-positive cells identified with antibody AF2420 (R&D Systems, Minneapolis, MN, U.S.A.), and for colocalization with Aβ peptide and phos-phorylated tau, and markers of microglia (IBA-1, CD45), astrocytes (GFAP), endothelial cells (CD31), lysosomal pro-teins (LAMP-1, CD68, prosaposin, cathepsin D) and others (sortilin, beta-secretase-1 (BACE1), TMEM106B, neurofila-ments, synaptophysin) according to our previously pub-lished procedures [51,52]. Antibodies used in this study are listed in Table2. For this procedure, 25μm brain sections were processed using a free-floating method. Sections were rinsed three times in phosphate-buffered saline containing 0.3% Triton-X100 (PBSTx) (0.1 M Phosphate buffer, pH 7.4, 0.137 M NaCl, 0.3% Triton-X100 (Nacalai-Tesque, Kyoto, Japan)), and reacted in PBSTx containing 1% hydro-gen peroxide (30 min) to remove endohydro-genous peroxidase activity, rinsed three times in PBSTx and then incubated in optimal dilutions of antibody overnight with shaking at room temperature (RT). Sections were then rinsed three times, incubated in biotinylated anti-species immunoglobu-lin (Vector Laboratories, Burimmunoglobu-lingame, CA, U.S.A.) at 1:1000 for 2 h at room temperature, rinsed three times and then incubated with avidin-biotin-peroxidase complex (ABC, 1: 1000, Vector Laboratories). Localization of bound antibody was visualized using avidin-biotin horseradish peroxidase (HRP) enzyme complex (ABC-Vector Laboratories) histochemistry and nickel ammonium sulfate-enhanced diaminobenzidine-HCl (100μg/ml) (Dojindo, Kumamoto, Japan) as substrate to produce a dark purple reaction prod-uct. To detect a second antigen, reacted sections were quenched in 1% hydrogen peroxide in PBSTx for 30 min, rinsed and then reacted with the second antibody in the same manner. The second antibody was detected using the same procedure, but with diaminobenzidine-HCl (200μg/ml) without nickel ammonium sulfate as sub-strate to produce a brown reaction product. Sections were then mounted on microscope slides, counter-stained with neutral red, dehydrated and coverslipped with permanent mounting agent.
Multi-color fluorescent confocal immunohistochemis-try was carried out to verify cellular co-localization of PGRN-expressing cells with certain other antigenic markers, as described previously [51,54]. Tissue sections were incubated with optimal dilutions of antibodies at room temperature overnight with shaking. After three washes (10 min each) in PBSTx, sections were incubated
with optimal concentrations of fluorescent-labeled sec-ondary antibodies. Bound primary antibodies were de-tected with Alexa Fluor 488-donkey anti-goat IgG, Alexa Fluor 568-donkey anti-rabbit or anti-mouse IgG or Alexa Fluor 647-donkey anti-mouse IgG or anti-rabbit IgG (all from ThermoFisher, U.S.A.). Sections were counterstained with Sudan Black (1% solution in 70% ethanol for 3 min) to quench tissue auto-fluorescence, and with DAPI (ThermoFisher, U.S.A.) to reveal nuclei. Sections were coverslipped with fluorescent mounting media (Vector Laboratories) and imaged using an Olym-pus FV1000 confocal microscope and system software. Some images were acquired using a Leica SP8 confocal microscope and this is indicated on the appropriate fig-ure legend. All images presented are z-stacks of multiple scans (5 scans). These were examined for saturation using software. For imaging of plaques for fluorescent intensity measurements and three-dimensional imaging, z-stacks were acquired to encompass the entire structure (15–20 scans with step-size of approximately 0.46 μm) using the same laser settings.
Progranulin and Prosaposin antibody validation
To validate the specificity of the PGRN goat antibody (R&D Systems #AF2420), antibody was incubated overnight at 4 °C with recombinant human PGRN protein (R&D Sys-tems #2420-PG, amino acids 18–593) in a mass ratio of 1: 200. Similarly, the PSAP rabbit antibody (R&D Systems #AF8520) was incubated with recombinant human PSAP protein (Sino-Biologicals, Beijing, China, #16224-H08H) in the same ratio. Control and protein-absorbed antibodies were diluted to the optimal concentrations for immunohis-tochemistry and reacted with sections using the above-described enzyme immunohistochemistry procedure. PGRN-absorbed antibody prepared in the same manner was also used for western blots.
Quantification of Progranulin-positive plaques
To quantify numbers and areas of PGRN-positive plaques, brain sections double-stained for PGRN and Aβ by two-color DAB enzyme histochemistry were used. Photomi-crographs were taken with a 10x objective in 3-fields per case. Images were enhanced to maximize color separation between PGRN immunoreactivity (purple) and Aβ plaques (brown). Field selection was performed by choosing 3 evenly-spaced fields encompassing all of the cortical grey matter layers of each case. Images were imported to Adobe Photoshop software (Adobe Inc., San Jose, CA, U.S.A.) and a grid layer consisting of 90,000 pixels per area (field) was created, and 10 fields were measured for a total area of 900,000 pixels/case. The following measures for each section were made; total number of plaques, number of PGRN-associated-plaques, percentage area covered by
associated plaques and mean area of PGRN-associated plaques as pixels/field.
Quantification of co-localization of Progranulin and
Prosaposin with Aβ plaques
The amounts of colocalization of PGRN- and PSAP-immunoreactivity associated with Aβ plaques were quanti-fied using double-stained confocal sections (PGRN and PSAP) for 3 LP, 3 HP and 3 AD cases. Sections were imaged using an Olympus FV1000 confocal microscope. The set-tings for laser intensities and number and thickness of scans were determined based on optimal results for LP cases, and these settings were maintained for all sections of HP and AD cases. The images were analyzed using EzColocalization
plugin for ImageJ image analysis software [55,56]. This was used to determine the Pearson colocalization coefficient for 6 separate plaques analyzed for each case (total no. plaques analyzed =18/disease group). Using the same images, the fluorescent intensities of PGRN and PSAP and areas of PGRN/PSAP plaques were also measured for each case. Three-dimensional imaging and colocalization of PGRN and Aβ interactions, and PGRN and PSAP interactions, were carried out using Imaris 8 (Bitplane AG, Switzerland) and Meshlab v2016_12 software (www.meshlab.net).
Western blotting
Extracts from brain samples were prepared by sonicating each sample in 5-volumes of RIPA buffer (ThermoFisher
Table 2 Information of primary antibodies used for the study
Antigen Antibody Supplier Cat#. Species/Type Application Dilution Progranulin PGRN R&D AF2420 Goat/Polyclonal IHC 1:4000
Systems FIHC 1:1500
WB 1:2000 IP 2μg Amyloid beta 6E10 Biolegend 803001 Mouse/Monoclonal IHC 1:2000
(1–16) FIHC 1:1000
WB 1:1000 CD45 CD45/HI30 Biolegend 304001 Mouse/Monoclonal IHC 1:2000 FIHC 1:1000 PHF-Tau (Ser202/Thr205) AT8 ThermoFisher MN1020 Mouse/Monoclonal IHC 1:2000 PHF-Tau AT180 Thermo MN1040 Mouse/Monoclonal FIHC 1:2000
(Thr231) Fisher WB 1:2000
IBA1 IBA1 Fujifilm 019–19,741 Rabbit/Polyclonal FIHC 1:1000 CD31 CD31 JC/70A Abcam Ab9498 Mouse/Monoclonal FIHC 1:500 GFAP GFAP BD bioscience 556330 Mouse/Monoclonal FIHC 1:1000 LAMP1 LAMP1 Sigma L1418 Rabbit/Polyclonal FIHC 1:1000 CD68 CD68 Biolegend 916104 Mouse/Monoclonal FIHC 1:1000 Prosaposin PSAP R&D AF8520 Rabbit/Polyclonal FIHC 1:2000
Systems WB 1:10000
IP 2μg Sortilin [53] Sortilin NT3 Abcam Ab16640 Rabbit/Polyclonal FIHC 1:1000
WB 1:2000 TMEM106B [34] TMEM106B Bethyl Lab A303- Rabbit/Polyclonal FIHC 1:1000 439A-1 WB 1:1000 Cathepsin D cathepsin D Cell signaling #2284 Rabbit/Polyclonal WB 1:1000 BACE1 BACE1 R&D MAB931 Mouse/Monoclonal FIHC 1:1000
Systems WB 1:2000
Pan NF SMI312 Biolegend 837904 Mouse/Monoclonal FIHC 1:1000 Synaptophysin SVP-38 Sigma S5768 Mouse/Monoclonal FIHC 1:500 goat IgG goat IgG R&D AB-108-C Goat/Polyclonal WB 1:2000
Scientific; 20 mM Tris-HCl, pH 7.5. 150 mM NaCl, 1% NP40, 1% sodium deoxycholate, 0.1% sodium dodecyl sulfate) supplemented with protease and phosphatase in-hibitors (Nacalai-Tesque). These samples were used without centrifugation for preparation of total protein extracts for western blotting. A similar procedure was used to extract proteins from cell pellets of THP-1-derived macrophages and PGRN-overexpressing HEK-293 cells. Total protein concentration of each sample was determined using a MicroBCA assay kit with bovine serum albumin as standard. For SDS gel electrophoresis of brain protein samples, brain protein extracts (1μg/ul) were dissolved in 4xSDS gel sample buffer (Wako Che-micals-FujiFilm, Japan) with or without reducing agent (0.1 M dithiothreitol), heated to 95 °C for 10 min and loaded onto 4–20% gradient pre-cast gels (Nacalai-Tesque, Kyoto, Japan). Gel electrophoresis was carried out at 100 V in Tris-glycine buffer except for Aβ proteins, which employed Tris-tricine buffer (pH 8.5, 100 mM Tris, 100 mM tricine and 0.1% SDS) as gel running buffer. Separated proteins were transferred to nitrocellulose and processed for detec-tion. Membranes were blocked in 5% skimmed milk dis-solved in Tris-buffered saline with 0.1% Tween 20 (TBST– 20 mM Tris-HCl, pH 7.6, 150 mM NaCl, 0.1% Tween 20) and incubated in optimal dilutions of antibody (see Table
2) in 2% milk in TBST overnight at room temperature. Membranes were washed 3 times with TBST and incubated 2 h in HRP-labeled anti-goat, rabbit or mouse IgG (Ther-moFisher) at 1:10,000. After a further 3 washes, membranes were exposed to Chemi-Lumi One Super Chemilumines-cent substrate (Nacalai-Tesque) and imaged using an Ima-geQuant LAS 4000 system (GE LifeSciences, U.S.A.). Images were adjusted and band intensities measured using Image Studio Lite software (LI-COR, Lincoln, NE, USA). After initial detection, all membranes (except the immunoprecipitated samples) were reprobed with an HRP-conjugated antibody to β-actin (Abcam, Cam-bridge, MA. USA) for normalization purposes.
Paraformaldehyde fixation of Western blot membranes
Increased sensitivity and resolution of PGRN-immunoreactive bands were obtained when western blot membranes were fixed in paraformaldehyde (PFA) vapor. A modification of the procedures described to in-crease detection ofα-synuclein was used [57–59]. Dried membranes were exposed to vaporized PFA, rather than by immersion fixation, in a sealed chamber at 60 °C for 30 min. After the PFA vapors had been vented, the membranes were processed using the above-described western blot detection method.
Enzymatic Deglycosylation
Enzymatic deglycosylation of PGRN was performed ac-cording to the manufacturer’s protocol using PNGase F
(New England Biolabs, Beverley, MA, U.S.A.) [54]. Twenty μg of protein lysates from cells and brain sam-ples were diluted in denaturation buffer and heated at 100 °C for 10 min. PNGase F enzyme (1 unit) was added to those samples along with enzyme buffers and NP-40. Following incubation of 1 h at 37 °C, samples were di-luted in 4xSDS sample buffer and analyzed by the de-scribed SDS-PAGE/western blot method.
Co-Immunoprecipitation
RIPA-brain extracts prepared for western blots were centrifuged at 14,000 g/30 min to prepare samples for immunoprecipitation assays. Immunoprecipitations were carried out using protein G- or protein A-coupled mag-netic beads (G-Biosciences, St. Louis, MO, U.S.A.) con-jugated with test antibodies. For each sample, 10μl of Protein G or Protein A magnetic beads were collected and washed with PBS 0.01% Tween 20 (PBST) using a magnetic stand, which were then mixed with 2μg of antibody (PGRN goat polyclonal, PSAP rabbit poly-clonal, or normal goat IgG) for 30 min with constant mixing. Unbound antibodies were removed by washing beads with PBST, then 200μg of brain protein extract or 100μg of cell protein extracts were added to the antibody-coupled beads. Samples were mixed with antibody-conjugated beads for 18 h at 4 °C with rotation, washed three times with RIPA, and then eluted into SDS sample buffer without reducing agent at 80 °C. The omission of reducing agent and lower denaturation temperature prevented the eluted immunoglobulin mol-ecules from being denatured to molecular sizes that interfere with detection of target proteins. Samples were separated through SDS polyacrylamide gels and trans-ferred to nitrocellulose membranes as described and de-tected with different antibodies by western blot.
Progranulin-expressing cell culture
Protein extracts from macrophage-like cells produced from the THP-1 monocytic cell line and neuronal cells produced from LAN-5 neuroblastoma cells were used PGRN-containing samples for antibody validation stud-ies,. THP-1 monocytes (TIB-202) obtained from the American Type Culture Collection (Manassas, VA, U.S.A.), were cultivated in suspension culture using RPMI media (Nacalai-Tesque) supplemented with 10% fetal bovine serum (FBS), and differentiated into adher-ent macrophage-like cells by treatmadher-ent with 25 nM phorbol myristate acetate (PMA – Sigma Aldrich, St. Louis, MO, U.S.A.) for 3 days in RPMI with 5% FBS. LAN-5 neuroblastoma cells (provided by Dr. R.C. See-ger, Children’s Hospital of Los Angeles, CA, U.S.A.) were used as a human neuronal model [60]. Cells were cultured in RPMI with 10% FBS and differentiated in RPMI with 5% FBS containing 10μM retinoic acid
(Nacalai-Tesque). A PGRN-overexpressing stable-transfected HEK cell line was also prepared. HEK cells were transfected with plasmid expressing PGRN protein fused with a green fluorescent protein sequence (gift from Dr. Morimura, Shiga University of Medical Science, Japan) and selected for resistance to G418 (500μg/ml). Cells were collected and analyzed by western blot or im-munoprecipitation for expression of PGRN.
Data analysis
Western blot data and plaque measurement data were an-alyzed by one-way Analysis of Variance (ANOVA) with Newman-Keuls post-hoc test for significance between paired groups. Significant differences were assumed if P values of less than 0.05 were obtained. All statistical ana-lyses were carried out using Graphpad Prism Version 7 software (Graphpad software, La Jolla, CA, U.S.A.). Results
Progranulin (PGRN) immunoreactivity in AD pathological structures
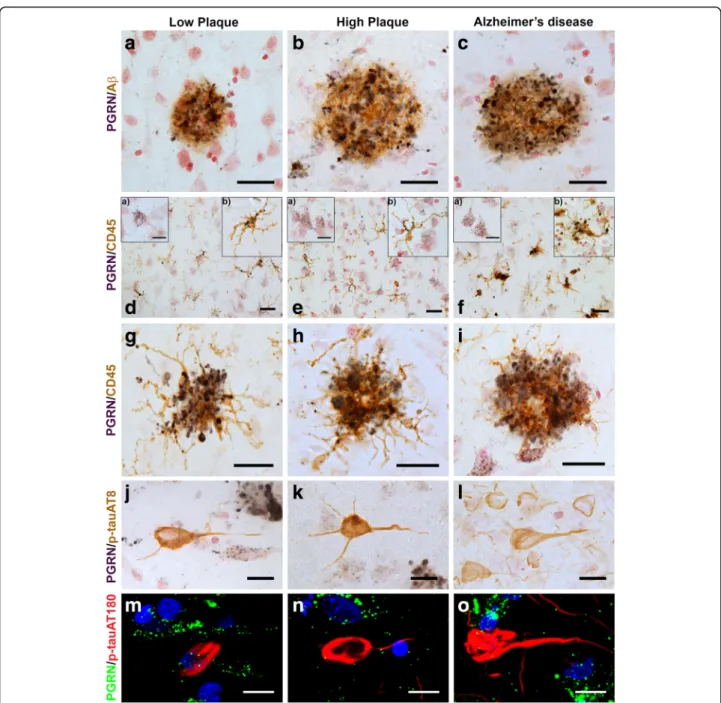
Initial analysis of PGRN expression in relation to patho-logical structures in human middle temporal gyrus (MTG) were carried out using dual-color enzyme immunohisto-chemistry on free-floating (25μm) sections. The complete series of low plaque non-demented (n = 16), high plaque non-demented (n = 15) and AD cases (n = 14) were stained for PGRN in combination with 6E10, an antibody that detected Aβ, and PGRN in combination with CD45, a marker to identify microglia. Figure 1-panels A-C show representative images of the morphologies of PGRN-associated with Aβ plaques. In low plaque (low pathology) non-demented cases, it was observed that although plaque numbers were sparse, many were PGRN-positive (Fig.1a). The size and number of PGRN-associated plaques in-creased in the high plaque and AD cases (Fig.1b, Fig.1c).
It was hypothesized that PGRN immunoreactivity around plaques would be due to its expression by infiltrat-ing microglia. PGRN/CD45 stained sections revealed that most microglia were positive for PGRN, but this was more intense in reactive microglia in AD cases (Fig. 1d-f). PGRN immunoreactivity was also detected in neurons in these sections. These could be clearly identified by their morphology (Fig.1d-f, insets a). The morphology of indi-vidual microglia are shown as insets b in Fig.1d-f. Figure
1 panels G-I show that PGRN-immunoreactive plaque structures are infiltrated by microglia in each of the dis-ease groups, but much of this PGRN immunoreactivity was not associated with microglia. Selected sections from these staged plaque series with low, medium and abun-dant numbers of tangles (Table 1) were also stained for PGRN and phosphorylated tau (tau). Two separate p-tau antibodies were used; AT8, which is specific for p-tau phosphorylated at serine 202 and threonine 205, and
AT180, which is specific for p-tau at threonine 235. Figure
1 (panels J-L) show that AT8 immunoreactive tangles were not positive for PGRN, and similarly, using confocal microscopy AT180 immunoreactive structures were not positive for PGRN (Fig.1, panels M-O).
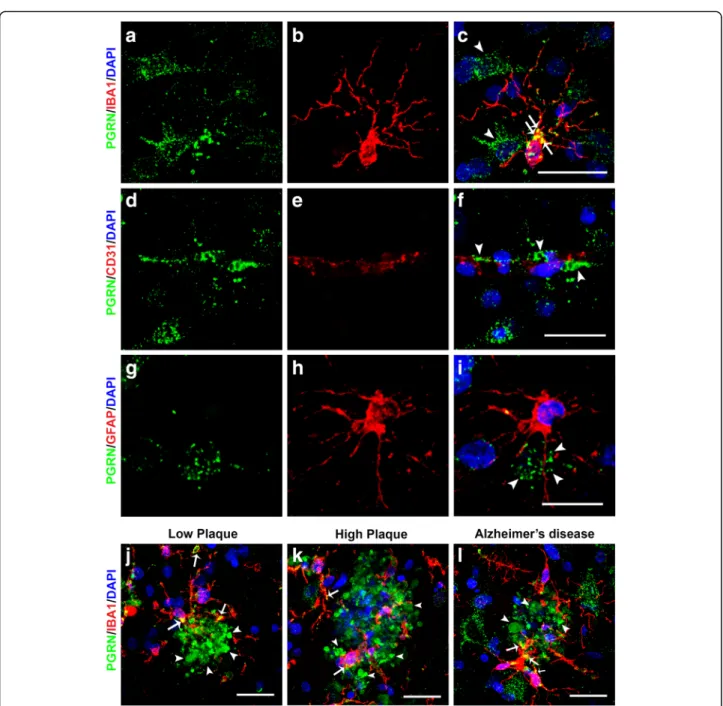
Progranulin is expressed in neurons, microglia and blood vessels but not astrocytes in human middle temporal gyrus
To confirm colocalization features at the cellular level, multi-color confocal fluorescent microscopy was carried out on selected cases from each group. Colocalization of PGRN in microglia was confirmed by confocal micros-copy with microglia being identified using an antibody to IBA-1 (Fig.2, panels A - C). A feature of PGRN im-munoreactivity that can be seen in Fig. 2 (panels A and C) is PGRN immunoreactive structures in microglia (ar-rows) are larger than those in neurons (arrowheads). We had also observed vascular staining for PGRN in enzyme histochemistry-stained sections, but using confocal mi-croscopy, we could not confirm that immunoreactivity colocalized with CD31, a specific marker for endothelial cells (Fig.2f, arrowheads). PGRN staining was present in many vessels with staining possibly being in the extracel-lular basement membrane surrounding the vessels (Fig.
2, panels D-F). Staining of PGRN in brain vasculature has not previously been reported. PGRN immunoreactiv-ity did not colocalize with GFAP-positive astrocytes in any of the sections examined (examples; Fig. 2, panels G-I). We also further examined the interaction of IBA-1-positive microglia with PGRN in low plaque, high plaque and AD cases (Fig. 2, panels J-L). Most plaque-infiltrating microglia showed some colocalization with PGRN (yellow, indicated by arrows), but these figures show that most plaque-associated PGRN did not colo-calize with microglia (arrowheads).
Validation of progranulin antibody used for immunohistochemistry
Due to concerns raised about the specificity of commer-cial antibodies to PGRN and granulin (GRN) [61], valid-ation studies were carried out with the PGRN antibody (AF2420; goat polyclonal, R&D Systems, Minneapolis, MN, U.S.A.) used in this study. This antibody has unique features having being prepared against a glycosyl-ated recombinant fragment consisting of the majority of the PGRN protein (amino acids 18–593). Immunization with this peptide will have produced an antibody specific against many different epitopes encompassing the complete PGRN protein rather than a single epitope.
Immunohistochemistry was carried out with MTG tis-sue sections using PGRN antibody that had been absorbed with PGRN-immunizing peptide or control-absorbed. Sections were developed for single-color
enzyme immunohistochemistry with counterstaining. Additional file1: Figure S1 illustrates results from one of the AD sections examined showing that immunohisto-chemistry with absorbed antibody resulted in absence of
cellular and plaque staining (Additional file 1: Figure S1A compared to Figure S1B).
Further characterization of the PGRN antibody was carried out by western blot using protein extracts of
Fig. 1 Progranulin Interactions with AD pathological Features. (a-c). Representative photomicrographs of progranulin (PGRN)(purple)
immunoreactivity associated with amyloid beta (Aβ) plaques (brown) in MTG sections of low plaque, high plaque and Alzheimer’s disease cases. Scale bar represents 30μm. (d-f). Photomicrographs of PGRN (purple) immunoreactivity associated with CD45 immunoreactive microglia in MTG sections of low plaque (d), high plaque (e), and Alzheimer’s disease cases (f). Insets a) show at higher magnification PGRN-positive stained neurons present in each section. Neurons are identified by their size and characteristic shape. Insets b) show higher magnification of PGRN-positive microglia. Scale bar represents 20μm (d-f), and 10 μm for insets. (g-i). Photomicrographs of PGRN (purple) with plaque-associated CD45-positive microglia (brown). Progressive increase in accumulation of CD45-CD45-positive microglia in low plaque (g), high plaque (h) and Alzheimer’s disease (i) cases. Scale bar represents 30μm. (j-o). Absence of PGRN immunoreactivity of neurofibrillary tangles. (j-i) Photomicrographs of PGRN (purple) and phosphorylated tau (AT8)(brown) double-stained sections from low plaque (j), high-plaque (k), and Alzheimer’s disease cases (l). (m-o). Confocal micrographs of PGRN (green) and phosphorylated tau (AT180)-positive tangles in low-plaque (m), high-plaque (n) and Alzheimer’s disease (o) cases. Scale bar represents 10μm.
MTG brain samples and PGRN-expressing cells. This antibody detected major polypeptide band(s) of approxi-mately 75–80 kDa, which corresponds to full-length gly-cosylated PGRN, and also a minor polypeptide band of 55 kDa. In samples with high levels of PGRN expression, higher molecular immunoreactive bands can also be
detected (Additional file 2: Figure S2A and Figure S2B) suggestive of dimers. Western blots showed that the PGRN polypeptide bands were absent in blots probed with peptide-absorbed (+ Peptide) antibody compared to unabsorbed (−Peptide) antibody (Additional file 2: Fig-ure S2A). Optimization studies for the detection of
Fig. 2 Confocal Immunohistochemistry of progranulin with cellular markers. (a-c). Cellular expression of PGRN (green) (a), microglial marker IBA-1 (red) (b) and colocalization of structures within microglia (yellow) (c) in a high plaque case. Green immunoreactivity that did not colocalize with IBA-1 (red) immunoreactivity identified cells with neuronal morphology. Scale bar represents 20μm. (d-f). PGRN immunoreactivity (green) (white arrowheads) was present within cerebral vessels, but did not colocalize with the endothelial marker CD31 (red) in AD case. Scale bar represents 20μm. (g-i). PGRN immunoreactivity (green) (g) did not colocalize with astrocyte marker GFAP (red) (I). Scale bar represents 20 μm. (j-l). Expression of PGRN (green) and microglial marker IBA-1 (red) associated with plaque structures of low plaque (J), high plaque (k), and Alzheimer’s disease (l). PGRN-positive microglia (yellow– arrows) are observed in microglia clustering and infiltrating PGRN- positive plaque-associated structures. Most of the PGRN immunoreactivity (arrowheads) appeared separate from DAPI-stained nuclei (DAPI– blue). Scale bar represents 30μm.
PGRN polypeptides by western blot showed that omis-sion of reducing agents in brain and control cellular samples significantly enhanced the sensitivity of detec-tion of PGRN polypeptides (Addidetec-tional file 2: Figure S2B). This was particularly noticeable in extracts of THP-1 macrophage-like cells and LAN-5 neuronal-like cells (Additional file2: Figure S2B, comparing between + DTT and – DTT lanes). Furthermore, fixation of west-ern blot membranes with paraformaldehyde (PFA) vapor also increased the resolution and sensitivity of the de-tected PGRN bands in brain samples. The major poly-peptide band(s) of 75–80 kDa could be resolved into two separate bands on the PFA-treated membranes (Add-itional file 2: Figure. S2C). This pretreatment allowed better detection of the 55 kDa band that could be diffi-cult to detect in brain samples of non-PFA treated mem-branes. Subsequent western blot analyses incorporated these technical changes (Fig.6and Additional file3: Fig-ure S3). To show that the 75–80 kDa bands were glyco-sylated and the 55 kDa band represented unglycoglyco-sylated PGRN, brain samples and THP cell extracts were treated with the deglycosylation enzyme PNGaseF and analyzed by western blot (Additional file2: Figure S2D). The shift from 75 kDa to 55 kDa was evident in only one of two bands in the PNGaseF-treated samples, but increased levels of 55 kDa in these brain samples can be clearly seen. In the treated THP cell extract, the shift in mo-lecular weight was complete (THP+ compared to THP-sample) (Additional file2: Figure S2D).). These findings verified that the goat PGRN antibody specifically identi-fied PGRN in tissue and in protein extracts. An import-ant feature to observe in Additional file3: Figure S3A)., which shows the complete membranes used for mea-surements of PGRN in brain samples, is the absence of low-molecular weight granulin peptides.
Characterization of progranulin immunoreactive structures associated with plaques in staged MTG cases
It was observed that many of the Aβ plaques present in all cases studied had PGRN-immunoreactive structures, even the few plaques present in many of the low plaque cases. This indicated that PGRN association with Aβ plaques was an early pathological event. The distribution of PGRN and Aβ immunoreactivity across cortical layers is shown at low magnification in representative images of low plaque (Fig.3a), high plaque (Fig.3b), and Alzhei-mer’s disease (Fig. 3c) cases. Inset images represent PGRN-positive and negative plaques in each group. Examples of PGRN-negative and positive plaques are also shown at higher magnification (Fig. 3d). The nega-tive plaques appeared to have a more diffuse morph-ology than positive plaques. This was characterized by staining selected sections with thioflavin-S (thio-S) to identify aggregated plaques. PGRN immunoreactivity
was associated with thio-S positive, Aβ positive plaques but not thio-S negative, Aβ positive plaques (Fig. 3e). Seven of the 15 LP cases had no detectable Aβ plaques in the MTG sections examined, while in the remaining LP cases with Aβ plaques, many of these were PGRN-positive. The numbers of Aβ plaques (Fig. 3f) and the number of PGRN-associated Aβ plaques (Fig. 3g) were calculated in sections from each case. This measure did not account for the size or intensity of PGRN immuno-reactivity in plaques only its presence or absence. We used these images to calculate the percentage area occu-pied by PGRN-associated Aβ plaques for each case (Fig.
3h), and the mean area of positive plaques (Fig. 3i). Al-though there were significantly more PGRN-positive pla-ques with significantly larger total areas in the AD cases compared to the HP cases, we noticed differences in the morphologies of PGRN-associated Aβ plaques between HP and AD cases. Many of the PGRN-positive Aβ pla-ques in AD cases had less intense coverage of PGRN im-munoreactivity (top insets Fig. 3b and c). This was investigated further in subsequent sections.
Further detailed studies of PGRN interactions with Aβ plaques were also carried out by confocal microscopy (Fig. 4). Thioflavin-S histochemistry combined with PGRN and Aβ immunohistochemistry was used to show that mature aggregated thio-S positive plaques in Alzhei-mer’s disease cases showed some associated PGRN im-munoreactive structures, while thio-S positive tangles did not (Fig. 4 (a-d), low magnification and Fig. 4 (e-h) higher magnification). Figure4d (arrowhead) did identify a dense-cored, burnt-out plaque that was thio-S positive but had minimally detectable associated PGRN. The fea-tures of PGRN-positive plaques in low plaque, high plaque and Alzheimer’s disease cases revealed that most of the deposits of PGRN around plaques appeared extra-cellular, and even though cell membranes are not visible in the sections, most PGRN immunoreactivity was not clearly associated with nucleated cells (Fig.4panels L, P, T). Comparison of plaque morphologies between cases showed the relative size and distribution of PGRN in plaques varied between groups. In the low plaque and high plaque cases, the PGRN appeared as aggregates around the developing plaque with some colocalization with Aβ (Fig. 4 Merged – yellow arrows Fig. 4k and l compared to Fig. 4o and p). In the AD cases, there was less colocalization, and the Aβ immunoreactivity (Fig.4s and i) extended beyond the PGRN-positive structures. This feature can also be seen in Fig.4h).
The confocal images of PGRN and Aβ-stained plaques were further analyzed using computer-assisted three-dimensional imaging. These images showed the inter-action of PGRN and Aβ positive structures in the AD case shown in Fig. 4t. Figure4u shows a computer ren-dered three-dimensional image of the highlighted area
indicated in Fig.4t. Analysis of the 3-D rendered image with MeshLab software in Top view (Fig. 4v) and Side view (Fig. 4w), which analyzed the interactions through multiple layers, showed some overlap of these structures (Fig. 4v and Fig. 4w – yellow overlap) but most of the structures appeared separate (green: PGRN, red: Aβ). Overall, the arrangements appeared to confirm the im-ages from enzyme and confocal microscopy of the pres-ence of two aggregated structures associated with each other but with limited colocalization. Similar interaction mesh images could be produced from confocal images of PGRN associated with plaques from low plaque and high plaque cases.
Analysis of interactions of PGRN-immunoreactive structures with neuritic plaques were carried out using markers for pTau (antibody AT180), pan-neurofilaments (preferentially phosphorylated neurofilaments) (antibody SMI312) and synaptophysin. Images from Alzheimer’s dis-ease case are shown (Additional file 3: Figure S3 Add-itional file 3: Figure S3). Each of these markers identify distinct neuronal components. Each neuritic plaque shown (Additional file3: Figure S3A, D, G) showed strong associated PGRN staining. The merged images showed lit-tle to no colocalization of these neuronal markers and PGRN on the neuritic plaques observed (Additional file3: Figure S3C-pTau; Additional file3: Figure S3F-NF; Add-itional file3: Figure S3I-synapto). This was assessed by the absence of yellow colocalization in the Z-stack images.
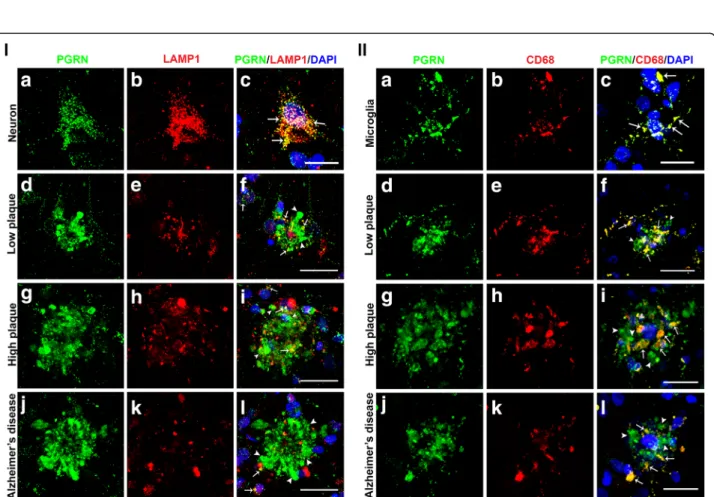
Association of Progranulin with lysosomal proteins
A study of PGRN and lysosomal proteins on plaques of 5xFAD AD-model transgenic mice had observed that most Aβ plaques colocalized with lysosomal proteins, and that most PGRN associated with Aβ plaques colocalized with lysosomal-associated membrane protein-1 (LAMP-1) [32]. These authors hypothesized that PGRN associated with plaques represented an aberrant accumulation in
lysosomes. We carried out confocal microscopy with anti-bodies to lysosomal proteins LAMP-1 and CD68 in con-junction with PGRN to verify whether these observations could be made in human brain materials. Figure5(I) shows representative results for PGRN and LAMP-1. The anti-body to LAMP-1 used in this study only identified neurons and not microglia. Figure5(I) (panels A-C) demonstrated that PGRN immunoreactivity almost completely coloca-lized with LAMP-1 in neurons. This verified the specificity of LAMP-1 immunoreactivity to lysosomal structures. Examining PGRN-positive plaques in sections from low plaque (Fig. 5 (I) (panels D-F), high plaque (Fig. 5 (I) (panels G-I), and Alzheimer’s disease sections (Fig. 5 (I) (panels J-L) identified different amounts of LAMP-1 stain-ing, but limited colocalization of PGRN with LAMP-1 in these plaque structures was evident. There were greater amounts of colocalization in the low plaque and high plaque cases than in the AD cases (Fig.5(I) (panels F, I, L) (yellow– indicated by arrows).
CD68, a macrophage-specific lysosomal membrane protein, was used to identify colocalization of PGRN in lysosomes of microglia. Figure 5 (II) (panels A-C) show almost complete colocalization of PGRN and CD68 in isolated microglia on an AD section (yellow – indicated by arrows). Examining plaque structures showed that in low plaque cases, CD68 showed significant colocalization with PGRN (Fig.5 (II) (panel F). In high plaque and AD cases, with larger plaques, there was still extensive colo-calization (yellow-indicated by arrows), but much of the PGRN immunoreactivity did not colocalize with CD68, and appeared not to be cell-associated (green-indicated by arrowheads).
Progranulin protein levels in low plaque, high plaque and AD MTG samples
Measurement of PGRN protein levels in LP, HP and AD samples were carried out using the described technical
(See figure on previous page.)
Fig. 3 Quantification of numbers and areas of progranulin-positive plaques. (a-c). Low magnification of representative images of low plaque (a), high plaque (b) and Alzheimer’s disease (c) cases stained for PGRN (purple) and Aβ (6E10) brown. Series of sections were used for quantification using image analysis software. Examples of PGRN-positive (top) and PGRN-negative plaques (lower) are shown as insets. Scale bars represent 200μm. (d). Higher magnification images of PGRN-negative (arrowhead) and PGRN-positive (arrows) amyloid plaques identified with antibodies to PGRN (purple) and 6E10 (brown). PGRN-positive plaques tended to have a more aggregated morphology while PGRN-negative were more diffuse. Scale bar represents 30μm. (e). PGRN, Aβ and thioflavin-S confocal microscope image. Colocalization of PGRN (red) associated with thioS-positive (green)-Aβ plaques (blue)(arrows) with thioS-negative Aβ plaque with minimal amount of PGRN (arrowhead) in an AD section. Scale bar represents 20 μm. Images were acquired with Leica SP8 microscope. (F). Bar chart showing total number of Aβ plaques in all cases studies. LP (n = 16), HP (n = 15) and AD (n = 14). Results represent mean ± standard error of mean (S.E.M.). Significant increase in numbers of plaques in HP and AD compared to LP **** (p < 0.0001), between LP and HP **** (p < 0.0001) and between HP and AD (** p < 0.01). (G). Bar chart showing number of Aβ plaques with associated PGRN in all cases studies. LP (n = 16), HP (n = 15) and AD (n = 14). Results represent mean± standard error of mean (S.E.M.). Significant increase in numbers of plaques in HP and AD compared to LP **** (p < 0.0001) and between HP and AD (**** p < 0.0001). (h). Bar chart showing total area (percentage) occupied by PGRN-associated Aβ plaques in all cases studies. LP (n = 16), HP (n = 15) and AD (n = 14). Results represent mean ± S.E.M. Significant increase in numbers of plaque occupied area in HP and AD compared to LP **** (p < 0.0001) and between HP and AD (**** p < 0.0001). (i). Bar chart showing average plaque size (pixels) of PGRN-associated plaques in all cases studies. Numbers derived from total area occupied divided by number of plaques for each case. Results represent mean ±S.E.M. LP (n = 16), HP (n = 15) and AD (n = 14). Significant increase in average plaque size in LP and AD compared to LP ****p < 0.001) and between HP and LP (*** p < 0.001). NS - Not significantly different.
(See figure on previous page.)
Fig. 4 Characterization of progranulin immunoreactivity associated with different types of Aβ plaques in low plaque, high plaque and Alzheimer’s disease cases (a-d). Thioflavin-S staining of Alzheimer’s disease tissue section (low magnification) characterization of PGRN (red) and Aβ-immunoreactive plaques (blue). Triple-color merged image (D) identifies that thio-S plaques have PGRN-positive associated structures but thio-S positive tangles show no PGRN immunoreactivity. Box area in D illustrates areas shown at higher magnification in panels E-H. Scale bar represents 100μm. (e-h). Higher magnification of area from D showing thio-S positive plaques and tangles (green), PGRN (red) and Aβ (blue). Scale represents 25μm. Images were acquired with Leica SP8 microscope. (i-l). Low Plaque case: Features of PGRN (green) immunoreactive
accumulations (I) around Aβ (red) immunoreactive plaque (j), and merged images (k and l) showing limited overlap (yellow) between PGRN and Aβ. Image D with DAPI-stained nuclei demonstrate the presence of cells around the plaque. (m-p). High Plaque case: PGRN (green)(M) and Aβ (red)(N) immunoreactivity showing more extensive colocalization (yellow) (O and P). (q-t). Alzheimer’s disease case: PGRN (green) (q)
immunoreactivity and Aβ (red) (R) show less colocalization (yellow) with the formation of larger AD plaques. PGRN aggregates are present within the Aβ immunoreactive areas but with limited colocalization (Q and T). Three-Dimensional Reconstructions of progranulin-positive Aβ plaques. (u-w). Three-dimensional reconstruction and Mesh rendering of PGRN and Aβ immunoreactive plaques in AD case (U). Mesh rendering of three-dimensional modelled plaque shown in panel (Top view, panel V). The two immunoreactive structures (PGRN-green; Aβ-red) are present as aggregates but show limited areas of interaction (Side view, panel W). Similar patterns of colocalization were observed for LP and HP cases.
Fig. 5 Association of progranulin with lysosomal proteins. i) Progranulin and Lysosomal-Associated Membrane Protein-1 (LAMP-1) interactions in neurons and plaques. (a-c). PGRN (green) (A) and LAMP-1 (red) (b) immunoreactivity in neurons show almost complete colocalization (yellow), (c) showing PGRN in neurons is mainly localized to lysosomes. Scale bar represents 10μm. (d-f). PGRN immunoreactivity (green) (d) and LAMP-1 (red) (E) in plaques of low plaque case showed limited colocalization (arrows-yellow) (F). Scale bar represents 30μm. (g-i). PGRN immunoreactivity in plaques (green) (G) and LAMP-1 (red) (H) in plaques of high plaque case showed more extensive colocalization (arrows-yellow) (I). Scale bar represents 30μm. (j-l). Limited immunoreactivity for LAMP-1 in AD cases (k). PGRN immunoreactivity in plaques (green) (j) and LAMP-1 (red) (k) in plaques of AD case showed very limited colocalization (arrows-yellow) (l). Scale bar represents 30μm. II) Progranulin and lysosomal protein CD68 interactions in microglia and plaques. a-c). PGRN (green) (a) and CD68 (red) (b) immunoreactivities in microglia show almost complete colocalization (yellow) (c) showing PGRN in microglia is mainly localized to lysosomes. Plaque-associated CD68 and PGRN show almost complete colocalization Scale bar represents 10μm. (d-f). Low plaque case: (g-i). High plaque case: (j-l). Alzheimer’s disease case. CD68 (red) and PGRN immunoreactivity (green) showed extensive colocalization (arrows-yellow) in all groups but most plaque-associated PGRN did not colocalize (green). Scale bar represents 30μm.
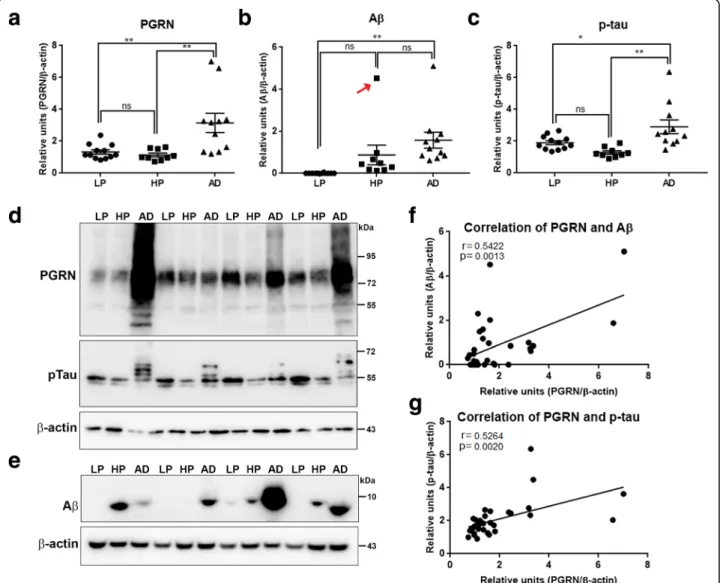
modifications (omission of reducing agents and parafor-maldehyde fixation of membranes) to improve sensitivity of detection of PGRN-related polypeptides. Measure-ments of total PGRN levels were determined that com-bined the intensities of the major 75–80 kDa bands and minor 55 kDa band (representative blot Fig.6d; complete
series of blots Additional file4: Figure S4A). There were significantly increased levels of PGRN in AD cases com-pared to HP and LP cases, but not between HP and LP cases (Fig. 6a). This indicated the overall increase in PGRN occurred later in the disease. These blots were also analyzed for levels of Aβ (Fig. 6b)–Aβ, and
Fig. 6 Biochemical analyses of Progranulin in MTG samples compared to Aβ and phosphorylated tau. a). Scatter plot showing expression levels of PGRN protein in the different groups. Results presented represent the combination of levels of 75–80 kDa and lower molecular weight (55 kDa) PGRN protein bands. Results represent mean ±S.E.M. Significantly increased levels of PGRN protein were present in AD case compared to LP and HP cases but not between LP and HP cases (** p < 0.01, ns– not significant). b). Scatter plot showing expression levels of Aβ protein in the different groups. Results presented represent the levels of all p-tau detected bands. Results represent mean ±S.E.M. Significantly increased levels of Aβ (monomer) protein were present in AD case compared to LP and AD cases but not between LP and HP or HP and AD cases (** p < 0.01, ns– not significant). Outlier HP case indicated by red arrow (see text). c). Scatter plot showing expression levels of phosphorylated tau (p-tau– Thr 231) protein in the different disease groups. Results presented represent the levels of all p-tau detected bands. Results represent mean ±S.E.M. Significantly increased levels of p-tau protein were present in AD cases compared to LP and HP cases but not between LP and HP cases (* p < 0.05, ** p < 0.01, ns– not significant). d). Western blots showing bands detected with goat antibody to PGRN (PGRN) in MTG protein extracts from low plaque (LP), high plaque (HP) and AD cases. The complete series of samples are presented in Additional file4: Fig. S4A). The same blots were reprobed with antibody AT180 to phosphorylated tau (pTau), andβ-actin for normalization purposes. e). Western blots showing bands detected with antibody 6E10 to Aβ in MTG protein extracts from low plaque (LP), high plaque (HP) and AD cases. Results represent mean ±S.E.M. Samples were separate from those in panel A by using Tris-tricine gels to resolve low molecular weight bands. f). Correlation Analyses between PGRN protein and Aβ protein levels for all samples. Significant correlation (r = 0.5422, p = 0.0013). g). Correlation Analyses between PGRN protein and p-tau (Thr231) protein levels for all samples. Significant correlation (r = 0.5264, p = 0.002).
phosphorylated tau (p-tau-Thr231)(Fig. 6c)-pTau). Re-sults showed significantly greater Aβ in AD cases but not compared to HP cases. However, the Aβ level in one HP case (indicated with a red arrow (Fig.6b) was much higher than the remainder of the HP samples. This sam-ple was from a 99 year-old subject with a plaque score of 14 but without documented dementia. This case had high PGRN levels and was identified as a statistical out-lier. Removing it from the analysis of Aβ levels between groups produced significant difference between HP and AD (p < 0.01); this case was included in the correlation analyses (Fig. 6f). Correlation analyses between PGRN and Aβ levels (Fig. 6f) showed statistical significance (Pearson r = 0.5422, p = 0.0013). We also compared PGRN expression levels with p-tau (Thr231) (Fig. 6 d-pTau). Although there was no evidence of p-tau and PGRN colocalization at the cellular level, there was sig-nificant correlation between PGRN and p-tau (AT180) levels (Pearson r = 0.5264, p = 0.0020) (Fig. 6g). These results indicate total PGRN levels increased with in-creasing amounts of plaque and tangle pathology.
Co-immunoprecipitation of Progranulin-binding proteins in brain samples identified prosaposin
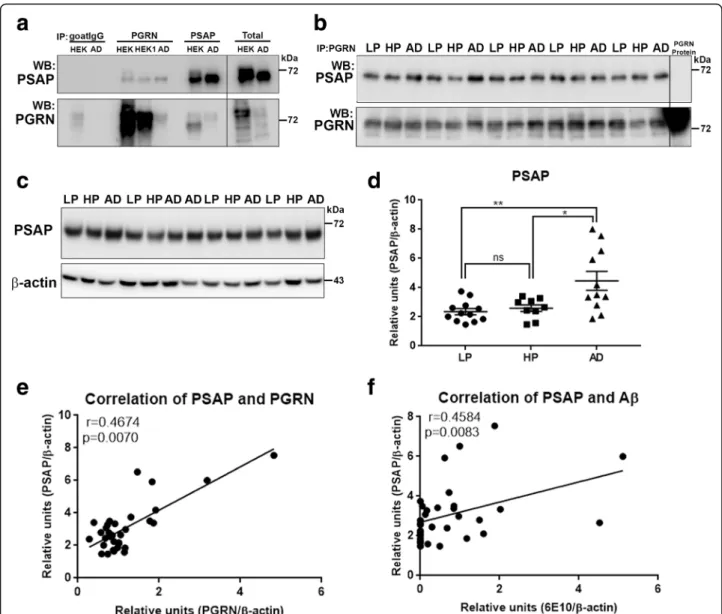
We used co-immunoprecipitation/western blot method-ology involving precipitation of PGRN from human brain samples with PGRN-antibody conjugated magnetic beads followed by western blot with antibodies to certain previously identified PGRN-interacting proteins. Control experiments identified that immunoprecipitation of PGRN using brain samples and PGRN-overexpressing HEK cells pulled-down prosaposin (PSAP) (Fig. 7a -PGRN). This interaction was confirmed by showing im-munoprecipitation of PSAP pulled-down PGRN (Fig. 7a -PSAP). The samples were eluted from the beads under non-reducing conditions and analyzed by western blot for other possible proteins interacting with PGRN. Elu-tion of proteins under non-reducing condiElu-tions at 80 °C (instead of 95 °C) resulted in samples with limited inter-ference with dissociated immunoglobulin polypeptides. Under the immunoprecipitation conditions used, we only detected PSAP by western blot in brain samples precipitated with PGRN antibody-conjugated magnetic beads. These samples were also probed with antibodies to sortilin, TMEM106B, cathepsin D and beta-secretase-1 (BACE-beta-secretase-1) but did not detect these proteins (Additional file 5: Figure S5A and S5B). However, sortilin, cathepsin D and BACE-1 were detected in brain samples precipi-tated with PSAP (Additional file5: Figure S5A and S5B). The lack of colocalization of these proteins with PGRN on plaques was confirmed by confocal microscopy on AD sections (Additional file5: Figure S5, panels D-O). A larger series of LP, HP and AD brain MTG extracts were analyzed for the interaction of PGRN and PSAP.
Samples were immunoprecipitated with PGRN antibody and analyzed for PSAP by western blot (Fig.7b). Match-ing blots were probed with PGRN antibody to confirm its precipitation. Quantification of band intensities and calculation of ratio of intensities of PSAP to PGRN showed no significant differences between the different groups of samples (Additional file5: Figure S5C). Images of the full blots for immunoprecipitation experiments confirm the absence of saposin peptides (Additional file
6: Figure S6A) and granulin peptides (Additional file 6: Figure S6B) interacting with brain samples precipitated with antibody to PGRN. Samples from HEK cells over-expressing PGRN (Additional file6: Figure S6C- lanes IP PGRN +, HEK) precipitated with PGRN antibody did show some granulin reactive bands in the blot after longer exposure.
To follow up the identification of PSAP as a PGRN-binding protein in brain, quantification of PSAP protein levels was carried out in the same complete series of MTG brain samples used for PGRN western blot ana-lysis. These samples were also analyzed in the absence of reducing agents with proteins on transferred membranes being fixed with PFA vapors, as described for PGRN analyses. These analyses showed a significant increase in AD compared to LP (p < 0.01) and HP (p < 0.05) cases (Fig. 7d), but not between LP and HP cases. Figure7c is a representative western blot image of PSAP in brain samples with the complete series of blots shown in Add-itional file 3: Figure S3B. As expected, there was signifi-cant correlation between PGRN and PSAP levels in these brain samples (Fig. 7e - Pearson r = 0.4674, p = 0.0070). In addition there was significant correlation be-tween PSAP and Aβ levels (Fig.7f - Pearson r = 0.4583, p = 0.0083).
Immunohistochemical colocalization of prosaposin with progranulin and cellular markers
We have shown using co-immunoprecipitation methods that PGRN and PSAP are interacting in brain protein ex-tracts. This led to the question whether there were inter-actions of these molecules around plaques in our human brain samples. Experimental studies have shown that the interactions of PGRN and PSAP have signifi-cant effects on their cellular trafficking and biochemical properties [40,42].
We confirmed the specificity of the PSAP by peptide absorption. Sections reacted with PSAP-absorbed anti-body did not show immunoreactivity (Additional file 1: Figure. S1C) compared to control-absorbed antibody (Additional file 1: Figure. S1D). In AD cases, PSAP im-munoreactivity was present in most neurons. This is evi-dent in most panels of Fig.8. PSAP was also associated with many Aβ plaques, but the two molecules seemed to show limited interactions as evidenced by the red
immunoreactivity (PSAP) on the plaque and limited amounts of colocalized yellow (PSAP + Aβ) (arrows Fig.
8c)(Fig. 8a-c). Triple staining for PGRN, PSAP and Aβ
of plaques in AD cases showed similar morphologies around Aβ-positive structures (Fig.8d and e). There was
extensive though not exclusive colocalization of PGRN and PSAP associated with Aβ-immunoreactive struc-tures (Fig. 8f). As some PGRN staining around plaques can be in microglia and neurons, we determined whether PSAP expression could also be detected in
Fig. 7 Biochemical analysis of interactions of progranulin and prosaposin in MTG brain samples. (a-b). Co-immunoprecipitation of Progranulin and Prosaposin. a). Western blot control analyses to show interactions of progranulin (PGRN) and prosaposin (PSAP). Immunoprecipitation of PGRN-overexpressing HEK (HEK and HEK1) cells and AD brain sample with protein G- (goat antibody) or protein A- (rabbit antibody) antibody-conjugated magnetic beads. Beads were prepared using non-immune goat IgG, goat anti-PGRN and rabbit anti-PSAP. Immunoprecipitated samples were separated by gel electrophoresis, transferred to membranes, and probed with antibodies to PSAP and PGRN. Samples of total protein (non-immunoprecipitated) from PGRN-overexpressing HEK (HEK) cells and brain sample (AD) were analyzed as specificity controls. Samples immunoprecipitated with PGRN antibody contained PSAP, and samples precipitated with PSAP antibody contained PGRN. b). All of the brain samples from LP, AD and HP cases precipitated with PGRN antibody pulled-down PSAP. A series of cases (n = 5) from each group were analyzed. Western blot images for both antibodies are shown. (c-f) Biochemical analysis of prosaposin in MTG brain protein extracts. c). Western blot analysis of total PSAP protein levels in MTG samples. Representative image of western blot demonstrating PSAP protein in samples from LP, HP and AD cases. The complete images of all samples analyzed for PSAP are shown as Additional file4: Figure. S4B. D). Scatter plot showing expression levels of PSAP protein in the different groups. Results represent mean ±S.E.M. Significantly increased levels of PSAP protein were present in AD case compared to LP and HP cases but not between LP and HP cases. Significant increased levels of PSAP protein in MTG samples from AD compared to HP (* p < 0.05) and LP (** p < 0.01). e). Positive correlation between PSAP and PGRN protein levels in MTG samples (Pearson r = 0.4674, p = 0.0070). f). Positive correlation between PSAP and Aβ protein levels in MTG samples (Pearson r = 0.4584, p = 0.0083).
microglia or astrocytes. Double staining of sections for PSAP with IBA-1 and CD68 (microglia markers), and GFAP (astrocyte marker) identified limited amounts of colocalization (arrows Fig.8g-i), while all images showed that most PSAP immunoreactivity was present in neu-rons. Double staining for CD68 and PSAP of sections from each group identified plaque-like structures with significant PSAP immunoreactivity (Fig.8J-L), but there was only small amounts of colocalization with the CD68-positive microglia infiltrating these plaques.
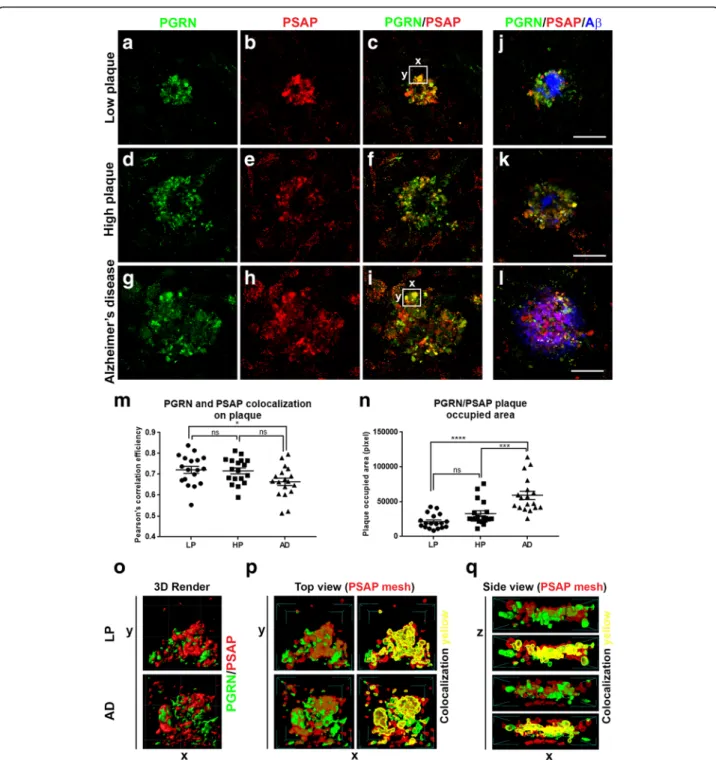
Examination of plaque structures in low plaque, high plaque and AD cases stained for PGRN and PSAP (Fig.9) showed extensive colocalization in all groups (Fig.9a-c–LP;
Fig. 9d-f-HP; Fig. 9g-i-AD, but with differences between disease groups. All PGRN-associated plaque structures were positive to different extents with PSAP. Measurement of the degree of colocalization of PGRN and PSAP (as Pear-son’s correlation efficiency) showed less colocalization in plaques of AD cases compared to LP cases, but not be-tween LP and HP or HP and AD (Fig.9m). The Pearson’s
correlation efficiency values showed a high degree of colo-calization of PGRN and PSAP. In order to carry out mea-surements of PGRN and PSAP colocalization, sections were double-stained for these proteins, but not also for Aβ. This produced images of approximately equal fluorescent intensity; however, to illustrate the arrangement of Aβ in relation to PGRN and PSAP in the different disease groups, parallel sections from the same cases that were triple-stained for PGRN (green), PSAP (red) and Aβ (blue) are also shown (Fig.9j-LP, Fig.9k-HP, Fig.9l-AD). The PGRN-and PSAP-positive structures in Fig. 9 J-L show the rela-tively larger Aβ plaques in AD cases compared to LP and HP cases. The occupied area of PGRN-PSAP plaques dif-fered significantly between the disease groups. These area measurements were of PGRN-PSAP/Aβ-occupied areas not just Aβ- occupied areas. The same measurements were used to determine the fluorescent intensities of PGRN (Additional file7: Figure S7A and S7B) and PSAP immuno-reactivity (Additional file7: Figure S7Cand S7D) on plaques in the different disease groups. The total plaque intensities of PGRN and PSAP in AD cases were significantly less than between LP and HP groups (Additional file 7: Figure
S7A and S7C), and similar results were obtained when in-tensity measures were corrected for plaque size (Additional file7: Figure S7B and S7D).
The confocal images of PGRN and PSAP in plaque structures were further analyzed using computer-assisted three-dimensional imaging to illustrate colocalization using Mesh software imaging. These images showed the Mesh images illustrating the interaction of PGRN and PSAP in an LP and AD case (white boxes areas in Fig.9c and Fig.9i). Mesh rendering of 3D-modelled images facili-tate the visualization of the interaction of PGRN (green) structures with PSAP (red) structures (Fig. 9p and Fig.
9q). Unlike the rendering of PGRN and Aβ (Fig.4u), the patterns of PGRN and PSAP interactions suggest close binding of these two proteins. Similar interactions could be demonstrated from rendered images produced from PGRN and PSAP plaque structures from low plaque and high plaque cases (Fig.9p and Fig.9q).
Discussion
The majority of experimental and neuropathological studies of PGRN have focused on the consequences of GRN gene mutations or deletion in rodent models. Mu-tation in one GRN allele resulting in lower levels of PGRN protein is a cause of frontotemporal lobar degen-eration (FTLD) and the accompanying clinical syndrome frontotemporal dementia (FTD) [62]. As PGRN has mul-tiple cellular properties, the mechanisms that cause neu-rodegeneration have not definitively been identified. PGRN deficiencies in animal models are associated with increased neuroinflammation [17], increased synaptic pruning [21, 63], and dysregulation of lysosomal func-tion [14, 64]. The situation for PGRN in AD is different as increased levels of PGRN in AD brains measured by ELISA has been reported [19], and confirmed in this study by western blot measurements. Another study showed no significant increase in PGRN protein in frontal cortex of AD brains by western blot, but did de-tect increased levels of PGRN mRNA in these samples [34]. The overall aim of this study was to further investi-gate using human brain samples some of the features of PGRN interactions with neuropathology identified in
(See figure on previous page.)
Fig. 8 Confocal microscopy of prosaposin localization on plaques and different cell types. (a-c). Aβ (green) (a) and PSAP (red) plaque (b) with limited colocalization (C– yellow) in an AD case. Scale bar represents 30 μm. (d-f). Comparison of colocalization in plaque of PGRN (green) and Aβ (blue) (d) with PSAP (red) and Aβ (blue) in triple-stained AD section. Merged images show extensive colocalization of PGRN and PSAP (yellow) but limited overlap with Aβ-positive structures. Scale bar represents 30 μm. (G-I). Merged images of PSAP (red) immunoreactivity with microglial markers IBA-1 (g) and CD68 (h) (green) and astrocyte marker GFAP (green) show some expression of PSAP in both cell types (yellow). These images show that PSAP (red) is predominantly in cells with morphology of neurons. Scale bar represents 10μm. (j-l). Merged images of CD68 (green) and PSAP (red) on plaques in low plaque case (J), high plaque case (k) and AD case (l). Significant amounts of PSAP immunoreactivity (red) can be observed on all plaques but with only limited colocalization with CD68 in infiltrating microglia. Scale bar represents 30μm. (m-n) Merged images of AT180 (pTau) (green) and PSAP (red) on tangle in low plaque case (M), high plaque case (n) and Alzheimer’s disease case (o). Very limited amounts of PSAP immunoreactivity (yellow) can be observed on tangles. Panel M and N show intracellular tangles with DAPI-positive nuclei, while panel O shows extracellular tangle. Scale bar represents 30μm.
Fig. 9 Analysis of PGRN and PSAP colocalization on Aβ plaques in MTG tissue sections. Colocalization of PGRN and PSAP with Aβ in plaques of low plaque, high plaque and Alzheimer’s disease cases. (a-l). Images show representative images of relative patterns of immunoreactivity of PGRN (green), PSAP (red) and their colocalization with Aβ (blue) in low plaque (a-c, j), high plaque (d-f, k) and Alzheimer’s disease (g-i, l) cases. The magnification of the images is constant (scale bar represents 30μm) to show relative sizes of plaques in these disease groups. (m). Scatter plot showing relative amounts of colocalization of PGRN and PSAP as measured by Pearson’s correlation efficiency calculated using ExColocalization plug-in of Image J software (n = 9 plaques/group). Results show mean values ±S.E.M. Analysis by one-way ANOVA (* p < 0.05, ns; not significant). Value of 1 indicates complete colocalization and value of 0 indicates no colocalization. (n). Area measurements of PGRN/PSAP immunoreactive plaques in LP, HP and AD cases. Three cases/disease group and 6 plaques/case were measured. Results show mean values ±S.E.M. Significant increase in area of PGRN/PSAP associated plaques were detected in AD samples compared to HP and LP cases. Three-dimensional Imaging of PGRN-PSAP interactions in plaques. (o-q). Three-dimensional reconstruction image of merged PGRN and PSAP immunoreactive plaques in LP and AD cases of areas highlighted in panel C (LP) and K (AD) confocal images (panel O). Software modelling using mesh rendering of section of plaque (white boxes) showing close interactions of PGRN and PSAP in both LP and AD cases (yellow areas). Top view mesh rendering (P) and Side view mesh rendering (Q).