Quality of life, depression, and productivity
of city government employees in Japan : a
comparison study using the Athens insomnia
scale and insomnia severity index
著者
鷹見 将規, KADOTANI Hiroshi, NISHIKAWA Kohei,
SUMI Yukiyoshi, NAKABAYASHI Takao, FUJI
Yusuke, MATSUO Masahiro, YAMADA Naoto, The
NinJaSleep Study Group
雑誌名
Sleep Science and Practice
巻
2
号
4
ページ
1-8
発行年
2018-05-25
URL
http://hdl.handle.net/10422/00012457
doi: https://doi.org/10.1186/s41606-018-0024-0 (C)The Author(s) 2018R E S E A R C H
Open Access
Quality of life, depression, and productivity
of city government employees in Japan:
a comparison study using the Athens
insomnia scale and insomnia severity index
Masanori Takami
1, Hiroshi Kadotani
1*, Kohei Nishikawa
2, Yukiyoshi Sumi
3, Takao Nakabayashi
3, Yusuke Fujii
3,
Masahiro Matsuo
3, Naoto Yamada
3and the NinJaSleep Study Group
Abstract
Background: Insomnia has a high prevalence in modern society. Various tools have been developed to assess insomnia. We performed a direct comparison between the Insomnia Severity Index (ISI) and the Athens Insomnia Scale (AIS) in a Japanese population.
Methods: A cross-sectional questionnaire-based study was conducted in September 2017 as part of the Night in Japan Home Sleep Monitoring Study. In addition to insomnia, assessed using the AIS and ISI, depression, sleepiness, quality of life, and work performance were assessed using the Patient Health Questionnaire (PHQ)-9, a Japanese version of the Epworth Sleepiness Scale, the Short Form-8 Health Survey Questionnaire (SF-8), and the World Health Organization Health and Work Performance Questionnaire, respectively. Receiver operating characteristic (ROC) curves were constructed to compare the outcomes of the AIS and the ISI.
Results: A total of 1685 (81.9%) of all eligible employees were enrolled. The total scores of the AIS and ISI had a Pearson correlation coefficient (r) of 0.80 (p < 0.01). The area under the ROC curve for the AIS and ISI for the detection of depression (PHQ-9≥ 10) was 0.89 and 0.86, respectively. The prevalence of clinical insomnia (ISI ≥ 15) and definite insomnia (AIS≥ 10) were 6.5 and 10.8%, respectively. Both the AIS and ISI showed a weak negative correlation with the physical component summary score of the SF-8 (r = − 0.37, p < 0.01 and r = − 0.32, p < 0.01, respectively) and absolute presenteeism (r =− 0.32, p < 0.01 and r = − 0.28, p < 0.01, respectively) and a moderate negative correlation with the mental component summary score of the SF-8 (r = − 0.53, p < 0.01 and r = − 0.43, p < 0.01, respectively).
Conclusions: A strong positive correlation was found between the total scores of the AIS and ISI. Both the AIS and ISI were found to be associated with low physical and mental quality of life, depression, and productivity loss at work. Moreover, they had a moderate accuracy for detecting depression. Both the AIS and ISI may serve as useful screening tools for both insomnia and depression in the Japanese working population.
Trial registration: UMIN-CTR (UMIN000028675, registered on 2017/8/15) and ClinicalTrials.gov(NCT03276585, registered on 2017/9/3).
Keywords: Insomnia, Receiver operating characteristic, Questionnaire, Depression, Quality of life, Presenteeism
* Correspondence:[email protected]
1Department of Sleep and Behavioral Sciences, Shiga University of Medical
Science, Seta Tsukinowa-cho, Otsu City, Shiga 520-2192, Japan Full list of author information is available at the end of the article
© The Author(s). 2018 Open Access This article is distributed under the terms of the Creative Commons Attribution 4.0 International License (http://creativecommons.org/licenses/by/4.0/), which permits unrestricted use, distribution, and reproduction in any medium, provided you give appropriate credit to the original author(s) and the source, provide a link to the Creative Commons license, and indicate if changes were made. The Creative Commons Public Domain Dedication waiver (http://creativecommons.org/publicdomain/zero/1.0/) applies to the data made available in this article, unless otherwise stated.
Background
Insomnia is highly prevalent in modern society. The Insomnia Severity Index (ISI) [Bastien et al. 2001] and Athens Insomnia Scale (AIS) [Soldatos et al. 2000; Okajima et al.2013] were developed based on the stand-ard diagnostic criteria for insomnia. These tools are widely used for assessing an individual’s risk of insomnia [Lomeli et al.2008].
To date, few studies have directly compared the ISI and AIS. One meta-analysis estimated and compared the diagnostic accuracy of the ISI and AIS and found that these tools yield comparable diagnostic properties for in-somnia screening [Chiu et al. 2016]. However, this meta-analysis did not directly compare the ISI and AIS, but rather performed a comparison of sensitivity and specificity using references such as the International Classification of Sleep Disorders, Second Edition [American Academy of Sleep Medicine 2005] and the Diagnostic and Statistical Manual of Mental Disorders, Fourth Edition [American Psychiatric Association2010]. A few studies have directly compared the ISI and AIS [Jeong et al. 2015; Sierra et al. 2008; Chung et al.2011]. A strong positive correlation was found between the scores of the AIS and ISI in Korean firefighters (r = 0.85) [Jeong et al.2015] and elderly Spanish individuals (r = 0.93) [Sierra et al. 2008]. Another study used the AIS and ISI simultaneously and assessed their internal consistency, reli-ability, and validity compared to individual clinical diagno-ses [Chung et al.2011].
Prior studies have confirmed that insomnia is associ-ated with depression [Knekt et al. 2011], work product-ivity loss [Bolge et al. 2009], and reduced quality of life (QOL) [Ishak et al.2012]. Patients with insomnia report experiencing a variety of symptoms, including daytime sleepiness, fatigue, cognitive impairment, symptoms of depression and anxiety, health decrement, and impair-ment in social and occupational function [Krystal2007]. Insomnia is a frequent complaint of individuals with de-pression. Eighty five percent of patients with depression reportedly have insomnia [Sunderajan et al. 2010]. Insomnia remains the most common unresolved symptom of depression even after mood improvement by pharma-cological treatment [Ishak et al. 2012]. Research has shown that patients with insomnia have 24.2% greater work impairment (work productivity loss) and 18.0% greater activity impairment than those without insomnia [Bolge et al. 2009]. It has also been reported that the individual-level decrements in work performance caused by insomnia have a human capital value of $2280, which is equivalent to an annualized population-level estimate of $63.2 billion in the USA [Kessler et al.2011]. Clearly, im-pairments in health, function, and QOL are central fea-tures of insomnia, which can lead to significant economic burden. Therefore, diagnosing and treating insomnia
appropriately by improving the perceived health, function, and QOL of patients with this condition is essential [Krystal2007].
Significant economic and social burden is caused by depression [Global Burden of Disease Study 2013 Collaborators. 2015; Kadotani et al. 2014] and insomnia [Daley et al.2009]. Questionnaire surveys are commonly used to assess depression and insomnia in large-scale community settings or in working environments. Increasing the response rate in surveys helps minimize bias and maximize the generalizability of the findings [Blair and Zinkhan. 2006]. To this end, minimizing the length of the questionnaire was reported to significantly increase the response rate [Sahlqvist et al. 2011]. There-fore, ff a questionnaire designed to measure insomnia can also detect depression with acceptable accuracy, it may help reduce the length of the questionnaires distrib-uted in large-scale surveys and correspondingly increase the response rate.
Here, we performed a direct comparison between the ISI and AIS in a Japanese population. Both tools were ex-pected to show a similar diagnostic performance with re-spect to the health outcomes associated with insomnia.
Methods
Participants
A cross-sectional questionnaire-based study was con-ducted as part of the Night in Japan Home Sleep Monitor-ing (NinJaSleep) sleep and mental health epidemiological study. Participants were government employees of Koka city, which is a rural city in the Shiga Prefecture of Japan. Employees for whom the consent of a legal representative was required for participation or who had taken extended leaves from employment were excluded. Among the 2119 employees, 62 were excluded because of extended leaves, including sick, maternity, and childcare leaves. Thus, a total of 2057 participants were included. Questionnaires were distributed on September 6, 2017.
Questionnaires
The AIS and ISI were used to assess insomnia. Depression, sleepiness, QOL, and work performance were assessed using the Patient Health Questionnaire (PHQ)-9 [Kroenke et al. 2001; Gilbody et al.2007], a Japanese version of the Epworth Sleepiness Scale (ESS) [Johns 1991; Takegami et al. 2009], the Short Form-8 Health Survey Questionnaire (SF-8) [Ware et al.2001; Fukuhara and Suzukamo 2004], and the World Health Organization Health and Work Per-formance Questionnaire (WHO-HPQ) [Kessler et al.2003; Suzuki et al. 2014], respectively. Participants’ bedtime, sleep latency, and waking time on weekdays were also re-corded in the questionnaires.
The AIS evaluates the following eight items: AIS_1) sleep initiation; AIS_2) awakening during the night;
AIS_3) early morning awakening; AIS_4) total sleep dur-ation; AIS_5) overall QOL; AIS_6) problems with sense of well-being; AIS_7) overall functioning; and AIS_8) daytime sleepiness [Soldatos et al. 2000; Okajima et al. 2013]. The ISI examines the following seven items: ISI_1) sleep-onset; ISI_2) sleep maintenance; ISI_3) early morning awakening; ISI_4) satisfaction with current sleep pattern; ISI_5) interference with daily functioning; ISI_6) noticeability of impairment attributed to sleep problems; and ISI_7) level of distress caused by sleep problems [Bastien et al. 2001]. For the ISI, total scores of 8–14 and ≥ 15 are classified as subthreshold insomnia and clinical insomnia, respectively [Bastien et al. 2001]. Subjects with AIS scores of < 6 can be reliably consid-ered as not having insomnia [Soldatos et al. 2003]. An AIS score of 6 is the optimum cutoff based on the bal-ance between sensitivity and specificity [Soldatos et al. 2003]. Subjects with AIS scores of ≥10 are expected to be diagnosed with insomnia [Soldatos et al.2003]. Thus, we classified AIS total scores of 6–7 and ≥ 10 as sus-pected and definite insomnia, respectively.
The PHQ-9 is a reliable and valid instrument for screening individuals for major depressive disorder [Kroenke et al. 2001; Gilbody et al. 2007]. In previous studies, participants with a PHQ-9≥ 10 [Kroenke et al. 2001; Gilbody et al. 2007] were classified as having de-pression, and this same cutoff was used here. As for the ESS, in line with prior studies, a score of > 10 was con-sidered to indicate sleepiness [Johns 1991; Takegami et al. 2009]. General health-related QOL was assessed using the SF-8, which consists of eight items and is di-vided into physical component summary (PCS) and mental component summary (MCS) scores [Ware et al. 2001; Fukuhara et al. 2004]. Higher PCS and MCS scores indicate better health. In the general Japanese population, scores > 50 and those < 50 are considered above and below the average, respectively [Fukuhara et al.2004]. Here, poor physical and mental QOL were de-fined as the lowest tertiles of the PCS and MCS QOL scores from the SF-8, respectively. Productivity loss at work because of health problems is called presenteeism and this parameter can be measured using the WHO-HPQ [Kessler et al. 2003; Suzuki et al. 2014]. Absolute presenteeism in the WHO-HPQ represents ac-tual performance. In the present study, we used absolute presenteeism to assess work productivity loss.
Participants in the lowest tertile of the absolute present-eeism score in the WHO-HPQ were classified as having poor work productivity [Suzuki et al. 2014]. Regarding participants’ waking times and sleep latency, participants who woke up in the earliest tertile (before 06:00) and those in the shortest tertile for total sleep time (TST < 6 h) were classified as having early awakening and a short TST, respectively. Additionally, in adults, an onset
latency > 30 min typically has clinical significance [American Academy of Sleep Medicine 2014]; therefore, here, participants with a sleep latency > 30 min were clas-sified as having a long sleep latency.
Statistical analyses
Pearson correlation coefficient analyses were performed to determine the strength of the association between two variables. One-way analyses of variance were used to identify differences among three or more groups, and post hoc testing was performed using Scheffé’s method. Additionally, receiver operating characteristic (ROC) curve analysis was performed to compare the screening performance of the questionnaires. Pairwise comparisons of the ROC curves were performed by calculating the standard error of the area under the curve (AUC) and the difference between the two AUCs. Cohen’s kappa co-efficient was used for agreement evaluation. Statistical analyses were performed using MedCalc Version 17.9.7 (MedCalc Software, Mariakerke, Belgium). P < 0.05 was considered statistically significant.
Results
A total of 1685 (81.9%; 1685/2057) city government em-ployees had returned the questionnaires by September 30, 2017. Fifty-two of the individuals who returned the survey worked the night shift. Data were missing for six participants. Data from the remaining 1627 (79.1%: 1627/2057) participants were analyzed in this study. Table 1 and Additional file1: Figure S1 summarize the participant characteristics.
Both the AIS and ISI had moderate reproducibility (weighted kappa: 0.58). A strong positive correlation was found between the total scores of the AIS and ISI (r = 0.80, p < 0.01). The distribution of the AIS and ISI scores is
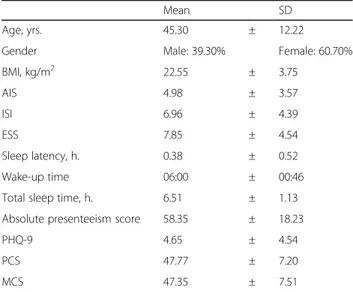
Table 1 Participant characteristics
Mean SD
Age, yrs. 45.30 ± 12.22
Gender Male: 39.30% Female: 60.70%
BMI, kg/m2 22.55 ± 3.75 AIS 4.98 ± 3.57 ISI 6.96 ± 4.39 ESS 7.85 ± 4.54 Sleep latency, h. 0.38 ± 0.52 Wake-up time 06:00 ± 00:46
Total sleep time, h. 6.51 ± 1.13 Absolute presenteeism score 58.35 ± 18.23
PHQ-9 4.65 ± 4.54
PCS 47.77 ± 7.20
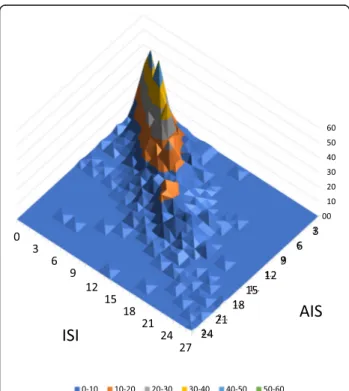
presented in Fig.1and Additional file2: Figure S2. When we compared the categories of the AIS (0–5: no patho-logical insomnia, 6–9: suspected insomnia, and 10–24: def-inite insomnia) and the ISI (0–7: no clinically significant insomnia, 8–14: subthreshold insomnia, and 15–28: clinical insomnia), the weighted kappa was 0.578 (Table 2). The prevalence of clinical insomnia (ISI≥ 15) and definite in-somnia (AIS≥ 10) in this population was 6.5 and 10.8%, respectively.
Both the AIS and ISI were associated with low physical and mental QOL, depression, and productivity loss at work (Fig. 2 and Additional file 3: Table S1). Further-more, both the AIS and ISI showed a weak negative cor-relation with the PCS (r = − 0.37, p < 0.01 and r = − 0.32, p < 0.01, respectively) and absolute presenteeism (r = − 0.32, p < 0.01 and r = − 0.28, p < 0.01, respectively) and a moder-ate negative correlation with the MCS (r = − 0.53, p < 0.01 and r = − 0.43, p < 0.01, respectively) (Additional file 3: Table S1).
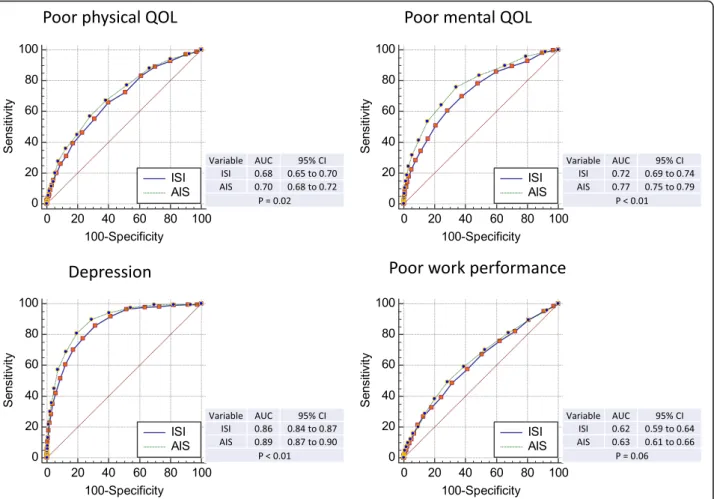
We performed ROC analyses to compare the ability of the AIS and ISI to detect poor QOL (lowest tertiles of the PCS and MCS from the SF-8), depression (PHQ-9≥ 10), and poor work performance (lowest tertile of the absolute presenteeism score in the WHO-HPQ) (Fig. 2). All the ROC curves presented in Fig. 2 had significantly high AUCs (p < 0.01, compared with AUC = 0.5), which sug-gested that the AIS and ISI can identify low physical QOL, low mental QOL, depression, and productivity loss at
work. The AIS had a significantly higher AUC than did the ISI for physical QOL, mental QOL, and depression. The AUCs to detect depression exceeded 0.85. The Pearson correlation coefficients were significantly different between the AIS and ISI compared with the PHQ-9 and MCS (Additional file4: Table S2).
Each item of the AIS was compared with the corre-sponding item of the ISI. AIS_1 and ISI_1 assess prob-lems with sleep initiation. AIS_3 and ISI_3 assess problems with early awakening (Additional file 5: figure S3). These items yielded similar AUCs (p = 0.81 compar-ing AIS_1 with ISI _1; p = 0.50 comparing AIS_3 with ISI_3) (Fig.3). AIS_4, AIS_6, and AIS_8 assess sleep dur-ation, problems with sense of well-being, and sleepiness, respectively (Additional file5: Figure S3). The scores for these items were compared with the short TST (shortest tertile < 6 h), depression (PHQ-9≥ 10), and sleepiness (ESS > 10) data, respectively. The AUCs for AIS_4, AIS_6, and AIS_8 were 0.70, 0.84, and 0.67, respectively (Fig.4).
A ROC analysis was performed using each item of the AIS and ISI as test variables with depression, poor phys-ical QOL, poor mental QOL, and poor work perform-ance as outcomes. Of these ROC analyses, only AIS_6 and AIS_7 had an AUC > 0.8 when compared with de-pression (Additional file 6: Table S3).
Discussion
In this study, the presence of insomnia and its outcomes were assessed simultaneously with the AIS and ISI in city government employees in Japan. A strong positive correl-ation was found between the AIS and ISI. Both tools were associated with QOL, depression, and productivity loss at work (Fig.1), suggesting comparable properties.
Ten percent of the general population is expected to have chronic insomnia [American Academy of Sleep Medicine 2014]. Our prevalence of clinical insomnia (ISI≥ 15: 6.5%) and definite insomnia (AIS ≥ 10.8%) may represent the prevalence of chronic insomnia in city government employees in Japan.
Major depressive disorder is commonly comorbid with insomnia [Riemann and Voderholzer,2003; Tsuno et al. 2005; Kadotani et al.2017]. Among the three outcomes
Fig. 1 Athens Insomnia Scale (AIS) and Insomnia Severity Index (ISI) three-dimensional histogramThe height (z-axis) represents the number of subjects, with the ISI and AIS scores shown in the x- and y-axis, respectively.
Table 2 AIS and ISI total scores
AIS 0–5 6–9 10–24 Total % ISI 0–7 862 141 7 1010 60.10% 8–14 174 295 92 561 33.40% 15–28 2 25 82 109 6.50% Total 1038 461 181 1680 100% % 61.80% 27.40% 10.80% 100%
The total scores of the AIS (0–5, 6–9, and 10–24) and ISI (0–7, 8–14, and 15– 28) were compared. Weighted kappa: 0.58
Fig. 2 Receiver operating characteristic (ROC) analysis of the Athens Insomnia Scale (AIS) and Insomnia Severity Index (ISI) scores and poor QOL, depression, and poor work performance. Health-related quality of life (QOL) as assessed by the Short Form-8 Health Survey Questionnaire (SF-8) was summarized into the physical continuous summary (PCS) and mental continuous summary (MCS) scores. Work performance was assessed by the absolute presenteeism score using the World Health Organization Health and Work Performance Questionnaire (WHO-WPQ). The lowest tertile of the PCS, MCS, and absolute presenteeism scores were classified as poor physical QOL, poor mental QOL, and poor work productivity, respectively. A Patient Health Questionnaire-9 (PHQ-9) score≥ 10 was classified as depression. The p values represent the pairwise comparisons for the ROC curves of the ISI and AIS
Fig. 3 Receiver operating characteristic (ROC) analysis of the Athens Insomnia Scale (AIS) and Insomnia Severity Index (ISI) scores, long sleep latency, and early waking. ISI_1, first ISI item: sleep-onset; AIS_1, first AIS item: sleep initiation; ISI_3, third ISI item: early morning awakening; AIS_3: third AIS item: early morning awakening. The p values represent the pairwise comparisons of the ROC curves of the ISI and AIS
(QOL, depression, and productivity) compared in this study, depression had the highest AUC (> 0.85; Fig. 2). This finding suggests that both the AIS and ISI had mod-erate accuracy for detecting depression in this population. AIS_6 and AIS_7 also had similar AUCs (0.84 and 0.82, respectively;p = 0.05; Additional file6: Table S3 and Add-itional file7: Figure S4). These items alone may be useful for screening for depression in the general population.
The present findings are in contrast to those of our previous study, which did not reveal an association be-tween insomnia and depression when using the Pittsburgh Sleep Quality Index and clinical interview in a different population of working Japanese men (the Pittsburgh Sleep Quality Index values in the depression and control groups were 5.58 ± 2.28 and 4.76. ± 1.97, respectively; p = 0.05) [Kadotani et al. 2017]. However, the sample size of our previous study was 314. There-fore, the use of the AIS/ISI and/or the larger sample size may have been useful in detecting depression with the AIS/ISI in this study.
The total AIS score had a significantly higher AUC for QOL and depression and had a slightly higher AUC for productivity loss than did the ISI (Fig. 2). AIS_1/ISI_1 and AIS_3/ISI_3 assess problems in sleep latency and
early morning awakening, respectively. The AUCs for these items did not show a significant difference be-tween the AIS and ISI (Fig. 3). The AIS and ISI have 8 and 7 items, respectively. Each item yielded comparable results and the total score had a higher AUC in the AIS than in the ISI. The AIS (AIS_6) assesses well-being, but the ISI does not. AIS_6 had the highest AUC among all the items of the AIS and ISI (Additional file6: Table S3). Thus, the different AUCs for the AIS and ISI total scores might have been due to the differences in the number of their items.
In the current study, five items of the AIS (AIS_1, AIS_3, AIS_4, AIS_6, and AIS_8) were compared with the outcomes related to sleep latency, early morning awakening, short TST, sleepiness, and depression (Figs.3 and 4). Two items in the ISI (ISI_1 and ISI_3) were also compared with the outcomes related to sleep latency and early morning awakening (Fig. 3). The other items in the AIS and ISI were not analyzed in this study be-cause we did not have data sources for sleep mainten-ance problems (or awakening during the night), satisfaction with current sleep patterns (or sleep quality), or distress caused by sleep problems. Daily functioning (functional capacity during the day) may be associated
Fig. 4 Receiver operating characteristic (ROC) analysis of the Athens Insomnia Scale (AIS) item scores for the comparison of short sleep duration and sleepiness. AIS_4, fourth AIS item: total sleep duration; AIS_6, sixth AIS item: problems with sense of well-being; AIS_8, eighth AIS item: sleepiness during the day
with QOL; however, the SF-8 can only yield physical and mental summary scores, not a total summary score.
Our results showed that AIS_3 and ISI_3 were not as-sociated with early awakening (earliest tertile of awaken-ing time; Fig. 3). The earliest tertile of awakening time may not have been a suitable outcome for the compari-son. The cutoff threshold using the tertile was earlier than 6:00 am, whereas the mean awakening time was 6:00 am (Table1). We used this cutoff value because we used tertiles for most of the outcomes in this study. However, the awakening time or awakening time tertile may not have been suitable for detecting problems with early awakening.
This study had some limitations. First, our participants were city government employees in Japan. Therefore, while they may share similarities with the general popu-lation of their particular city, they may not have been representative of the general Japanese population. Second, this study used only questionnaire data; no ob-jective data or clinical diagnoses were used. Although we plan to perform portable electroencephalography [Matsuo et al.2016] and sleep respiratory monitoring to analyze sleep apnea in this population (NinJaSleep Study), such data were not collected in the present study. Finally, this was a cross-sectional study; thus, we could not show a causal relationship. We plan to con-duct a longitudinal study in this population to further investigate this relationship.
Conclusions
The AIS and ISI were simultaneously administered to as-sess insomnia and its outcomes in Japanese city govern-ment employees. Both the AIS and ISI were associated with a low physical and mental QOL, depression, and productivity loss at work. A strong positive correlation was found between the total scores of the AIS and ISI. Moreover, the AIS, ISI, AIS_6, and AIS_7 showed a mod-erate accuracy for detecting depression in this population. Both the AIS and ISI may be useful for screening Japanese workers for not only insomnia, but also depression.
Additional files
Additional file 1:Figure S1. Histograms of participant characteristics. (PPTX 79 kb)
Additional file 2:Figure S2. Distribution of the Athens Insomnia Scale (AIS) and Insomnia Severity Index (ISI). The numbers represent the count in each bin. (PPTX 119 kb)
Additional file 3:Table S1. Pearson correlation coefficients (r) for the physical continuous summary (PCS), mental continuous summary (MCS), absolute presenteeism, Athens Insomnia Scale (AIS) and Insomnia Severity Index (ISI). (PPTX 40 kb)
Additional file 4:Table S2. Comparison of correlation coefficients. The Pearson correlation coefficients were compared with the Athens Insomnia Scale (AIS) and Insomnia Severity Index (ISI) scores. (PPTX 40 kb)
Additional file 5:Figure S3. Athens Insomnia Scale (AIS) and Insomnia Severity Index (ISI) items compared with sleep latency, wake-up time, total sleep time (TST), Patient Health Questionnaire-9 (PHQ-9), and Epworth Sleepiness Scale (ESS). A, b, c, d, and e representp < 0.05 against scores in 0, 1, 2, 3, and 4, respectively, of the AIS and ISI items using one-way analysis of variance. (PPTX 69 kb)
Additional file 6:Table S3. Receiver operating characteristic (ROC) analysis of the Athens Insomnia Scale (AIS) and Insomnia Severity Index (ISI) items compared with depression. The eight items from the AIS (from AIS_1 to AIS_8) and 7 items from the ISI (from ISI_1 to ISI_7) were compared with depression. A Patient Health Questionnaire-9 (PHQ-9) score≥ 10 was classified as depression. (PPTX 42 kb)
Additional file 7:Figure S4. Receiver operating characteristic analysis of the sixth and seventh items of the Athens Insomnia Scale (AIS) compared with depression. (PPTX 42 kb)
Abbreviations
AIS:Athens Insomnia Scale; AUC: Area under the receiver operating characteristic curve; BMI: Body mass index; ESS: Epworth Sleepiness Scale; ISI: Insomnia Severity Index; MCS: Mental continuous summary; PCS: Physical continuous summary; PHQ-9: Patient Health Questionnaire-9; QOL: Quality of life; ROC: Receiver operating characteristic; SD: Standard deviation; SF-8: Short Form-8 Health Survey Questionnaire; TST: Total sleep time; WHO-HPQ: World Health Organization Health and Work Performance Questionnaire
Acknowledgments
We express gratitude to the participants of Koka City. We thank T Toyoda, R Matsumoto, A Toguchi, and H Nakayama for their assistance with data collection. We would like to thank Editage (www.editage.jp) for English language editing. The complete list of collaborators in the NinJaSleep Study is as follows: Hiroshi Kadotani, Masanori Takami, and Taeko Toyoda (Department of Sleep and Behavioral Sciences); Yukiyoshi Sumi and Masahiro Matsuo (Department of Psychiatry), and Hitoshi Nakayama (Koka City).
Funding
The present study was supported by MEXT/JSPS (KAKENHI Grant Number: 17H00872), MEXT Program for Building Regional Innovation Ecosystems, and a grant from the Investigator-Initiated Studies Program of Merck Sharp & Dohme Corp./MSD K.K.
Availability of data and materials
The datasets analyzed in the current study are available from the corresponding author upon reasonable request. The study protocol is registered in UMIN-CTR (UMIN000028675) andClinicalTrials.gov(NCT03276585).
Authors’ contributions
HK conceived and designed the study and drafted the manuscript. HK was responsible for data collection. HK and MM performed the statistical analyses and interpreted the data. MT and YS assisted in manuscript drafting. MT, KN, YS, TN, YF, MM, and NY provided input on the manuscript drafts and assisted with data interpretation. All authors read and approved the final manuscript.
Ethics approval and consent to participate
The Ethics Committee of the Shiga University of Medical Science approved this study protocol (27–56). Informed consent was obtained from each participant prior to participation.
Competing interests
HK’s laboratory is supported by a donation from Fukuda Lifetech Co., Ltd., Fukuda Life Tech Keiji Co., Ltd., Tanaka Sleep Clinic, Akita Sleep Clinic, and Ai Ai Care Co., Ltd. to the Shiga University of Medical Science. HK received grants from MEXT/JSPS (KAKENHI Grant Number: 17H00872), MEXT (Program for Building Regional Innovation Ecosystems), and Merck Sharp & Dohme Corp./MSD K.K. (the Investigator-Initiated Studies Program). The opinions expressed in this paper are those of the authors and do not necessarily represent those of Merck Sharp & Dohme Corp./MSD K.K. The other authors have no conflicts of interest directly relevant to the content of this article.
Publisher’s Note
Springer Nature remains neutral with regard to jurisdictional claims in published maps and institutional affiliations.
Author details
1Department of Sleep and Behavioral Sciences, Shiga University of Medical
Science, Seta Tsukinowa-cho, Otsu City, Shiga 520-2192, Japan.2Shiga CBT
center, 3-12 Chuou-cho, Hikone 522-0063, Japan.3Department of Psychiatry, Shiga University of Medical Science, Seta Tsukinowa-cho, Otsu City, Shiga 520-2192, Japan.
Received: 9 February 2018 Accepted: 16 May 2018
References
American Academy of Sleep Medicine. The international classification of sleep disorders: diagnostic and coding manual. 2nd ed. Westchester, IL: American Academy of Sleep Medicine; 2005.
American Academy of Sleep Medicine. The international classification of sleep disorders. 3rd ed. Darien, IL: American Academy of Sleep Medicine; 2014. American Psychiatric Association. Diagnostic and statistical manual of mental disorders. 4th ed. Washington, DC: American Psychiatric Publishing; 2010. Bastien CH, Vallières A, Morin CM. Validation of the insomnia severity index as an
outcome measure for insomnia research. Sleep Med. 2001;2:297–307. Blair E, Zinkhan GM. Nonresponse and generalizability in academic research. J
Acad Marketing Sci. 2006;34:4–7.https://doi.org/10.1177/0092070305283778. Bolge SC, Doan JF, Kannan H, Baran RW. Association of insomnia with quality of life, work productivity, and activity impairment. Qual Life Res. 2009;https:// doi.org/10.1007/s11136-009-9462-6.
Chiu HY, Chang LY, Hsieh YJ, Tsai PS. A meta-analysis of diagnostic accuracy of three screening tools for insomnia. J Psychosom Res. 2016;https://doi.org/10. 1016/j.jpsychores. 2016.06.010.
Chung KF, Kan KK, Yeung WF. Assessing insomnia in adolescents: comparison of insomnia severity index, Athens insomnia scale and sleep quality index. Sleep Med. 2011;https://doi.org/10.1016/j.sleep.2010.09.019.
Daley M, Morin CM, LeBlanc M, Gregoire JP, Savard J. The economic burden of insomnia: direct and indirect costs for individuals with insomnia syndrome, insomnia symptoms. and good sleepers Sleep. 2009;32:55–64.
Fukuhara S, Suzukamo Y. Manual of the SF-8 Japanese version (in Japanese). Kyoto: Institute for Health Outcomes and Process Evaluation Research; 2004. Gilbody S, Richards D, Brealey S, Hewitt C. Screening for depression in medical
settings with the patient health questionnaire (PHQ): a diagnostic meta-analysis. J Gen Intern Med. 2007;22:1596–602.
Global Burden of Disease Study 2013 Collaborators. Global, regional, and national incidence, prevalence, and years lived with disability for 301 acute and chronic diseases and injuries in 188 countries, 1990-2013: a systematic analysis for the global burden of disease study 2013. Lancet. 2015;386:743– 800.https://doi.org/10.1016/S0140-6736(15)60692-4.
Ishak WW, Bagot K, Thomas S, Magakian N, Bedwani D, Larson D, et al. Quality of life in patients suffering from insomnia. Innov Clin Neurosci. 2012;9:13–26. Jeong HS, Jeon Y, Ma J, Choi Y, Ban S, Lee S, et al. Validation of the Athens insomnia
scale for screening insomnia in south Korean firefighters and rescue workers. Qual Life Res. 2015;https://doi.org/10.1007/s11136-015-0986-7.
Johns MW. A new method for measuring daytime sleepiness: the Epworth sleepiness scale. Sleep. 1991;14:540–5.
Kadotani H, Nagai Y, Sozu T. Railway suicide attempts are associated with amount of sunlight in recent days. J Affect Disord. 2014;https://doi.org/10. 1016/j.jad.2013.08.040.
Kadotani T, Kadotani H, Arai H, Takami M, Ito H, Matsuo M, et al. Comparison of self-reported scales and structured interviews for the assessment of depression in an urban male working population in Japan: a cross-sectional survey. Sleep Sci Practice. 2017;1:9.https://doi.org/10.1186/s41606-017-0010-y.
Kessler RC, Barber C, Beck A, Berglund P, Cleary PD, McKenas D, et al. The World Health Organization health and work performance questionnaire (HPQ). J Occup Environ Med. 2003;45:156–74.
Kessler RC, Berglund PA, Coulouvrat C, Hajak G, Roth T, Shahly V, et al. Insomnia and the performance of US workers: results from the America insomnia survey. Sleep. 2011;https://doi.org/10.5665/SLEEP.1230.
Knekt P, Lindfors O, Renlund C, Sares-Jäske L, Laaksonen MA, Virtala E. Use of auxiliary psychiatric treatment during a 5-year follow-up among patients
receiving short- or long-term psychotherapy. J Affect Disord. 2011;https:// doi.org/10.1016/j.jad.2011.07.024.
Kroenke K, Spitzer RL, Williams JB. The PHQ-9: validity of a brief depression severity measure. J Gen Intern Med. 2001;16:606–13.
Krystal AD. Treating the health, quality of life, and functional impairments in insomnia. J Clin Sleep Med. 2007;3:63–72.
Lomeli HA, Pérez-Olmos I, Talero-Gutiérrez C, Moreno CB, González-Reyes R, Palacios L, et al. Sleep evaluation scales and questionnaires: a review. Actas Esp Psiquiatr. 2008;36:50–9.
Matsuo M, Masuda F, Sumi Y, Takahashi M, Yamada N, Ohira MH, et al. Comparisons of portable sleep monitors of different modalities: potential as naturalistic sleep recorders. Front Neurol. 2016;https://doi.org/10.3389/fneur.2016.00110. Okajima I, Nakajima S, Kobayashi M, Inoue Y. Development and validation of the
Japanese version of the Athens insomnia scale. Psychiatry Clin Neurosci. 2013;https://doi.org/10.1111/pcn.12073.
Riemann D, Voderholzer U. Primary insomnia: a risk factor to develop depression? J Affect Disord. 2003;76:255–9.
Sahlqvist S, Song Y, Bull F, Adams E, Preston J, Ogilvie D. iConnect consortium. Effect of questionnaire length, personalisation and reminder type on response rate to a complex postal survey: randomised controlled trial. BMC Med Res Methodol. 2011;11:62.https://doi.org/10.1186/1471-2288-11-62.
Sierra JC, Guillén-Serrano V, Santos-Iglesias P. Insomnia severity index: some indicators about its reliability and validity on an older adults sample (in Spanish). Rev Neurol. 2008;47:566–70.
Soldatos CR, Dikeos DG, Paparrigopoulos TJ. Athens insomnia scale: validation of an instrument based on ICD-10 criteria. J Psychosom Res. 2000;48:555–60. Soldatos CR, Dikeos DG, Paparrigopoulos TJ. The diagnostic validity of the Athens
insomnia scale. J Psychosom Res. 2003;55:263–7.
Sunderajan P, Gaynes BN, Wisniewski SR, Miyahara S, Fava M, Akingbala F, et al. Insomnia in patients with depression: a STAR*D report. CNS Spectr. 2010;15:394–404. Suzuki T, Miyaki K, Sasaki Y, Song Y, Tsutsumi A, Kawakami N, et al. Optimal cutoff
values of WHO-HPQ presenteeism scores by ROC analysis for preventing mental sickness absence in Japanese prospective cohort. PLoS One. 2014;
https://doi.org/10.1371/journal.pone.0111191.
Takegami M, Suzukamo Y, Wakita T, Noguchi H, Chin K, Kadotani H, et al. Development of a Japanese version of the Epworth sleepiness scale (JESS) based on item response theory. Sleep Med. 2009;https://doi.org/10.1016/j. sleep.2008.04.015.
Tsuno N, Besset A, Ritchie K. Sleep and depression. J Clin Psychiatry. 2005;66: 1254–69.
Ware JE, Kosinski M, Dewey JE, Gandek B. How to score and interpret single-item health status measures: a manual for users of the SF-8 health survey. Lincoln, RI: QualityMetric Incorporated; 2001.