DISCUSSION PAPER No.114
Buyers, Suppliers, and R&D Spillovers
(企業間の取引関係と R&D スピルオーバー)
2015 年 4 月
文部科学省 科学技術・学術政策研究所
第1研究グループ
池内 健太 René Belderbos 深尾 京司
金 榮愨 権 赫旭
本 DISCUSSION PAPER は、文部科学省科学技術・学術政策研究所が、一橋大学及び経済産業 研究所との共同研究の一部の成果をまとめたものであり、所内での討論に用いるとともに、関係の 方々からのご意見をいただくことを目的に作成したものである。
また、本 DISCUSSION PAPER の内容は、執筆者の見解に基づいてまとめられたものであり、機
関の公式の見解を示すものではないことに留意されたい。
本報告書の引用を行う際には、出典を明記願います。
DISCUSSION PAPER No.114 Buyers, Suppliers, and R&D Spillovers
Kenta Ikeuchi, René Belderbos, Kyoji Fukao, Young Gak Kim, and Hyeog Ug Kwon April 2015
1s t Theory-Oriented Research Group
National Institute of Science and Technology Policy (NISTEP) Ministry of Education, Culture, Sports, Science and Technology (MEXT)
企業間の取引関係と
R&Dスピルオーバー
文部科学省 科学技術・学術政策研究所 第1研究グループ 池内 健太 René Belderbos 深尾 京司 金 榮愨 権 赫旭 要旨 研究開発(R&D)スピルオーバーと生産性に関する先行研究では、技術的近接性と地理的近 接性の役割に比べて、取引関係の役割はこれまであまり注目されてこなかっ た。そこで本研究では、
企業の個々の供給企業と顧客企業が識別できるユニークなデータを、『工業統計調査』及び『科学技 術研究調査』に接合したデータを用いて、日本の製造業における取引関係を通じた R&D スピルオー バー効果を分析する。本研究では、2 万を超える工場のミクロデータを用いた分析を行い、次のような 点を明らかにした。第 1 に、顧客企業や供給企業の R&D ストックは企業の工場レベルの生産性を高 める効果を持ち、その効果は技術的な近接性や地理的な近接性による R&D スピルオーバー効果に 比べて大きいことがわかった。第 2に、取引先企業との間に資本関係があるとさらにその効果は大きく なることもわかった。第 3 に、技術的な近接性に基づく R&D スピルオーバー効果は地理的な距離が 遠くなると次第に小さくなるが、取引先からのスピルオーバーの場合は地理的な距離の影響を受けな いこともわかった。これらの結果は、取引関係に基づくスピルオーバーはR&Dの生産性に対する効果
やR&Dの社会的なリターンの大きさを決める重要な要素となっている可能性を示唆している。
Buyers, Suppliers, and R&D Spillovers
Kenta Ikeuchi, René Belderbos, Kyoji Fukao, Young Gak Kim, and H yeo g Ug Kwon, First Theory-Oriented Research Group, National Institute of Science and Technology P olicy (NISTEP ) ABSTR ACT The role of bu yers and suppliers has received little attention in the literature on research and developme nt (R&D) spillovers and productivity, which has focused primarily on the moderating roles of technological and geographic proximity. In this stud y, we examine R&D spillovers that result from bu yer and supplier relationships at the transaction level, utiliz ing a unique dataset identifying individual bu yers and suppliers of Japanese manufacturing firms, matched with data from R&D surve ys and the Census of Manufacturers. In an analysis of more than 20,000 Japanese manufacturing plants, we find that R&D stocks of bu yers and suppliers provide a substantial productivity performance premiu m over and above the effect of technologically and geographically proximate R&D stocks. These effect s are magnified if the supplier and bu yer have business group ties based on capital ownership relationships. While the effects of technologically proxima te R&D decay with distance, this is not the case for spillo vers from bu yers and suppliers. Our results identify transaction-based spillove rs as a key influence on productivity and social returns to R&D.
i
‐概 要‐
背景・目的
企業の研究開発(R&D)は当該企業自身の生産性の上昇に寄与するのみでなく、様々な経路を 通じて他社の生産性にも影響すると言われており、この現象は「R&Dスピルオーバー」と呼ばれ る。これまで R&Dスピルオーバーが生産性に与える効果に関する先行研究においては、技術的 近接性と地理的近接性の役割が主に注目され、多くの実証分析も行われてきた(例えば、Adams and Jaffe 1996)。それに対して、取引関係の役割は産業連関表を用いた集計レベルのデータに基づく 分析等(例えば、Goto and Suzuki 1989)に限定され、これまで詳細な分析があまりされてこなか った。一方、海外直接投資(Foreign Direct Investments: FDI)に関する先行研究では、国際的企業 の進出から地元の企業への知識のスピルオーバーにおいて、財・サービスの取引関係が重要な経 路であることが指摘されている(例えば、Haskel他 2007)。つまり、生産性の高い海外企業と直 接取引を持った地元の原材料や部品、中間サービスの供給者のパフォーマンスが上昇することが 多くの先行研究で確認されている。
また、欧州のイノベーション調査(Community Innovation Survey: CIS)を用いたいくつかの先 行研究においても顧客や供給者から得た情報やそれら企業との協力関係が企業の生産性にとっ て重要であることが指摘されている(例えば、Belderbos他2012)。しかし、これらCISのデータ を用いた研究は、個々の企業が実際にどの企業と取引関係を持っているかについては、分析され ていない。そのため、これらの先行研究では、取引関係の有無やタイプによって R&Dスピルオ ーバーの大きさがどの程度異なるか定量的に明らかになっていない。
そこで、本研究では、日本の製造業企業における個々の供給企業と顧客企業が識別できるユニ ークなデータを『工業統計調査』及び『科学技術研究調査』と接合したデータを用いて、取引関 係を通じた R&D スピルオーバー効果を定量的に分析する。また、取引関係がない場合の技術的 な近接性や地理的な近接性を通じた企業間の R&D スピルオーバーと取引関係を通じたスピルオ ーバーが生産性に与える効果の大きさを定量的に比較するとともに、取引関係の有無によって企 業間の距離の効果がどのように変化するかについても分析を行う。
データ・分析方法
本研究では個別企業の主要な取引先企業(顧客及び原材料や部品等の供給者)に関する詳細な 企業情報が収録された『TSR企業相関ファイル』(東京商工リサーチ)1を『工業統計調査』(経済
1本研究で用いた『TSR企業相関ファイル』(東京商工リサーチ)は、経済産業研究所(RIETI) から提供を受けたデータである。
ii
産業省)及び『科学技術研究調査』(総務省)と企業レベルで接合したデータを用いて分析する。
『TSR企業相関ファイル』は企業ごとの主要な顧客企業と仕入先企業の企業コードを収録したデ ータベースであり、このデータを用いることによって、個々の取引関係のレベルで企業間の取引 ネットワークが捉えられる。さらに、『TSR企業相関ファイル』は取引関係のみならず当該企業の 主要株主となっている企業のコードも収録しているため、企業間の資本関係のネットワークも詳 細に把握することができる。
分析対象は、製造業に属する企業であり、2006年の各企業の取引関係及びR&Dがその企業が 有する工場の2007年の生産性にどのような影響をもたらすかを分析する。分析の手順は以下の通 りである。まず、『工業統計調査』の個票データを用いて、工場レベルの全要素生産性(Total Factor
Productivity: TFP)を計測する。工場レベルのデータを企業レベルで名寄せした後、『科学技術研
究調査』の個票データを企業レベルで接合することにより、各工場が所属する企業の R&D を特 定する。他方、『科学技術研究調査』の個票データを用いて、各企業のR&Dストックを推計した 上で(陳腐化率は『民間企業の研究開発に関する調査』(NISTEP)のデータを参照し、ラグは1 年と仮定した)、『TSR企業相関ファイル』に企業レベルで接合し、各企業の主要顧客企業のR&D ストックや主要な仕入先企業(供給企業)のR&Dストックを特定する。同様に、『TSR企業相関 ファイル』の主要株主企業のデータを用いて、各企業の主要な顧客企業や仕入先企業のうち、資 本関係がある企業のR&Dと資本関係がない企業のR&Dストックについてもそれぞれ特定する。
これらのデータ処理の結果、最終的には約1万2千社の企業が所有する約2万の工場のデータ が分析対象となった。最後に、このデータを用いて、工場レベルのTFPを従属変数とし、所属す
る企業のR&Dに加えて、主要顧客企業のR&D、主要仕入先企業のR&D、取引関係のない企業の
R&D等を説明変数とする回帰分析を行う。なお、本研究では、企業間のR&Dスピルオーバーに
よる生産性に与える効果が企業間の関係性(取引関係の有無やタイプ、資本関係の有無)によっ てどの程度異なるかを表すパラメータを直接推定することにより、R&Dスピルオーバー効果が企 業間の関係性のタイプによってどのように変化するかを定量的に明らかにする。また、企業間の 技術的近接性と地理的近接性がR&Dスピルオーバーの強さに与える効果も同時に推定するため、
非線形回帰分析を適用する。
本研究の分析結果とその政策的含意
本研究で得られた主な分析結果は次の3点である。
1.顧客企業や供給企業のR&Dストックは企業の工場レベルの生産性を高める効果を持ち、
その効果は技術的な近接性や地理的な近接性によるR&Dスピルオーバー効果に比べても 非常に大きい(概要図表 1)。
2.取引先企業との間に資本関係があるとさらにR&Dスピルオーバー効果は大きくなる(概 要図表 1)。
iii
3.技術的な近接性に基づくR&Dスピルオーバー効果は地理的な距離が遠くなると次第に小 さくなるが、取引先からのスピルオーバーの場合は地理的な距離の影響を受けない。
これらの結果は、取引関係に基づくスピルオーバーはR&Dの生産性に対する効果やR&Dの社 会的なリターンの大きさを決める重要な要素となっている可能性を示している。
したがって、政府が補助金や税額控除などの制度を用いて企業の R&Dを助成する際には、多 くの顧客企業や供給企業を有する企業、すなわち企業間取引ネットワークのハブになっている企
業の R&Dを助成することでより経済効果が大きくなることが示唆される。また、国内の企業間
の取引ネットワークの密度が高いほど、国内で企業の R&D を促進するような政策の効果が高い ことも示唆される。その一方、海外の企業との取引関係・資本関係が国際的な R&Dスピルオー バー効果の大きさにおいても重要な影響を持つことも示唆されるが、国際的な R&Dスピルオー バーの効果の詳細な把握と定量的な分析は今後の課題である。
概要図表 1:知識源との取引関係・資本関係別
R&Dスピルオーバーの相対的な強さ
注)取引関係がない他企業のR&Dからのスピルオーバー効果を1とした相対値。
参考文献
Adam, J. D. and A. B. Jaffe (1996) “Bounding the Effects of R&D: An Investigation Using Matched Establish-Firm Data,” RAND Journal of Economics, 27, pp.700-721.
Belderbos, R., B. Lokshin and M. Carree (2004), R&D cooperation and firm performance, Research Policy, 33(10), 1477-1492.
Goto, A. & Suzuki, K., 1989. R&D Capital, Rate of Return on R&D Investment and Spillover of R&D in Japanese Manufacturing Industries. Review of Economics and Statistics, 71, pp.555-564.
1.0
46.5
2.9 2.5 1.9
0 5 10 15 20 25 30 35 40 45 50
主要株主 主要株主以外 主要株主 主要株主以外 取引関係なし 仕入先企業 顧客企業
iv
Haskel, J., Pereira, S. & Slaughter, M., 2007. Does Inward Foreign Investment Boost the Productivity of Domestic Firms? The Review of Economics and Statistics, 89(3), pp.482-496.
‐本 編(英語)‐
1
Buyers, Suppliers, and R&D Spillovers
*Kenta Ikeuchi NISTEP René Belderbos
University of Leuven, UNU-MERIT, Maastricht University, and NISTEP Kyoji Fukao
Hitotsubashi University, NISTEP, and RIETI Young Gak Kim
Senshu University and NISTEP Hyeog Ug Kwon
Nihon University, NISTEP, and RIETI
Keywords: productivity, location, R&D, spillovers JEL codes: D24, O32.
1. INTRODUCTION
The extant literature on R&D spillovers and social returns to R&D has largely focused on the attenuating roles of geographic and technological distance between firms (Jaffe et al., 1993;
Adams and Jaffe, 1996; Aldieri and Cincera, 2009; Lychagin et al., 2010; Bloom et al., 2013;
Orlando, 2004; Griffith et al., 2009; Mairesse and Mulkay, 2008). These studies examine the productivity effects of ‘pure’ knowledge spillovers due to the partial public good nature of knowledge, independent of any transactions between firms. Much less attention has been given in this literature to ‘transaction based’ R&D spillovers that result from buyer and supplier relationships and how they influence productivity growth. A separate stream of literature on the role of spillovers in the context of foreign direct investments has, however, suggested that 'vertical' spillovers through buyer-supplier relationships is often a key channel through which
* This paper is the result of a joint research project of the National Institute of Science and Technology Policy (NISTEP) and the Research Institute for Economy, Trade and Industry (RIETI) under the “Science for Science, Technology and Innovation Policy” program. René Belderbos gratefully acknowledges financial support from NISTEP, and the Centre for Economic Institutions and the Joint Usage and Research Center (Fiscal 2014 Project Research Program) at the Institute of Economic Research, Hitotsubashi University.
2
spillovers due to multinational firms’ investments in local firms occur (e.g. Haskel et al., 2007;
Görg and Strobl, 2001; Javorcik, 2004; Kugler, 2006). Similarly, research based on community innovation surveys regarding the sources of knowledge for the effective innovation of firms has demonstrated the relative frequency and importance of knowledge originating from buyers and suppliers as opposed to firms in the same industry (e.g. Belderbos, Carree, and Lokshin, 2004;
Belderbos, Gilsing, and Lokshin, 2012; Crespi et al., 2008).
In this study, we examine the relative importance of R&D spillovers from buyers and suppliers as compared with R&D spillovers from geographically and technologically proximate firms. In contrast to prior work that has made use of input-output tables to establish indicators of
‘relational proximity’ (e.g. Goto and Suzuki, 1989) we identify the presence of actual transaction relationships between pairs of firms by utilizing a unique dataset identifying the major individual buyers and suppliers of Japanese manufacturing firms in 2006 as well as capital ties between the firms. We match this data with plant-level micro data drawn from the census of manufacturers and Japan’s comprehensive R&D survey to analyse plant-level total factor productivity in relationship with firms’ own R&D stock, geographically and technologically distributed R&D stocks of the population of other firms in Japan, and the R&D stocks of the firms suppliers and buyers. The R&D survey data in combination with the census data allows us to construct relevant R&D stocks weighted by technological proximity between industries (e.g. Bloom et al., 2013), while the information on plant locations allows us to explore the role of geographic distance between firms. We utilize data on bilateral buyer-supplier linkages in the database compiled by Tokyo Shoko Research (TSR, 2006) and can examine the relationship with productivity for more than 20,000 manufacturing plants. We adopt the standard knowledge stock augmented production function framework (e.g. Hall et al., 2012). We identify distance effects by estimating exponential decay parameters for plant-level R&D stocks (e.g. Lychagin et al., 2010; Duranton and Overman, 2005). Our key research objectives are to 1) establish the role of R&D spillovers through buyer and supplier linkages – with and without capital relationships with the focal firm – in comparison with the influence of general spillovers due to geographic and technological proximity, and 2) to assess the (reduced) effect of geographic distance on the magnitude of spillovers in cases in which there is an established buyer-supplier relationship.
3
We note that knowledge spillovers in buyer-supplier relationships will have purposeful and pecuniary elements. First, since knowledge usually has important tacit and non-codified elements and is costly to transfer (e.g. Teece, 1977; Feldman and Lichtenberg, 1998), buyer or supplier interactions between firms are likely to aid information flows and may assist in effective knowledge spillovers or purposeful knowledge transfers. Second, to the extent that knowledge due to suppliers is embedded in intermediate inputs, its value tends not to be fully reflected in the price of such intermediates, leading to ‘pecuniary’ or rent spillovers due to transactions with suppliers (Hall et al., 2012; Crespi et al., 2008).1 In this case, productivity increases on the part of the clients do not necessarily represent technological advances or externalities. Belderbos and Mohnen (2013) argue that productivity-enhancing effects of pecuniary spillovers are hard to dissociate from spillover effects. Tacit knowledge flows may occur in addition to the rent generating effects of the input supplied. Firms utilizing the higher quality, technology-embodied inputs will often have to adapt technologies and processes to optimize the use of these inputs, creating productivity benefits, and potentially providing technological opportunities for further productivity improvement. Hence, pecuniary spillovers will often incorporate or be correlated with elements of ‘pure’ knowledge spillovers and technological advances in the downstream industry. Compared with ‘horizontal’ spillovers within narrowly defined industries among firms in technological proximity of one another, the absence of market rivalry provides greater incentives for productivity and growth enhancing knowledge exchange and spillovers through supplier-buyer relationships (e.g. Bloom et al., 2013). Studies demonstrating a positive relationship between knowledge originating with suppliers and firm innovation performance attest to this (e.g. Belderbos, Carree, and Lokshin, 2004; Belderbos and Grimpe, 2012). In the current study, we are unable to disentangle rent spillover from knowledge spillover effects in buyer-supplier relationships. We do disentangle technological proximity and ‘relational’
proximity effects by identifying (plants of) individual buyers and suppliers, their industries, and their geographic proximity to the focal firm’s plants.
1We note that rent spillovers are unlikely to be a feature of customer-originating spillovers. The role of pecuniary spillovers due to mispricing are less likely to play a role or to play a different role: quality improvements may be less reflected in the price of the intermediate inputs, as sophisticated, demanding users providing guidance on specifications and standards are probably able to negotiate input prices downwards. Any productivity improvement due to customer interaction is therefore most likely to reflect improved quality of products and processes.
4
Our study relates to a limited set of papers examining productivity effects of supplier and buyer relationships. Crespi et al. use direct measures of knowledge flows as they are revealed in U.K.
innovation surveys to establish a relationship with Total Factor Productivity (TFP). They find that knowledge spillovers from competitors and suppliers contribute to TFP growth and complement intra-firm technology transfers. Belderbos and Grimpe (2012), using German innovation survey data, find positive productivity effects of knowledge flows from domestic customers and competitors. These studies did not identify specific buyers or suppliers and the R&D conducted or not. A recent exception is the study by Isaksson, Simeth, and Seifert (2014), which examines the relationship between firms’ patent productivity and the patent productivity of major buyers for 192 supplying firms in the U.S. They find positive buyer effects in particular if the buyer relationship is long lasting. Another exception is Todo et al. (2015), who examine the effects of buyer-supplier networks on firms’ productivity and innovative capability (measured by the number of patent applications), focusing on the role of geographic proximity. They find positive effects of the number of distant suppliers and neighbouring clients on productivity and positive effects of the number of distant suppliers and clients on innovative capability. However, Todo et al. (2015) do not examine the effects of spillovers from external knowledge sources captured by R&D investment or patent stock outside the firm. Earlier work on R&D and productivity in business groups also identified individual firms, but has been limited to identified, publicly listed firms with business group ties. Suzuki (1993) and Branstetter (2000) find positive effects on productivity growth of R&D stocks when there are related firms in the Japanese business group, and they attribute this to intra-group knowledge sharing and stable supply relationships (Belderbos, Wakasugi, and Zou, 2012).
Our study is the first to provide direct evidence on the relationship between productivity and R&D investments of both individual buyers and suppliers. We find that R&D stocks of buyers and suppliers provide a substantial productivity performance premium over and above the effect of technologically and geographically proximate R&D stocks. These effects are magnified if the supplier and buyer have capital ties. While the effects of technologically proximate R&D decay with distance, this is not the case for spillovers from buyer and supplier plants. While distance is likely to affect the likelihood that transaction relationships occur, as exemplified by
5
geographically concentrated buyer and supplier plants, given that transactions take place, distance no longer attenuates knowledge spillovers. Our results identify transaction-based spillovers as key influences on productivity and social returns to R&D.
2. MODEL AND FRAMEWORK
We conduct a plant-level panel analysis of total factor productivity, in which we relate plant-level TFP to R&D spillover pools, and in particular R&D stocks of the individual suppliers and buyers of the firm that operates the plant. The models include firms’ own R&D stock and a set of plant-, firm-, and industry-level controls. We assume that firm-level R&D stocks are available to all the firms’ plants and that R&D spillovers occur between plants due to the R&D stock to which the plants have access. This allows us to investigate the geographic dimension of R&D spillovers in detail, taking into account the population of R&D-conducting firms in Japan, the plants of individual suppliers and customers, and the spatial configuration of these plants.
We adopt the standard knowledge stock augmented production function framework (e.g. Hall et al., 2012). We define the production function of plant i operated by firm j as:
𝑄𝑖 = 𝑓(𝐿𝑖,𝐾𝑖,𝑀𝑖)𝑔�𝑅𝑓𝑖,𝑆𝑖, X𝑖�𝑈𝑖 (1)
where:
𝑄𝑖: Gross output of plant 𝑖
𝐿𝑖,𝐾𝑖,𝑀𝑖: Inputs of plant 𝑖 in year 𝑡
𝑅𝑓𝑖: Firm-level R&D stock available to plant 𝑖 (𝑓𝑖 denotes the firm plant 𝑖 belongs to) 𝑆𝑖: R&D spillover pool due to all other plants in Japan
X𝑖: a vector of observable firm and plant-level variables affecting plant productivity 𝑈𝑖: plant-year specific unobserved efficiency influences
Total factor productivity (TFP) is defined as:
𝑇𝑇𝑇𝑖 ≡𝑓(𝐿 𝑄𝑖
𝑖,𝐾𝑖,𝑀𝑖)=𝑔�𝑅𝑓𝑖,𝑆𝑖,𝐗𝑖�𝑈𝑖 (2)
6
R&D stocks are assumed to influence production with a two-year lag to reflect that the application of new knowledge and insights due to R&D takes time.2 If we adopt a log-linear specification for 𝑔�𝑅𝑓𝑖,𝑆𝑖� and model 𝑈𝑖𝑖 = 𝑒𝜇𝑠𝑖+𝜀𝑖, we obtain:
ln𝑇𝑇𝑇𝑖 =𝛼𝑅ln𝑅𝑓𝑖+𝛼𝑆ln𝑆𝑖+𝛼𝑋X𝑖 +𝜇𝑠𝑖+𝜀𝑖 (3)
where 𝜇𝑠𝑖 represents industry effects (with 𝑠𝑖 denoting the industry of plant 𝑖)and 𝜀𝑖 represents measurement error.
R&D spillovers 𝑆𝑖 may stem from R&D conducted at technologically proximate plants and from R&D conducted by individual suppliers and customers. Each plant with access to parent firm R&D is a potential source of spillovers due to these exponents of technological or supplier-buyer relatedness. To avoid double counting of R&D stocks in cases in which firms operate multiple plants, we allocate firms’ R&D stocks to their plants based on the output share of the plant in the firm’s total production in Japan. The total spillover pool available to plant i of firm f is defined as the weighted sum of other all other firms’ R&D stocks in Japan:
𝑆𝑖 = ∑𝑓′≠𝑓𝑖∑𝑖′∈𝑃𝑓′𝑤𝑖𝑖′ 𝑂𝑖′
𝑂𝑓′𝑅𝑓′ (4)
where 𝑇𝑓′ denotes the set of plants owned by firm𝑓′, 𝑤𝑖𝑖′ is the spillover weight of plant 𝑖′ to plant 𝑖, 𝑂𝑖′ is the output of plant 𝑖′, 𝑂𝑓′ is the total output of firm 𝑓′, and 𝑅𝑓′ is the R&D stock of firm 𝑓′. The spillover weight depends on technological relatedness between the industries of the plants 𝑖′ and i, 𝑇(𝑠𝑖,𝑠𝑖′), the geographic distance between the plants, 𝑑𝑖𝑖′, and the presence of and type of buyer-supplier relationships between firms operating these plants, 𝐼𝑘�𝑓𝑖, 𝑓𝑖′�. We distinguish two types of capital relationships, as there may be asymmetry depending on which party is the controlling firm: suppliers or customers that are shareholders of the focal firm, and suppliers or customers in which the focal firm holds equity. We model this as follows:
2 The lag between firms’ own R&D investment and productivity is taken to be one year. Results are robust to the specific lag chosen.
7
𝑤𝑖𝑖′ = �1− ∑ 𝐼𝑘 𝑘�𝑓𝑖, 𝑓𝑖′��𝑇�𝑠𝑖, 𝑠𝑖′�𝑒𝜏𝑜𝑑𝑖𝑖′ +∑ 𝐼𝑘 𝑘�𝑓𝑖, 𝑓𝑖′��𝑇�𝑠𝑖, 𝑠𝑖′�+𝛿𝑘�𝑒𝜏𝑘𝑑𝑖𝑖′ (5)
where 𝐼𝑘(𝑓𝑖,𝑓𝑖′) is an indicator function taking the value one in case of the following specific inter-firm relationships:
• 𝐼𝑏𝑏�𝑓𝑖, 𝑓𝑖′�= 1 if the firm of plant 𝑖′buys from and is not a shareholder of the firm of plant 𝑖
• 𝐼𝑠𝑏�𝑓𝑖, 𝑓𝑖′�= 1 if the firm of plant 𝑖′ supplies and is not a shareholder of the firm of plant 𝑖
• 𝐼𝑏ℎ�𝑓𝑖, 𝑓𝑖′�= 1 if the firm of plant 𝑖′buys from and is a shareholder of the firm of plant 𝑖
• 𝐼𝑠ℎ�𝑓𝑖, 𝑓𝑖′�= 1 if the firm of plant 𝑖′ supplies and is a shareholder of the firm of plant 𝑖. 𝛿𝑘 is a parameter to be estimated reflecting the differential importance of specific plants belonging to parent firms with a specific buyer-supplier relationship type 𝑘. 𝑑𝑖𝑖′ is the geographic distance between plant 𝑖 and plant 𝑖′. 𝜏𝑘 is a decay parameter to be estimated (with 𝜏𝑘 < 0).
Hence, in the absence of supplier or customer relationships (𝐼𝑘(𝑓𝑖,𝑓𝑖′) = 0 for all 𝑘), the spillover weight is just a function of technological proximity and distance (with distance decay parameter 𝜏𝑏); the estimated elasticity of productivity with respect to the R&D spillover pool is 𝛼𝑆 in equation (3). In the presence of supplier or customer relationships, the model allows for an additional spillover effect 𝛿𝑘 (a spillover ‘mark-up’) on top of the ‘base’ effect of technological proximity, while simultaneously allowing differential geographic decay functions 𝜏𝑘. We expect the strongest spillovers from the ‘major’ firms in vertical chains: the suppliers or customers that are shareholders (e.g. Branstetter, 2000). We model an exponential decay function on the effectiveness of spillovers with parameter 𝜏 to be estimated, in line with recent studies (e.g.
Lychagin et al. 2010). Distance d is the distance between a pair of locations and is measured as the geo-distance between the centre of cities, wards, towns, and villages. In order to correct for differences in the geographic areas covered by the regions, distance is the radius of the region if plants are located in the same region.
8
3. DATA SOURCES AND SAMPLE
We match plant-level data from the Japanese Census of Manufacturers with information on R&D expenditures from the yearly (comprehensive) Survey of R&D Activities in Japan, and information on buyer-supplier linkages in the database compiled by Tokyo Shoko Research (TSR, 2006). The manufacturing census comprehensively covers manufacturing plants with more than four employees. The Survey of R&D Activities in Japan is a comprehensive and mandatory survey of R&D-performing firms in Japan with a response rate of approximately 90 per cent. Large firms (with more than 1 billion Yen in capital) are always included in the survey;
smaller firms are included in the survey more frequently if they are identified as R&D- conducting firms in the previous survey. In our analysis, we only include plants of firms responding to the R&D surveys, as we require valid information on firms’ own R&D expenditures or on the absence thereof. In terms of R&D spillover pools, we sought comprehensiveness by using the weights provided in the R&D survey to correct for non-response and to arrive at an estimate of total R&D expenditures in Japan and their distribution over locations. The TSR data was collected for the purpose of credit rating services. It identifies the most important buyers and suppliers of Japanese firms, with a maximum of 24. The 2006 version of the data represents the actual buyers and suppliers in 2005. By combining buyers and suppliers mentioned in the survey from both sides (buyers reporting suppliers and suppliers reporting buyers), the number of identified buyers and suppliers is further increased. We can match close to 12,000 firms in the TSR data to the R&D surveys. These firms operated more than 20,000 manufacturing plants in Japan in 2005. For about 40 per cent of the plant observations, plants are owned by parent firms for which we could confirm the absence of formal R&D.
We utilize plant-level TFP data from the Japan Industrial Productivity Database (JIP) 2010 (Fukao et al., 2008). TFP is measured using the index number method (see Belderbos et al., 2013). One of the main advantages of the index number method is that it allows for heterogeneity in the production technology of individual firms, while other methods controlling for the endogeneity of inputs (e.g. Olley and Pakes, 1996; Levinsohn and Petrin, 2003) assume an identical production technology among firms within an industry (Van Biesebroeck, 2007; Aw et al., 2001). TFP data are calculated for 58 manufacturing industries (see Table 1). TFP data are
9
currently available up to the year 2007. R&D stocks are calculated via the perpetual inventory method. We use industry-specific depreciation rates to reflect differences in the speed of obsolescence and technology life cycles. Industry-specific depreciation rates are based on Japanese official surveys of the ‘life-span’ of technology conducted in 1986 and 2009 among R&D conducting firms3 and vary between 8 (food industry) and 25 per cent (precision instruments). To calculate initial R&D stocks (Hall and Oriani, 2006), we similarly use industry- specific growth rates, which we calculate from the R&D survey as average R&D growth rates per field in the 1980s. R&D investments are deflated using a deflator for private R&D from the JIP database, calculated from the price indices of the input factors for R&D expenditures for each industry. We calculate focal plant-level R&D stocks as the R&D stock of the parent, assuming that all parent firm R&D provides relevant productivity-improving inputs to the plants.4 Zero R&D cases are not compatible with the specification in natural logarithms in (3) but provide important variation in the sample. We deal with this by including for R&D engagement and by adding the value one to the R&D stock before taking the logarithm (e.g.
Klette, 1996). When calculating R&D stocks by location and industry, we avoid double counting by allocating parent firms’ R&D stocks to their plants based on the output share of the plant in the total output of all the firm’s plants. We map R&D stocks across industries and space by using the information on the location of the plant, where we distinguish more than 1,800 cities, wards, towns, and villages, and the bilateral distances between these. Distance is measured as the geo- distance between the centre of cities, wards, towns, and villages. In order to correct for differences in the geographic areas covered by the regions, distance is the radius of the region if plants are located in the same region. The technological relatedness measure is derived from patent data and based on Leten et al. (2007). The relatedness between technologies will be reflected in the intensity with which technologies in a field build on prior art in a different field.
Patent citation data are available at the four-digit International Patent Classification (IPC) level.
The IPC codes can subsequently be mapped onto industries using the industry-technology concordance table developed by Johnson (2002) in which each technology field is linked to
3 See “White Paper on Science and Technology” (1986, Science and Technology Agency) and “Survey on Research Activities of Private Corporations” (2009, National Institute of Science and Technology Policy).
4Given that R&D at the firm level is often organized to benefit from scope economies (e.g. Henderson and Cockburn, 1996; Argyres and Silverman, 2004) and involves active knowledge transfer to business units and plants, this may be a suitable assumption.
10
corresponding Japan Standard Industry Classification (SIC) codes.
The vector of plant- and firm-specific characteristics 𝐗𝑖 in equation (3) includes, in addition to parent R&D stock (in logs) and the dummy for positive R&D stock, plant size (number of employees), a dummy variable indicating whether the plant is active in multiple industries (at the four-digit level), a dummy taking the value one if the plant is exiting in the subsequent year, a dummy taking the value one if the plant was established the previous year, plant age, firm age, the number of firm employees, and the number of plants operated by the firm. The entry and exit dummies are included to control for unobserved plant heterogeneity (Adams and Jaffe, 1996).
The models also include a set of industry dummies.
Specification
The empirical models relate TFP of the plants in 2007 to parent firm R&D in 2006 and R&D spillover stocks in 2005, with buyer-supplier relationships measured in 2005. Given that we only have one year in which we can measure buyer and supplier relationships, the analysis has to be limited to a cross section. Hence, equation (3) is estimated as a nonlinear regression model (due to the specification of the spillover pool exponential form of the distance effects and the differencing effects of the types of buyer-relationships5). We assume that the buyer and supplier relationships are relatively stable – which is not a demanding assumption for the two-year period we consider and given the relatively stable buyer supplier relationships in Japan.
The cross-section specification and the inability to control for all unobserved heterogeneity make it difficult to interpret the estimates as causal relationships. In future work, we aim to identify the effects of supplier and buyer R&D spillovers through changes in R&D stocks by estimating a differenced equation. Identification will require sufficient change in these stocks or in the plants of buyers and suppliers embedding these R&D stocks (through entry and exits), or it will require potential changes due to plant entry and exits. Another and more onerous caveat is potential endogeneity through reverse causality. It is conceivable that the most productive buyers are
5The distance decay parameters, 𝜏𝑘, and the parameter reflecting the relative importance of each type of the buyer-supplier relationships, 𝛿𝑘, are estimated using a Taylor approximation. See Belderbos et al.
(2013) for details.
11
attracted to suppliers with the highest R&D stocks and vice versa. In a supplementary analysis, however, we show that this is not the case in practice. Rather, existing productivity is negatively related to relationships with buyers and suppliers with both positive R&D stocks and the highest R&D stocks.
Descriptive Statistics
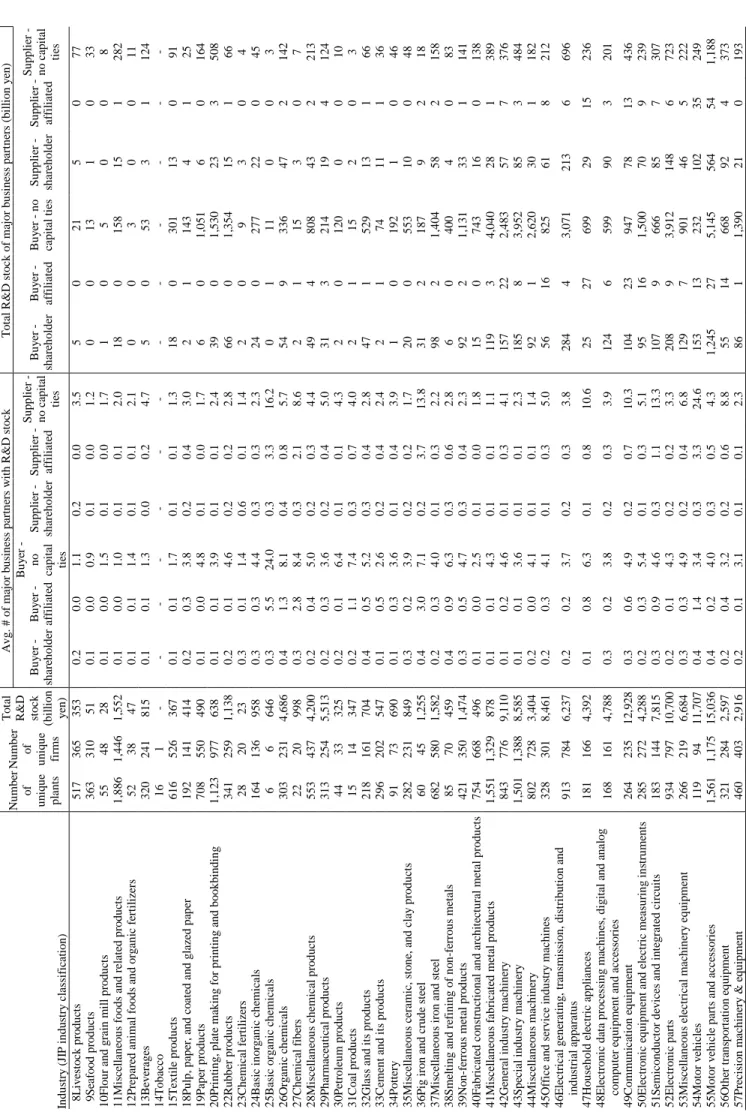
Table 1 shows the distribution of plants over industries. The largest numbers of plants are active in miscellaneous foods, fabricated metals, special machinery, and motor vehicle parts. Supplier R&D stocks are highest in semiconductors, motor vehicles, and communication equipment.
Customer parent stocks are generally higher and most prominent in electronics parts, semiconductors, miscellaneous machinery, communication equipment, electronic measurement equipment, and computers. The smallest customer and supplier R&D stocks are generally found in food industries, textiles, and cement. R&D stocks of capital ownership-related suppliers and buyers are most prominent in electronics equipment, semiconductors, other transportation, chemical fibres, and organic chemicals, electronics and semiconductors, communication equipment, electrical machinery, and motor vehicles (customers).
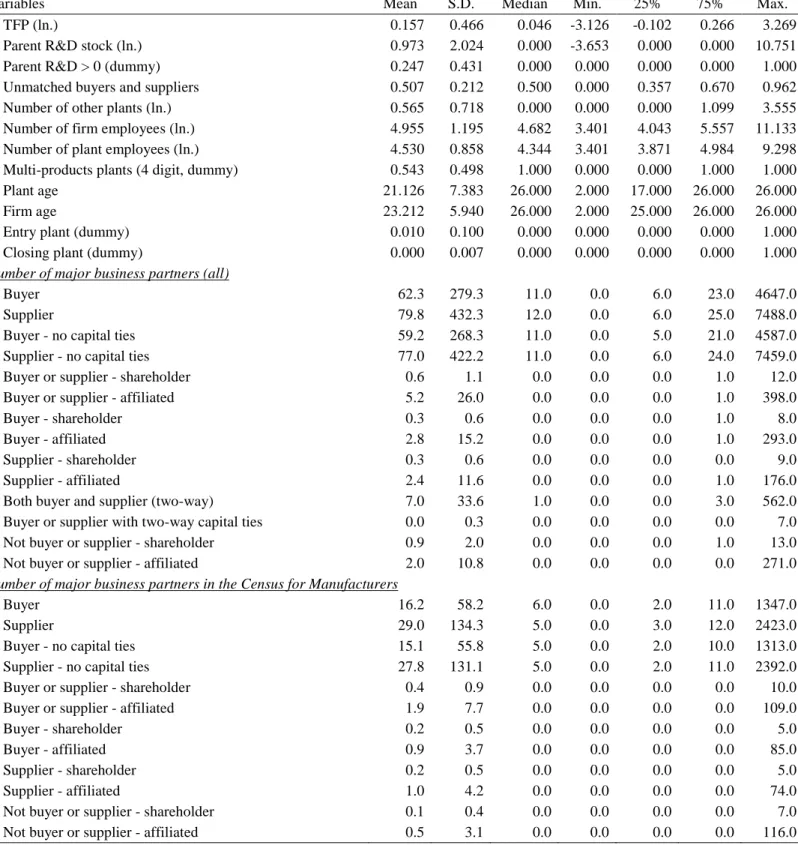
Table 2 provides a set of descriptive statistics for the sample and variables. In addition to the variable descriptives for the focal plant and firms (the top panel), a comparison is made between two groups: 1) total numbers of suppliers in the TSR data and those suppliers and customers that are in manufacturing industries and can be linked to the census and 2) suppliers and customers with positive R&D stock providing R&D spillovers. The bottom panel describes the actual suppliers and customer R&D stock variables. Table 3 shows correlations between the variables.
High correlations are generally only observed for variables that are not simultaneously included in the models (e.g. supplier R&D stock and affiliated supplier R&D stock). An exception is the correlation coefficient of 69 per cent between affiliated suppliers’ and customers’ R&D stocks.
This correlation is due to the presence of vertically integrated core manufacturing firms controlling firms at both the supply and demand sides. In practice, this makes it difficult to identify the effects of all four capital stock-related buyers and suppliers. We will report results in the current paper with 1) suppliers (buyers) that are major shareholders of the focal firm (where we expect most directional knowledge flows) and 2) a broader definition of capital ties with
12
R&D stocks of suppliers (buyers) that are either affiliated firms controlled by the focal firm or major shareholders of the focal firm.
Figure 1 shows the distance between the focal plants and R&D conducting plants providing potential R&D spillovers. The median distance from supplier and buyer plants is about 170 kilometres, half the distance from other manufacturing plants. For those plants operated by R&D investing firms, the median distance is smaller, at 115 kilometres. Roughly half of these plants are located within a 100-kilometre radius.
4. EMPIRICAL RESULTS
Table 4 shows the results of the models distinguishing generic spillovers, spillovers from suppliers and buyers, and spillovers from buyers and suppliers that are a major shareholder of the focal firm. Model 1 only contains general R&D spillovers and Models 2-5 add specific spillovers. In Model 1, the coefficient for parent R&D suggests an elasticity of TFP with respect to R&D of 0.021 per cent, which is at the lower end of the plant-level elasticities estimated in earlier work (Adams and Jaffe, 1996; Belderbos et al. 2013). The elasticity of the private R&D stock is lower at 0.007 per cent, while spillover effects decay with distance, as the significant distance parameter suggests. The coefficient for the private R&D stock increases to 0.015 when the models contain more detail regarding the source of spillovers and include a separate distance coefficient for buyers and suppliers. Model 3 shows that there is a spillover premium if R&D stocks belong to buyers or suppliers and that the effects of these spillovers do not decay with distance. Model 4 suggests that supplier spillovers have the highest premium; Model 5 indicates that spillovers of supplying firms that are shareholders of the focal firm result in by far the highest productivity effects. The control variable indicates a positive relationship between productivity and recent entry and a negative association with multi-plant firms, the number of other plants of the firm, subsequent exit, and plant age (in its squared form). Firm age has an inverted-u shaped relationship with productivity.
Table 5 focuses on the role of spillovers from affiliated firms rather than shareholding firms. As discussed above, since relationships with affiliated firms occur often simultaneously with
13
suppliers and with buyers (a feature of larger firms controlling the vertical chain), we aggregate supplier and buyer spillovers in this case. The results indicate that while spillovers from shareholders are about twice as large, spillovers from affiliated firms also play an important role and feature a significant and large premium.
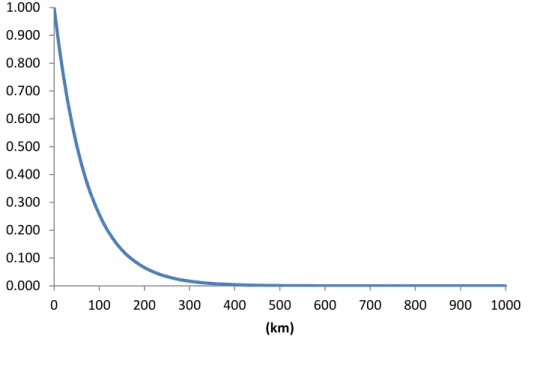
The decay function for spillovers from plants that are not buyers or suppliers, based on the results in Table 4, Model 5, is depicted in Figure 2. Spillover effects decline and become negligible at about 300 kilometres. This pattern suggests somewhat stronger decay effects compared to the estimates reported in Belderbos et al. (2013) for Japanese plants and in Lychagin et al. (2010) for U.S.-listed manufacturing firms based on inventor locations. One explanation for the stronger estimated decay effects is that the separate estimation of distance effects due to buyer and supplier spillovers, brings the remaining R&D spillover variable closer to a ‘pure’
spillover measure unaffected by transactional transfers. Pure spillovers tend to occur in closer vicinity.
Supplementary analysis
We modelled the spillovers from buyers and suppliers as additive to the effect of technological proximity. An alternative specification is to model these as multiplicative. The choice between the two is not trivial: in the latter case, the assumption is that the effect of buyers and suppliers spillovers is strongly reduced if the buyer and supplier industries share no specific technologies.
In general, we found much weaker effects in this specification, indicating that productivity gains can occur in the absence of technological proximity, as long as there is relational proximity.
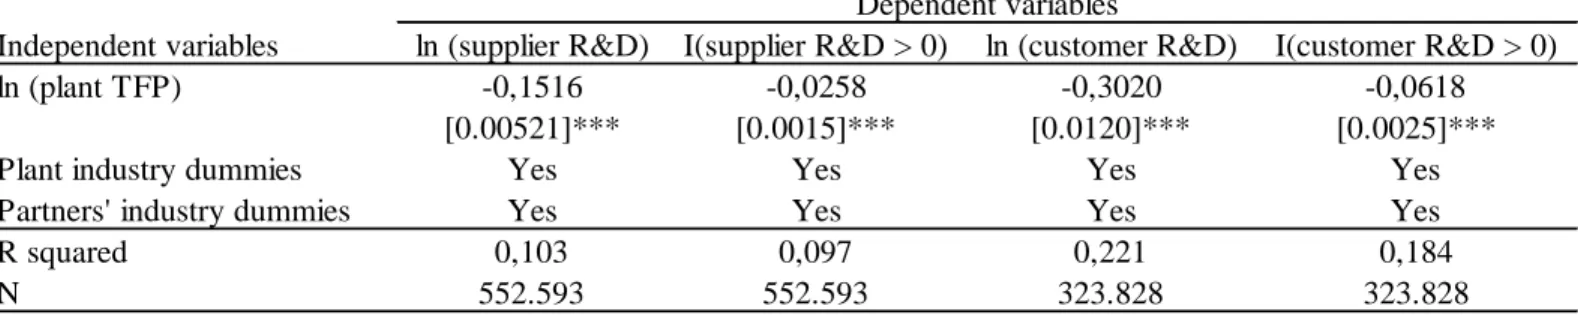
We also addressed the issue of endogenous ‘matching’ of suppliers and buyers. In an auxiliary regression, buyer and supplier R&D stocks were regressed on the focal firm’s past TFP and two sets of industry dummies - for the focal plant and for the industry of the buyer (supplier).
Empirical results reported in Table 6 strongly suggest that there is negative, rather than a positive, effect of prior TFP on the likelihood that the firm’s buyer or supplier invests in R&D, and on the level of the R&D stock of buyers and suppliers. Although this is a surprising pattern that invites further investigation in future work, it does suggest that the estimated R&D spillover
14
effects of buyers and suppliers are not likely to be biased by reverse causality.
5. CONCLUSIONS
The role of buyers and suppliers has received little attention in the literature on R&D spillovers and productivity, which has focused primarily on the moderating roles of technological and geographic proximity. In this paper, we have examined R&D spillovers due to buyer and supplier relationships at the transaction level, utilizing a unique dataset identifying individual buyers and suppliers of Japanese manufacturing firms, matched with data from the census of manufacturers and R&D surveys. In an analysis of more than 20,000 Japanese manufacturing plants, we find that R&D stocks of buyers and suppliers provide a substantial productivity performance premium over and above the effect of technologically and geographically proximate R&D stocks. These effects are magnified if the supplier and buyer have business group ties based on capital ownership relationships. The strongest such effects are observed for spillovers from buyers of suppliers that are the ‘core’ firms in the vertical chain and are shareholders of the focal firm. The latter finding is consistent with prior findings for the automobile and electronics industries in Japan (e.g. Branstetter, 2000; Suzuki, 1993). While distance is likely to affect the likelihood that transaction relationships occur, as exemplified by geographically concentrated buyer and supplier plants, given that transactions take place, distance no longer attenuates knowledge spillovers. We confirmed that the associations we find are not driven by a matching process in which the more productive firms tie up with R&D intensive suppliers and customers.
Our results identify transaction-based spillovers as key influences on productivity and social returns to R&D.
We envisage addressing a number of specification issues and undertaking supplementary analyses in future work, of which we mention three. First, we aim to assess the magnitude of buyer and supplier spillovers compared to R&D spillovers from other plants by performing a decomposition analysis. While the effects of (capital-related) buyer and supplier spillovers are large, such relationships are also relatively rare compared with the spillovers from the population of (technologically proximate) plants. It is then of interest to gain insight into the overall contribution of supplier- and buyer-related spillovers to productivity. Second, it may be of
15
interest to investigate potential spillovers from capital relationships in the absence of supplier or buyer ties. Third, we aim to perform a sensitivity analysis related to the likely imperfect coverage of buyer and supplier relationships in the TSR data, e.g. by limiting the analysis to firms with a minimum number of suppliers and buyers or by including indicators regarding the presence of limited information in the TSR data.
REFERENCES
Adams, J. D. & Jaffe, A. B., 1996. Bounding the Effects of R&D: An Investigation Using Matched Establish-Firm Data, RAND Journal of Economics, 27, pp.700-721.
Aldieri, L. & Cincera, M., 2009. Geographic and Technological R&D Spillovers within the Triad: Micro Evidence from US Patents. Journal of Technology Transfer, 34(2), pp.196- 211.
Argyres, N. & Silverman, B., 2004. R&D, Organization Structure, and the Development of Corporate Technological Knowledge. Strategic Management Journal, 25, pp.929-958.
Aw, B. Y., Chen, X. & Roberts, M. J., 2001. Firm-level Evidence on Productivity Differentials and Turnover in Taiwanese Manufacturing. Journal of Development Economics, 66, pp.51-86.
Belderbos, R. & Grimpe, C., 2012. Learning by Exporting, Learning by Non-Exporting, paper presented at the Academy of Management Conference, 2012.
Belderbos, R., Gilsing, V., Lokshin, B. 2012, Persistence of, and interrelation between horizontal and vertical technology alliances, Journal of Management, 38(6), 1788-1811.
Belderbos, R., Wakasugi, R., and Zou J., 2012. Network Effects in Capital Goods Trade: Japanese Business Groups and the Import Behaviour of Foreign Affiliates, Journal of the Japanese and International Economies, 26 (2), 187-200.
Belderbos, R., Carree, M. & Lokshin, B., 2004. Cooperative R&D and firm performance, Research Policy, 33(10), pp.1477-1492.
Belderbos. R., Ikeuchi, K., Fukao, K., Kim, Y. G. & Kwon, H. U., 2013. Plant Productivity Dynamics and Private and Public R&D Spillovers: Technological, Geographic and Relational Proximity. CEI Working Paper Series No. 2013-05.
Bloom, N., Schankerman, M. & Van Reenen, J., 2013. Identifying Technology Spillovers and Product Market Rivalry. Econometrica, 81(4), pp.1347-1393.
Branstetter, L., 2000. Vertical Keiretsu and Knowledge Spillovers in Japanese Manufacturing:
An Empirical Assessment. Journal of the Japanese and International Economies, 14(2), pp.73-104.
Crespi, G., Criscuolo, C., & Haskel, J., 2008. Productivity, Eexporting and the Llearning by Eexporting Hhypothesis: Ddirect Eevidence from UK firms. Canadian Journal of Economics, 41 (2), pp. 619-638.
16
Duranton, G. & Overman, H. G., 2005. Testing for Localization Using Micro-Geographic Analysis. Review of Economic Studies, 72(4), pp.1077-1106.
Feldman, M. P. & Lichtenberg, F. R., 1998. The Impact and Organization of Publicly-Funded Research and Development in the European Community. Annales d'Économie et de Statistique, 49/50, pp.199-222.
Fukao, K, Kim, Y. G. & Kwon. H. U., 2008. Plant Turnover and TFP Dynamics in Japanese Manufacturing. In A. Heshmati & J.-D. Lee (eds.), Micro-Evidence for Dynamics of Industrial Evolution, Nova Science Publishers, Inc., Ch. 3, pp.23-59.
Görg, H. & Strobl, E., 2001. Multinational Companies and Productivity Spillovers: A Meta- Analysis. The Economic Journal, 111(475), pp.F723-F739.
Goto, A. & Suzuki, K., 1989. R&D Capital, Rate of Return on R&D Investment and Spillover of R&D in Japanese Manufacturing Industries. Review of Economics and Statistics, 71, pp.
555-564.
Griffith, R., Redding, S., & Simpson, H., 2009. Technological Catch-up and Geographic Proximity. Journal of Regional Science, 49, pp.689-720.
Griliches, Z., 1992, The Search for R&D Spillovers, Scandinavian Journal of Economics, 94, pp.29-47.
Hall, B. H. & Oriani R., 2006. Does the Market Value R&D Investment by European Firms?
Evidence from a Panel of Manufacturing Firms in France, Germany, and Italy.
International Journal of Industrial Organization, 5, pp.971-993.
Hall, B. H., Mairesse, J. & Mohnen, P., 2012. Measuring the Returns to R&D. In B. Hall & N.
Rosenberg (eds.), Handbooks in Economics: Economics of Innovation Volume 2. North- Holland, pp.1034-1074.
Haskel, J., Pereira, S. & Slaughter, M., 2007. Does Inward Foreign Investment Boost the Productivity of Domestic Firms? The Review of Economics and Statistics, 89(3), pp.482- 496.
Henderson, R. & Cockburn, I., 1996. Scale, Scope, and Spillovers: The Determinants of Research Productivity in Drug Discovery. Rand Journal of Economics, 27, pp.31-59.
Isaksson, H.D., Simeth, M. & Seifert, R.W., 2014. Knowledge Spillovers in the Supply Chain:
Evidence from High Tech Sectors, Working Paper, EPFL.
Jaffe, A. B., Trajtenberg, M. & Henderson, R., 1993. Geographic Localization of Knowledge Spillovers as Evidenced by Patent Citations. Quarterly Journal of Economics, 108, pp.577- 598.
Javorcik, B. S., 2004. Does Foreign Direct Investment Increase the Productivity of Domestic Firms? In Search of Spillovers through Backward Linkages. American Economic Review, 94(3), pp.605-627.
Johnson, D. K., 2002. The OECD Technology Concordance (OTC): Patents by Industry of Manufacture and Sector of Use, OECD Science, Technology and Industry Working Papers, 2002/5, OECD Publishing
17
Keller, W., 2004. International Technology Diffusion, Journal of Economic Literature, XLII, 752-782.
Kugler, M., 2006. Spillovers from Foreign Direct Investment: Within or Between Industries?
Journal of Development Economics, 80, pp.444-477.
Klette, T. J., 1996. R&D, Scope Economics, and Plant Performance. Rand Journal of Economics, 27, pp.502-522.
Klette, T. J. & Johansen, F., 1998. Accumulation of R&D Capital and Dynamic Firm Performance: A Not-so-fixed Effect Model. Annals of Economics and Statistics, 49/50, pp.389-419.
Leten, B., Belderbos, R. & Van Looy, B., 2007. Technological Diversification, Coherence, and Performance of Firms. Journal of Product Innovation Management, 24(6), pp.567–579.
Levinsohn, J. & Petrin, A., 2003. Estimating Production Functions Using Inputs to Control for Unobservables. Review of Economic Studies, 70, pp.317-341.
Lychagin, S., Pinkse, J., Slade, M. E. & Van Reenen, J., 2010. Spillovers in Space: Does Geography Matter? NBER Working Paper, National Bureau of Economic Research.
Mairesse, J. & Mulkay, B., 2008. An Exploration of Local R&D Spillovers in France. NBER Working Paper, National Bureau of Economic Research.
Olley, S. & Pakes, A., 1996. The Dynamics of Productivity in the Telecommunications Equipment Industry. Econometrica, 64, pp.1263-1297.
Orlando, M., 2004. Measuring Spillovers from Industrial R&D: On the Importance of Geographic and Technology Proximity. Rand Journal of Economics, 35, pp.777-786.
Suzuki, K., 1993. R&D Spillovers and Technology Transfer mong and within Vertical Keiretsu Groups: Evidence from the Japanese Electrical Machinery Industry. International Journal of Industrial Organization, 11(4), pp. 573-591.
Teece, D. J., 1977. Technology Transfer by Multinational Firms: The Resource Cost of Transferring Technological Know-how, Economic Journal, 87(346), pp.242-61.
Todo, Y., Matous, P. & Inoue, H., 2015. The Strength of Long Ties and the Weakness of Strong Ties: Knowledge Diffusion through Supply Chain Networks, RIETI Discussion Paper Series, mimeo.
Van Biesebroeck, J., 2007. Robustness of Productivity Estimates. Journal of Industrial Economics, 55(3), pp.529-569.
![Table 3. Correlations Variables[1] [2] [3] [4] [5] [6] [7] [8] [9] [10][11][12][13][14][15][16][17][18][19][20][21] [1] TFP (ln.)1.000](https://thumb-ap.123doks.com/thumbv2/123deta/7397671.2452923/31.918.76.549.65.1130/table-correlations-variables-tfp-ln.webp)