Comparison of GP and SAP
in the image-processing filter construction using pathology images
Tomoyuki Hiroyasu
the Department of Life and Medical Sciences, Doshisha University
Sosuke Fujita, Akihito Watanabe the Graduate School of Engineering,
Doshisha University
Mitsunori Miki the Department of Science and Engineering, Doshisha University
Maki Ogura
the Innovative Service Solutions Division, NEC Corporation and Graduate School of Medicine, Tohoku University
Manabu Fukumoto the Institute of Development, Aging and Cancer, Tohoku University
Abstract—In this paper, programming methods of constructing filters for choosing target images from pathology images are discussed. Automatic construction of these filters would be very useful in the medical field. Image processing filters can be expressed as tree topology operations. Genetic Programming (GP) is an evolutionary computation algorithm that can design tree topology operations. Simulated Annealing Programming (SAP) is also an emergent algorithm that can create tree topology operations. These two algorithms, GP and SAP, were applied to construct Image Processing Filters and the characteristics of these two algorithms were compared. The results indicated that GP has strong search capability for finding the global optimum solution. However, in the latter part of the search, the diversity of solutions is lost and the program size becomes large. This can be avoided by removing introns. It is assumed that filters developed by GP have strong robustness for other images. On the other hand, SAP requires many iterations to find the optimum but the program size is small. Filters developed by SAP are relatively weak from the viewpoint of robustness for other images.
I. INTRODUCTION
With the increasing incidence rate of cancer in Japan, the number of medical doctors performing pathological diagnosis has become insufficient. Therefore, there is increasing demand for support systems to carry out pathological diagnosis. For example, NEC Corp. (NEC) developed a system to supports pathological diagnosis of a doctor, which can extract cancers and characteristics of the tissue and cell from digitized images both rapidly and accurately[1], [2].
However, it is difficult to construct image processing sys- tems for analyzing medical images necessary for the devel- opment of a pathological diagnostic imaging support system.
Here, we discuss image construction algorithms and systems for automatic extraction of pathological parts from pathology images. Conventional techniques such as IMPRESS[3], [4]
and ACTIT[5], [6], [7] have been proposed as methods of performing automatic construction of image processing filters for extraction of pathological regions. Nagao et al. applied Ge- netic programming (GP) to optimize image processing filters, and they called their process evolutionary image processing[8],
[9], [10]. GP is an evolutionary computation algorithm that can design tree topology operations. Simulated Annealing Programming (SAP)[11] is also one such algorithm. However, in the design of image processing filters for pathology images, filters derived by GP and SAP were not compared. Here, GP and SAP were applied to construct filters capable of extracting cancer nets from pathology images. We discuss the features of GP and SAP searches in evolutionary image processing.
II. CURRENT STATE OF PATHOLOGY DIAGNOSIS
Generally, pathological diagnosis is performed subjectively by doctors who check pathology images. Thus, the diag- nosis may be influenced by the conditions and experience of the doctor. Therefore, many studies have been performed to introduce novel indexes for the pathological diagnosis of cancer. For example, in the NEC system, pathological diag- nosis is automated and a pathology image diagnostic support system that supports pathological diagnosis by a doctor was developed[1], [2]. In the NEC cancer diagnosis assistance sys- tem, e-pathologist, pathological diagnosis is supported through a number of processes as follows. First, the constituent factors of an organization are extracted from pathology images. Then, cancerous areas are detected by quantifying the features of the elements. Here, image processing was performed using pathology images, and automatic construction of the image processing technique is discussed. In this paper, a pathology image is defined as a photograph used for pathological diagno- sis. Figure 1 shows an example of a pathology image treated in the present study. Low magnification images (10×) stained with HE were used in this study, and such images are generally used in histological research and pathological diagnosis.
III. IMAGE PROCESSING FILTER CONSTRUCTION USING THE AUTOMATIC PROGRAMMING TECHNIQUE
A. Outline
To construct an image processing filter automatically, Nagao et al. proposed evolutionary image processing[12]. Generally,
Fig. 1. example of the pathology image
image processing can be expressed as a combination of a known simple image processing methods (basic filters), and evolutionary image processing is a technique for obtaining the optimal combination of these basic filters using an automatic programming technique. Image processing filters can be ex- pressed as tree topology operations (tree topology filters), as shown in Figure 2.
I : Original image(Input image) T : Target image O : Output image Fi(i=1,2,...) : Known filter
I
I F1 O T
F3 F8
F7 F4 I
Fig. 2. Principle of automatic Image Processing with tree topology filter
The tree topology filter approximates the image processing algorithm from the original image I to the target image T. For evaluation of tree topology filters, the original data (input image) and target image are prepared in advance. This is the learning phase. In addition, the target image and the weight image are generated manually from the original images. An example of the picture set for learning is shown in Figure 3.
Original image(I) Target image(T) Weight image(W)
Fig. 3. An example of the picture set for learning
To realize image processing using tree topology filter, the original image I is inserted into the terminus nodes of this tree topology filter. Then, the basic filter which is stored in the non-termination node processes one by one. These basic filters are summarized in Table I and Table II. These basic filters were used in reference[12]. Finally the tree topology filter outputs the output image from the root node.
B. Valuation function
Equation (1) shows the fitness function for evaluating the tree topology filter. In this equation, the differences in each pixel value of output imageOfrom the image processing filter and target image T are evaluated.
f itness=k1PK k=1
( 1−
PWx x=1
PWy
y=1wi(x,y)|Oi(x,y)−Ti(x,y)|
PWx x=1
PWy
y=1wi(x,y)·Vmax
)
(1)
K, w(x, y), and Vmax express the number of image sets for learning, the pixel value of the weight image (x, y) coordinates, and the maximum tone value, respectively.
TABLE I
THE BASIC FILTER OF1INPUT Filter ID Effect
f101 Mean
f102 Minimum value of neighborhood f103 Maximum value of neighborhood f104 Edge emphasis(sobel)
f105 Edge emphasis(laplacian) f106 Edge emphasis(dark edge) f107 Contraction
f108 Expansion f109 Large Area f110 Small Area f111 Inversion
f112 Median
f113 Binarization
TABLE II
THE BASIC FILTER OF2INPUTS Filter ID Effect
f201 Logical Sum f202 Logical Product f203 Algebraic Sum f204 Algebraic Product f205 Bounded Sum f206 Bounded Product
IV. THE AUTOMATIC PROGRAMMING TECHNIQUE
Here, GP and SAP were applied as automatic programming methods[13].
A. Genetic Programming(GP)
Genetic Programming (GP) is an evolutionary computation algorithm that can design tree topology operations. In GP, repeated application of hereditary operators, such as selection, crossover, and mutation, generates the optimum solution. Here, the algorithm of GP is explained.
Step 1 Generation of the initial individual group
Multiple individuals are generated at random, and are considered as the initial individual group (parent population). Each individual is evaluated.
Step 2 Selection
Some Individuals are chosen by considering each evaluation value and random factor. In this study, tournament selection was performed. In tournament selection, a fixed number of individuals are chosen from the group at random, and the individual with the highest value is chosen for the next generation.
Step 3 Crossover
The partial trees chosen at random are exchanged.
This can be seen from Figure 4 as.
Step 4 Mutation
The partial tree chosen at random is transposed to a mutation tree. This can be seen from Figure 5 as.
Step 5 End conditions
Steps 2-4 are repeated until the terminal condition is satisfied. In most cases, when the number of search generations reaches the specified number, the simulation is terminated.
f201
I
f201
f204
f108
I I
f206
I I
f201
I f108
I
f201
f204 I
f206
I I
f202
I I
f202
I I
Parent1
Parent2
Children1
Children2
Fig. 4. Crossover
f201
I f108
I
f201
I f206
I I
Fig. 5. Mutation
B. Simulated Annealing Programming(SAP)
Simulated Annealing Programming (SAP) is also an emer- gent algorithm that can create tree topology operations. In SAP, repeated generation processing, acceptance judging, changing state and cooling generate the optimum solution. The algorithm of SAP is as follows.
Step 1 Generation of an initial individual
An initial individual is generated at random and the individual is evaluated.
Step 2 Generation processing
A new individual is generated by performing the same processing as the mutation of GP, and the individual is evaluated.
Step 3 Acceptance judging, State transition
A state of solution is changed or not is judged with the difference∆E(=E′−E)between the evaluation E of the present individual and the new evaluation E′ of an individual generated by generation pro- cessing, and temperature parameter T. As shown in(2), Metropolis standard is used in acceptance judging[14].
PAC=
{ 1 if∆E≥0
exp(∆ET ) otherwise (2) PAC shows acceptance probability. In a Metropolis standard, when a new individual is better than the previous individual, the current solution moves from the previous one. Even when a new individual is worth than previous one, the current solution moves from the previous to the new individual using prob- abilistic number determined by temperature T and difference∆E of an evaluation value.
Step 4 Cooling
Steps 2 and 3 are repeated in certain iterations.
Then, the operation of reducing value of temperature parameterT is performed. In this case, exponential annealing is performed as shown in equation(3).
Tk+1=γTk (0.8≤γ≤1) (3) γ shows the cooling rate, Tk shows the present temperature, and Tk+1 shows the temperature after cooling.
Step 5 End conditions
Steps 2-4 are repeated until the terminal condition is satisfied. When the specified search number is reached, the simulation is terminated.
V. NUMERICAL SIMULATION
In this study, the performance of GP and SAP were com- pared and discussed through the development of filters.
A. Experiment outline
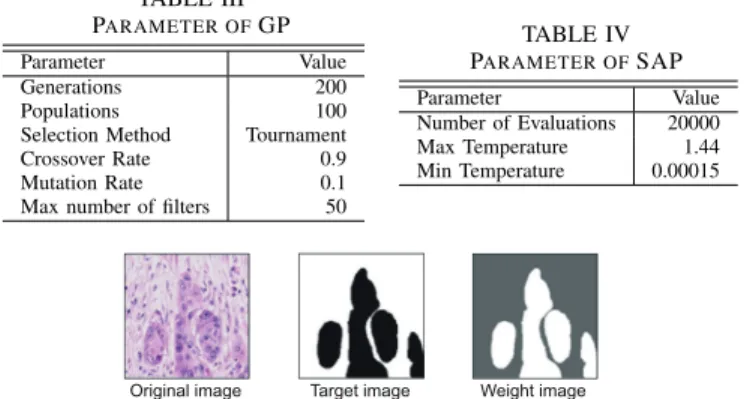
In this experiment, an image processing filter capable of extracting cancer nests from pathology images was developed using GP and SAP. This experiment verified the features of each automatic programming technique. In this experiment, a single photograph was used for learning. The parameters of GP and SAP are summarized in Tables III and Tables IV, respectively. A region of a low-magnification photograph (10× pictures) with HE staining is used as the image set for learning.
The image set for learning used in this experiment is shown in Figure 6. The weight image is set up so that non-extracted objects may become the ratio of 0.4 as opposed to the ratio of 1.0 for extraction.
TABLE III PARAMETER OFGP
Parameter Value
Generations 200
Populations 100
Selection Method Tournament
Crossover Rate 0.9
Mutation Rate 0.1
Max number of filters 50
TABLE IV PARAMETER OFSAP
Parameter Value
Number of Evaluations 20000
Max Temperature 1.44
Min Temperature 0.00015
Original image Target image Weight image
Fig. 6. The image set for learning used for learning of a single image
B. Learning ability
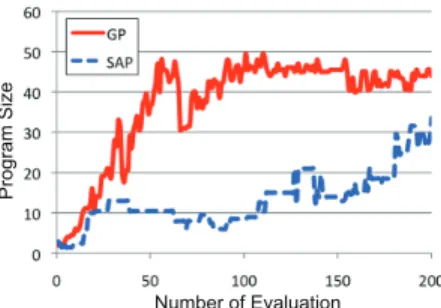
In this section, the learning abilities of GP and SAP are compared. The results of the evaluation value acquired by each automatic programming technique are shown in Figure 7. The results shown in Figure 7 are the medians of 10 trials of the optimal solution. The obtained output results are shown in Figure 8. The images showing extracted cancer nests generated from this output image obtained by taking the logical sum of the original image and the output image are presented in Figure 9.
As shown in Figure 7, GP can design a filter with a smaller number of evaluations than SAP. As shown in Figures 8 and Figure 9, as GP extracts the outline of the cancer nest more smoothly, we could also check visually that the image processed by GP is closer to the target image.
C. Program size
In this section, the program size of filters derived by GP and SAP are compared. In this experiment, the number of filters of the tree topology operations was defined as the program size.
Number of Evaluation
Evaluation Value
Fig. 7. Comparison of GP and SAP in Learning ability
GP SAP Target image
Fig. 8. Output image
GP SAP Target image
Fig. 9. Image generated cancer nest created from the output image
It has been reported that increases in program size results in an increase in bloat and a reduction in searching capability of GP[15], [16]. Bloat consists of redundant partial solutions and does not influence evaluation calculation. Transition of the number of filters of the tree structure and in the computation time during the search is shown in Figures 10 and Figure 11, respectively. The results are shown as the medians of 10 trials of the optimal solution.
Number of Evaluation
Program Size
Fig. 10. Comparison of GP and SAP in the number of filters of a tree structure
Number of Evaluation
Time(s)
Fig. 11. Comparison of GP and SAP in computation time
As shown in Figure 10, program size of the filters derived
by GP increased rapidly at the beginning of the search. As this restriction value affected the derived filter, it is very important to set an appropriate value. However, the optimal strategy for setting this restriction value remains a task for future studies.
On the other hand, although program size of the filter derived by SAP increased slightly at the end of the search, the final program size of SAP was smaller than that of GP. Program size is proportional to computation time. SAP, which can generate the solution with a small program size, is an effective technique from the viewpoint of program size.
D. Intron removal
Next, we investigated the existence of introns by performing intron removal in the filters built by GP and SAP.
1) Outline: In this study, an intron was defined as a redundant partial tree that does not affect the evaluation value.
When the input and output images are very similar to a certain partial tree, the partial solution is considered an intron. This partial tree is therefore meaningless. Introns are detected and removed by the following procedures.
1) The 1st node(Ni) is chosen at random and the 2nd node(Nj) is chosen from the partial tree below Ni at random.
2) Using equation(4), the similarity of Ni and Nj are evaluated.
similarity=k1PK k=1
(
1−PWxx=1PWyy=1Vmax·Wk·Hk|ONi(x,y)−ONj(x,y)| )
(4) Wk expresses the width of image, andHk expresses the height of image.
3) When each node is very similar (i.e., when the degree of similarity is 0.999 or greater), the partial tree from the parent node of Nj to the node Ni is deleted.
The above processing of the solution obtained by GP and SAP is performed 50 times. Then, the filter with the smallest program size is chosen. This series of processing steps is performed three times.
2) Results of intron removal processing: This section de- scribed the results of intron removal processing using V-D1.
The results regarding the numbers of introns removed for GP and SAP are shown in Table V.
TABLE V INTRON REMOVAL RESULT
Before intron removal After intron removal The number of removal
GP 45 28 17
SAP 31 29 2
As shown in Table V, many introns are contained in GP.
This means that the filters derived GP can be reduced in size when these introns are removed. After removing introns, GP constructed filters with programs of the same size as SAP.
E. Verification of robustness
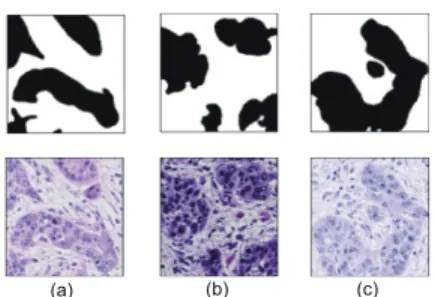
In this section, we examine the robustness of GP and SAP. The images used to evaluate robustness are shown in
Figure 12. The upper row of Figure 12 shows the extracted part in each image.
(a) (b) (c)
Fig. 12. The pathology image used for evaluation of robustness
Stained color of Figure 12(b) is darker than that of (a). On the other hand, the color of (c) is lighter than (a). The results of filters derived by GP are shown in Figure 13, and the results of SAP are shown in Figure 13.
(a) 0.912 (b) 0.918 (c) 0.947 Fig. 13. The output image of GP
(a) 0.901 (b) 0.747 (c) 0.881 Fig. 14. The output image of SAP
The evaluation value of GP is relatively high compared with SAP. We could check visually that the images processed by GP were closer to the target images. On the other hand, as shown in Figure 14, SAP extracted only the part of images of (b) and (c). This is because the derived filtter by SAP has many sum operation such as logical sum which uses two input files. To confirm this condition, a number of sum operation and product operation of average value contained in each filter is examined. The result is shown in Table VI.
TABLE VI
THE NUMBER OF TWO INPUT PROCESSES INCLUDED IN BOTH THE FILTERS OFGPANDSAP
The sum operation The product operation
GP 2.0 5.5
SAP 7.0 7.2
As shown in Table VI, many basic filters that perform sum operation in a filter by SAP are contained compared with
that of GP. By sum operation, to choose the one where the gradation value of each pixel is higher, the image of the output result tends to approach white (gradation value 255).
On the other hand, the product operation tends to approach black (gradation value 0). Therefore, the part of extraction was deleted by much sum operations in the filter derived by SAP.
VI. CONCLUSION
We developed a technique for automatic processing of pathology images. We applied Genetic Programming (GP) and Simulated Annealing Programming (SAP) for automatic construction of image processing filters. The characteristics of the filters derived by GP and SAP were compared and discussed.
GP can derive the best solution with less evaluation time than SAP. Even if SAP does not restriction program size, the filters derived by SAP were much smaller than those obtained by GP. Therefore, GP requires huge computational time. To avoid increasing program size, it is useful to perform intron removal processing in GP. Using this operation, GP can pro- duce filters with programs of the size same as those obtained by SAP. Filters produced by GP have greater robustness than those obtained by SPA. These results indicate that GP is more suitable for developing filters for pathology images than SAP.
REFERENCES
[1] NEC. Pathology picture analysis[in japanese].
http://www.nec.co.jp/solution/bio/rd/.
[2] Maki Ogura, Akira Saito. Cancer diagnosis assistance system[in japanese]. Pathology and clinical, Vol. 24, No. 4, pp. 411–415, 2006.
[3] H. Kubota J. Hasegawa and J. Toriwaki. Impress:a system for image processing procedure construction based on sample-figure presentation.
Systems and Computers in Japan, Vol. 20, No. 1, pp. 22–30, 1989.
[4] T. Matsuyama. Expert systems for image processing:knowledge-based composition of image amalysis process. Computer Vision, Graphics, and Image Processing., Vol. 48, pp. 22–49, 1989.
[5] Aoki and T.Nagao. Actit; automatic construction of tree-structural image transformation.The Institute of Image Information and Television Engineers, Vol. 53, No. 6, pp. 888–894, 1999.
[6] T. Nagao S. Aoki. Automatic construction of tree-structural image transformation using genetic programming, international conference of image processing. pp. 529–533, 1999.
[7] T. Nagao S. Masunaga. Automatic generalization of image transforma- tion processes using genetic algorithm. Proceedings of the IWANVMT- 97, pp. 101–106, 1997.
[8] J.Koza. Genetic programming, on the programming of conputers by means of natural selection. MIT Press, 1992.
[9] J.Koza. Genetic programming, Automatic Discovery of Reusable Pro- grams. MIT Press, 1994.
[10] D.E.Goldberg. Genetic algorithms in search; optomization; machine learning. Addison Wesley, 1989.
[11] M. Hashimoto T. Hiroyasu Y. Fujita, M. Miki. Automatic programming with simulated annealing[in japanese]. IPSJ, Vol. 19, pp. 89–92, 2007.
[12] T. Nagao. Evolutionary Image Processing. shokodo, 2002.
[13] Marshall C. Yovits Franz Alt, Morris Rubinoff.Advances in computers, Vol. 15. Academic Press.
[14] Rosenbluth A. Rosenbluth M. Teller A. Teller E Metropolis, N. Equation of state cal- culation by fast computing machines. Journ. of Chemical Physics, Vol. 21, pp. 1087–1092, 1953.
[15] P. Keller R. Banzhaf, W. Nordi and Francore.Genetic Programming:An Introduction. Morgan Kaufmann Publishers Inc, 1998.
[16] Angeline. Subtree Crossover Causes Bloat. Proc. 3rd Int’l Conf. on Genetic Programming, 1998.