Allometric relationship between hand bone lengths and stature in a modern Japanese population
Megumi Kondo1, Naomichi Ogihara2, Shuji Matsuʼura1, Sayaka Anada1, Kohta Ito2, Mitsunori Murata3, Toshiaki Tanaka4, Shun Matsuura5,
Shozo Takai6 and Ken-ichi Shinoda7
1 Laboratory of Physical Anthropology, Ochanomizu University, Bunkyo Ward, Tokyo 112–8610, Japan E-mail: [email protected]
2 Department of Mechanical Engineering, Keio University, Yokohama City, Kanagawa 223–8522, Japan
3 Wayo Womenʼs University, Ichikawa City, Chiba 272–8533, Japan
4 Tanaka Growth Clinic, Yoga 2–36–7, Setagaya Ward, Tokyo 158–0097, Japan
5 Department of Administration Engineering, Keio University, Yokohama City, Kanagawa 223–8522, Japan
6 University of Tsukuba, Tsukuba City, Ibaraki 305–8577, Japan
7 Department of Anthropology, National Museum of Nature and Science, Tsukuba City, Ibaraki 305–0005, Japan
Abstract Human proximal limb elements are known to scale with body size with smaller allom- etry coefficients than distal limb elements. In the present study, we tested if this allometric ten- dency is applicable to the human hand. Specifically, the allometric relationships between hand bone lengths and stature in a modern Japanese population were examined based on a total of 197 anteroposterior X-ray images of the adult hand. The lengths of 19 metacarpal and phalangeal ele- ments were measured by digitizing the images. We regressed each log-transformed bone length against log-transformed stature using reduced major axis (RMA) regression, and compared the allometry coefficients. Our results demonstrated that, in all the examined hand bone elements, allometry coefficients were significantly larger than one, indicating positive allometry. It was also found that the allometry coefficients of the distal hand bones were generally larger than those of the proximal bones, indicating that the general allometric relationship previously reported for the main limb bones is also applicable to the hand bones. No statistical differences were observed in the allometric relationship between males and females for all the examined hand bones except the 5th middle phalanx, possibly owing to larger variabilities in female 5th middle phalanx length.
These results contribute to the understanding of normal growth and developmental patterns as well as to secular change of human hand proportions. Our results also provide some new insights into grasping biomechanics of the hand.
Key words: Allometric relationships, Hand bone lengths and stature, Metacarpals and phalanges, Planar radiography, Modern Japanese
Introduction
Human limb elements are known to scale allo- metrically with body size. Previous studies investigated the allometric relationships of the lengths of the humerus, radius, femur and tibia (Holliday and Ruff, 2001; Sylvester et al., 2008;
Auerbach and Sylvester, 2011). These studies demonstrated that the scaling relationships of
some of the limb elements were non-isometric and that the proximal limb elements scaled with comparatively smaller allometry coefficients than the distal elements. Therefore, as a general ten- dency in humans, if stature is higher, the lengths of the distal limb segments (radius and tibia) rel- ative to the proximal limb segments (humerus and femur) tend to be greater. However, such allometric relationships have not been investi-
gated in the other parts of the postcranium.
The present study aimed to investigate if this allometric tendency is also applicable to the human hand. Relationships between metacarpal length and stature have been analyzed for the purpose of stature estimation (Musgrave and Harneja, 1978; Kimura, 1992; Meadows and Jantz, 1992; Wilbur, 1998: Takai et al., 2005).
However, no studies have previously compared the allometric coefficients of all the metacarpals and phalanges of the hand to investigate their scaling relationships. Such information may con- tribute to our understanding of normal growth and development patterns of the human hand, secular changes of hand proportions, and aspects of grasping biomechanics.
Materials and Methods
In the present study, we used anteroposterior X-ray images of the right hands of a total of 197 adult participants (61 males and 136 females) who participated in the Ogi Growth Study per- formed by Saga University School of Medicine from 1979 to 1988 (Takai, 1990; Takai and Shi- noda, 1991). This study is a longitudinal growth study of Japanese students who resided in Ogi city, Saga prefecture, Japan. Along with standard anthropometric measurements, an anteroposterior X-ray image of the right hand was taken every year from an age of 6 to a maximum age of 18 years (all the X-ray films are currently housed in the Department of Anthropology, National Museum of Nature and Science). However, in the present study, we selected only the X-ray images (anonymized in an unlinkable fashion) of the hand after epiphyseal fusion, since our focus was on the adult hand.
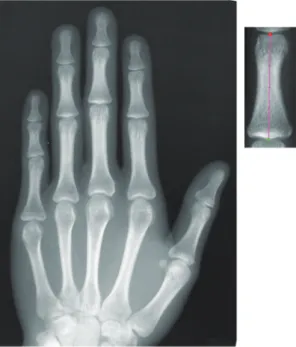
The X-ray films were scanned with a resolu- tion of 150 dpi (a pixel size of 0.169 mm) using a film scanner (EPSON GT-X980). On each digital image, the most proximal and distal ends of the metacarpals (MC), proximal phalanges (PP), middle phalanges (MP), and distal phalanges (DP) along the shaft axis were manually digi- tized. This was done using a custom-made soft-
ware named Dicom&16Tiff Viewer Ver.2.2 (Ogi- hara Lab., Dept. Mech. Eng., Keio University), and the distances between the proximal and dis- tal ends of the bones were calculated (Figure 1).
The measurement was conducted by one of the authors (S.A.), twice on a different day. The mean of the two values was used as the length of each MC or phalanx. The intra-observer error of the length measurement was approximately 0.3 mm for all the bones, corresponding to <1%
of the length of the MCs and PPs, and <2% of the MPs and DPs, indicating that the measure- ments were made in a highly reproducible fash- ion.
To explore the scaling relationships of the 19 metacarpal and phalangeal bones with stature, we regressed each of the log-transformed bone length against log-transformed stature using reduced major axis (RMA) regression (Hofman, 1988; Sjøvold, 1990), a model II linear regres- sion (R version 3.2.4, The R Project for Statisti- cal Computing) with custom packages. We used RMA regression because both bone lengths and
Fig. 1. Anteroposterior X-ray image of the hand (left) and enlargement of the MP3 part (right) showing two digitized points connected by a line segment representing the MP3 length.
stature were measured with errors. All regression analyses were performed separately for males and females. The allometry coefficients (slopes) and intercepts of the male and female regression lines were computed and statistically tested by Studentʼs t-test. Using the same software, we also tested if the regression line significantly deviates from one, i.e., geometric similarity.
The present study was approved by the Ethics Committee of the National Museum of Nature and Science.
Results and Discussion
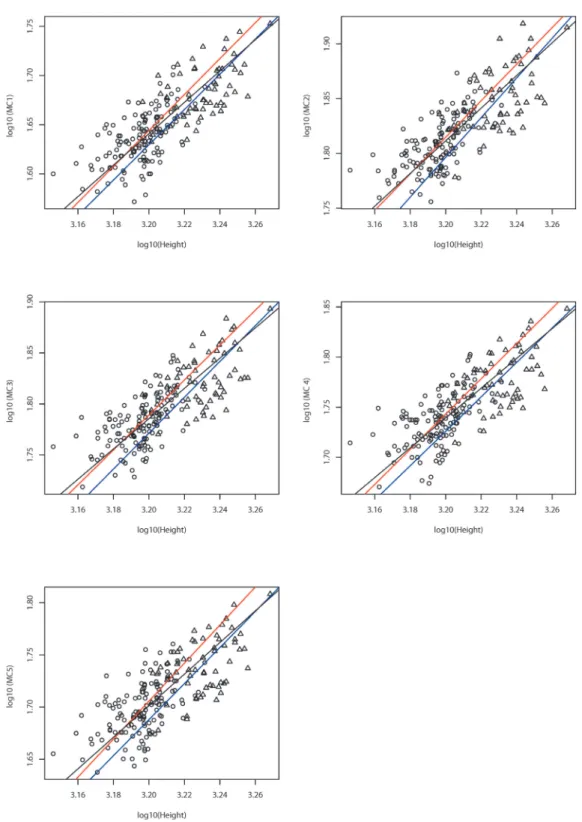
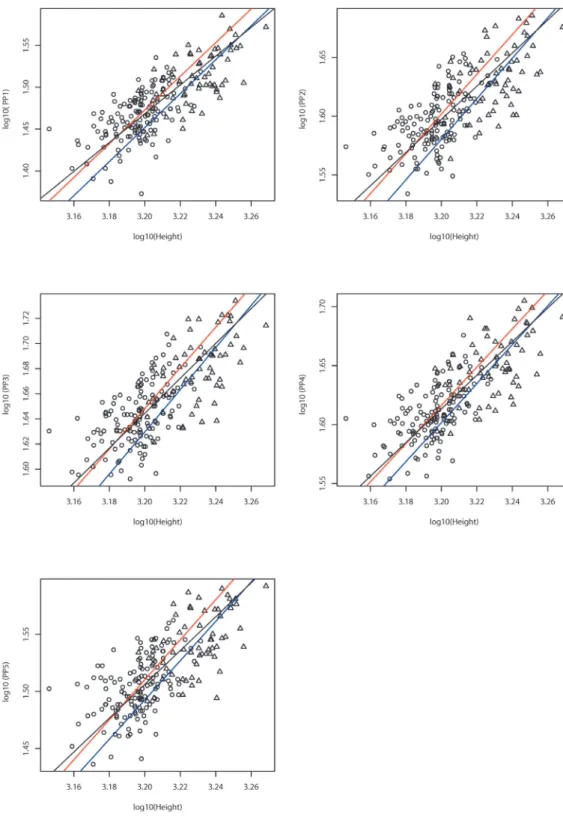
Bivariate plots with RMA regression lines of the log-transformed 19 hand bones relative to log-transformed stature are shown in Figure 2.
Table 1 lists the allometry coefficients and inter- cepts of the RMA regression lines of all 19 hand bones. For all hand bones, the allometry coeffi- cients and intercepts of the male regression lines were not statistically different from those of the female regression lines except for the regression lines for the MP5 (p<0.001). All regression lines significantly deviated from one, indicating that all the hand bones scale with positive allom- etry.
Figure 3 compares the allometry coefficients of the hand bones from the 1st to 5th rays. As the figure shows, the allometry coefficients for the MCs and PPs were smaller than those for the MPs and DPs in both males and females, indicat- ing that the two proximal elements scale with comparatively smaller allometry coefficients than the distal bones. We also observed that the allom- etry coefficients tended to increase with distance from the 3rd ray, particularly in females.
In the present study, we found that the proxi- mal bones scaled with comparatively smaller allometry coefficients than the distal bones in the human hand, as previously demonstrated for the four major limb bones (Holliday and Ruff, 2001;
Sylvester et al., 2008; Auerbach and Sylverster, 2011). Furthermore, Auerbach and Sylvester (2011) reported that the allometry coefficients of humerus, radius, femur and tibia are 1.03, 1.25,
1.12 and 1.28, respectively, for males and 1.03, 1.21, 1.17, and 1.35, respectively, for females, showing that the allometry coefficients of these proximal bones are smaller than those of hand bones. Therefore, there seems to exist a general tendency that distal elements grow faster in rela- tion to proximal element in human limbs. The mechanism underlying the emergence of this allometric relationship is beyond the scope of the present study, but it should be related to differen- tial skeletal growth defined by the expression of Hox genes (Reno et al., 2008) or differences in timing of epiphyseal fusion between proximal and distal elements. In addition, it was noted that the allometry coefficients tended to increase with distance from the 3rd ray, particularly in females.
The functional significances of these extracted allometric patterns are currently obscure. How- ever, it might be related to change in mechanical requirement of the human hand with increasing size. How the human hand proportion emerges in development and how changes in skeletal pro- portion of the hand affect manipulative capability should be investigated in future studies. It must be noted, however, Auerbach and Sylvester (2011) used a model I regression analysis to cal- culate the allometry coefficients and their sam- ples were of a mixed population from different geographical origins, indicating that direct com- parisons of the allometry coefficients were actu- ally impossible. To confidently conclude that there exists a general tendency that distal ele- ments grow faster in relation to proximal element in human forelimbs, the allometric relationships of the humerus, radius, metacarpals and phalan- ges should be more rigorously investigated using the same method and samples from the same population.
The present study also found that there is basi- cally no statistical difference in the allometric relationship between males and females except for the MP5. This is owing to the fact that the variance of the MP5 length was much larger in females than in males. There were a certain num- ber of female participants who had shorter-than- expected MP5 as shown in Figure 2. The same
Fig. 2. Bivariate plots with RMA regression lines of log-transformed hand bones relative to log-transformed stat- ure. Red circle, female; blue triangle, male. Red line, female regression line; blue line, male regression line.
Fig. 2. Continued.
tendency, although not significant, can be observed in DP1. We can offer no explanations as to why this occurs, but distal hand bones dis- tant from the 3rd ray, i.e. the center of the hand, may be developmentally more variable than other hand bones.
As mentioned before, the length of metacar- pals has been used to estimate the stature (Mus- grave and Harneja, 1978; Kimura, 1992; Mead- ows and Jantz, 1992; Wilbur, 1998; Takai et al., 2005). The regression equations derived in the present study can also be used for stature estima- tion. In the previous studies, however, the length of metacarpals was directly regressed with stat- ure without logarithmic transformation, assum- ing that the allometric relationship between the
metacarpal length and the stature was relatively minor. Furthermore, the previous studies used ordinary least square regression (model I) whereas the present study used RMA regression (geometric mean regression of model II). When the two variables both contain error as in the present case, a model I (Y on X) regression tends to underestimates the slope, thus resulting in overestimation of the shortest individuals and underestimation of the tallest (Sjøvold, 1990).
Therefore, the present approach might have pro- vided theoretically better equations for stature estimation based on the length of metacarpals.
However, this must also be confirmed in future studies.
Here we have focused on the adult hand using
Fig. 2. Continued.
Fig. 2. Continued.
Table 1. Allometry coefficients and intercepts of the RMA regression lines
Slope 95% confidence interval Intercept 95% confidence interval
MC1 Male 1.79 1.45 2.22 −4.11 −5.48 −3.00
Female 1.83 1.59 2.10 −4.20 −5.07 −3.45
Combined 1.60 1.46 1.75 −3.46 −3.95 −3.02
MC2 Male 1.81 1.45 2.26 −4.00 −5.45 −2.85
Female 1.67 1.46 1.91 −3.53 −4.29 −2.86
Combined 1.49 1.36 1.64 −2.96 −3.42 −2.55
MC3 Male 1.76 1.41 2.20 −3.85 −5.27 −2.72
Female 1.71 1.49 1.96 −3.69 −4.49 −2.99
Combined 1.48 1.35 1.63 −2.96 −3.43 −2.54
MC4 Male 1.72 1.37 2.15 −3.77 −5.17 −2.66
Female 1.76 1.53 2.03 −3.89 −4.75 −3.14
Combined 1.49 1.35 1.64 −3.02 −3.51 −2.58
MC5 Male 1.73 1.38 2.16 −3.84 −5.24 −2.72
Female 1.82 1.58 2.10 −4.12 −5.02 −3.35
Combined 1.51 1.37 1.67 −3.14 −3.64 −2.69
PP1 Male 2.03 1.65 2.49 −5.03 −6.54 −3.81
Female 2.01 1.74 2.32 −4.96 −5.94 −4.11
Combined 1.72 1.56 1.89 −4.03 −4.58 −3.54
PP2 Male 1.73 1.38 2.16 −3.94 −5.35 −2.82
Female 1.69 1.47 1.95 −3.81 −4.63 −3.10
Combined 1.41 1.28 1.56 −2.92 −3.39 −2.49
PP3 Male 1.68 1.35 2.09 −3.74 −5.08 −2.67
Female 1.62 1.40 1.87 −3.53 −4.33 −2.83
Combined 1.39 1.26 1.53 −2.80 −3.26 −2.38
PP4 Male 1.65 1.32 2.07 −3.68 −5.04 −2.60
Female 1.62 1.41 1.87 −3.57 −4.36 −2.89
Combined 1.43 1.30 1.57 −2.95 −3.41 −2.53
PP5 Male 1.72 1.37 2.16 −4.01 −5.42 −2.89
Female 1.75 1.51 2.03 −4.10 −5.00 −3.32
Combined 1.48 1.34 1.64 −3.23 −3.74 −2.78
MP2 Male 1.96 1.55 2.47 −4.95 −6.59 −3.64
Female 2.13 1.84 2.46 −5.47 −6.54 −4.55
Combined 1.68 1.51 1.86 −4.03 −4.62 −3.50
MP3 Male 1.82 1.45 2.28 −4.42 −5.92 −3.23
Female 1.83 1.58 2.13 −4.44 −5.38 −3.63
Combined 1.50 1.35 1.67 −3.39 −3.91 −2.91
MP4 Male 1.89 1.51 2.37 −4.67 −6.22 −3.44
Female 1.92 1.66 2.23 −4.76 −5.74 −3.91
Combined 1.60 1.45 1.77 −3.73 −4.28 −3.23
MP5 Male 2.63 2.08 3.32 −7.21 −9.45 −5.44
Female 4.27 3.63 5.02 −12.44 −14.82 −10.41
Combined 2.89 2.57 3.26 −8.06 −9.24 −7.01
DP1 Male 2.33 1.81 3.00 −6.18 −8.33 −4.51
Female 2.71 2.30 3.19 −7.36 −8.89 −6.06
Combined 2.13 1.89 2.39 −5.51 −6.36 −4.76
DP2 Male 1.98 1.56 2.52 −5.16 −6.90 −3.78
Female 2.11 1.81 2.47 −5.56 −6.71 −4.57
Combined 1.80 1.62 2.01 −4.57 −5.22 −3.98
DP3 Male 1.89 1.48 2.42 −4.82 −6.53 −3.48
Female 2.07 1.78 2.41 −5.39 −6.47 −4.46
Combined 1.79 1.61 1.99 −4.50 −5.13 −3.93
DP4 Male 2.00 1.58 2.53 −5.17 −6.88 −3.81
Female 2.03 1.75 2.37 −5.25 −6.32 −4.34
Combined 1.85 1.68 2.05 −4.69 −5.31 −4.12
DP5 Male 2.40 1.89 3.04 −6.49 −8.57 −4.86
Female 2.28 1.95 2.67 −6.11 −7.35 −5.05
Combined 1.97 1.77 2.19 −5.10 −5.83 −4.45
Bold text at MP5 indicates a statistically significant difference between male and female with a p-value less than 0.05.
the X-ray images of hands taken after epiphyseal fusion, and thus did not study the ontogenetic changes of the hand bones. However, longitudi- nal-growth radiographs of the same participants are available, along with standard anthropometric measurements. Continued investigations of developmental change of hand bone lengths are necessary to further clarify some of the quesitons raised above.
Acknowledgement
We would like to extend our appreciation to the Editor of this journal, Dr. Kazuhiro Sakaue for his generous help. The manuscript was improved with valuable suggestions and com- ments from anonymous reviewers.
References
Auerbach, B. M., and Sylvester, A. D. 2011. Allometry and apparent paradoxes in human limb proportions:
Implications for scaling factors. American Journal of Physical anthropology, 144: 382–391.
Hofman, M. A. 1988. Allometric scaling in palaeontol- ogy: A critical survey. Human Evolution, 3: 177–188.
Holliday, T. W. and Ruff, C. B. 2001. Relative variation in human proximal and distal limb segment lengths.
American Journal of Physical Anthropology, 119:
26–33.
Kimura, K. 1992. Estimation of stature from second metacarpal length in Japanese children. Annals of Human Biology, 19: 267–275.
Meadows, L. and Jantz, R. L. 1992. Estimation of stature from metacarpal lengths. Journal of Forensic Science, 37: 147–154.
Musgrave, J. H. and Harneja, N. K. 1978. Estimation of adult stature from metacarpal bone length. American Journal of Physical Anthropology, 48: 113–119.
Reno, P. L., McCollum, M. A., Cohn, M. J., Meindl, R.
S., Hamrick, M. and Lovejoy, C. O. 2008. Patterns of correlation and covariation of anthropoid distal fore- limb segments correspond to Hoxd expression territo- ries. Journal of Experimental Zoology (Mol Dev Evol), 310N: 240–258.
Sjøvold, T. 1990. Estimation of stature from long bones utilizing the line of organic correlation. Human Evolu- tion, 5: 431–447.
Sylvester, A. D., Kramer, P. A. and Jungers, W. L. 2008.
Modern humans are not (quite) isometric. American Journal of Physical Anthropology, 137: 371–383.
Takai, S. 1990. Smoothed skeletal maturity curve of Japanese children by Tanner-Whitehouse 2 (TW2) method and its application. Kaibogaku Zasshi (Acta Anatomica Nipponica), 65: 436–447 (In Japanese).
Takai, S. and Shinoda, K. 1991. The mid- and adolescent growth spurts of some somatic dimensions analyzed by a smoothing cubic B-spline function. Bulletin of Insti- tute of Health and Sport Science, University of Tsu- kuba, 14: 119–130 (In Japanese).
Takai, S., Takiuchi, M. and Matsuʼura, S. 2005. Estimat- ing stature from metacarpal lengths. Anthropological Science, 113: 328 (Abstract).
Wilbur, A. K. 1998. The utility of hand and foot bones for the determination of sex and the estimation of stature in a prehistoric population from West-Central Illinois.
International Journal of Osteoarchaeology, 8: 180–
191.
Fig. 3. Allometry coefficients of the metacarpals and phalanges from the 1st to 5th rays. A, male; B, female.