POLAR TOURISM AS
AN EFFECTIVE RESEARCH TOOL
Citizen Science in the Western Antarctic Peninsula
REGULAR ISSUE FEATURE
By Allison M. Cusick, Robert Gilmore, Annette Bombosch, Martina Mascioni, Gastón O. Almandoz, and Maria Vernet
Reaching into the unknown, citizen scientists collect seawater samples to help researchers answer questions of the changing polar envi- ronment. Photo credit: Allison Cusick
INTRODUCTION
The poles are the fastest warming regions on Earth, garnering global attention from scientists, policymakers, and the pub- lic (Larsen et al., 2014). Yet, not enough is known about their ecosystem struc- tures and functions to predict how they will change in future climate scenarios. In the Southern Hemisphere, the Western Antarctic Peninsula (WAP) has warmed rapidly in the second half of the twentieth century, resulting in retreat of more than 87% of its marine glacier fronts (Cook et al., 2016; Turner et al., 2016). It is crit- ical to understand how glacial meltwater patterns impact phytoplankton commu- nities in coastal fjords because any shifts in primary production can affect higher trophic level organisms in the near- shore food web.
The high-latitude oceans are noto- riously difficult to monitor because of their harsh environments. Research is logistically challenging; surface moor- ings are ineffective due to the presence of sea ice and frequent collisions with ice- bergs; ocean color satellites using vis- ible light are hampered by persistent cloud cover; and research vessels can provide in-depth sampling only during short time periods. Although several nations have research programs that col- lect long-term data, most are restricted to short time periods (e.g., one month) or at static locations (Henley et al., 2019).
As a result, we have relatively sparse spa-
tial and temporal year-round coverage of the WAP’s 1,300 km nearshore waters compared to more accessible regions in the world. Knowledge of seasonal pat- terns is patchy, and studies provide vary- ing evidence of how these ecosystems will respond at regional scales (Moline et al., 2004; Constable et al., 2014).
The WAP coastline has hundreds of islands, straits, fjords, and embayments where glaciers deliver ice and melt water.
These nearshore locations appear to be hotspots of biodiversity with high bio- logical productivity (Vernet et al., 2008).
They provide refuge and are aggregation zones for baleen whales (Nowacek et al., 2011), penguins, and seals (e.g., Santora and Reiss, 2011; Bernard and Steinberg, 2013) whose foraging efforts coincide with krill distribution (Espinasse et al., 2012). Additionally, the fjords’ seafloors harbor an abundance of benthic ani- mals such as amphipods, polychaetes, and echinoderms (Grange and Smith, 2013). These pelagic and benthic animal aggregations within the nearshore may be fueled by intense phytoplankton blooms that occur throughout the summer and fall (Smith et al., 2008). This “invisible forest” (Falkowski, 2002) of microscopic organisms plays a large role in providing oxygen to the environment and cycling carbon. Seasonal shifts in phytoplankton taxa are significant in the WAP, follow- ing changes in day length (e.g., Rozema et al., 2017; Schofield et al., 2017). Using
improved molecular tools, understanding the shifts in phytoplankton taxonomic groups down to the species level can shed light on their functional roles (e.g., Lin et al., 2017). Furthermore, integrating molecular techniques with taxonomical analysis will reveal species diversity shifts in this invisible forest (Figure 1) with future climate scenarios. Understanding such dynamics requires gathering data repeatedly, over a full season, for many years or even decades (Magnuson, 1990).
How could this type of coverage be achieved over the long term?
One platform that has not yet been lev- eraged is the fleet of tour expedition ves- sels run by members of the International Association of Antarctica Tour Operators (IAATO) for visits to the WAP during five months of each year. These ships cover hundreds of nautical miles, mak- ing daily landings repeatedly over a sea- son (Bender et al., 2016). Although Antarctica is devoid of permanent resi- dents and indigenous peoples, between researchers, fishers, and travelers, there is a considerable human presence. The ship- based tourism community is growing, with an estimated 59,367 visitors mak- ing landings in 2019/2020, outnumbering scientists more than 10 to one (IAATO, 2019a). Partnership with these vessels would allow sampling over a larger tem- poral and spatial extent, and could prove an effective method for characterizing phytoplankton community succession in response to glacial melt water within near- shore fjord ecosystems.
These vessels also allow valuable opportunities for citizen science (CS), or Public Participation in STEM Research (PPSR), with travelers helping to col- lect reliable data that can be published in peer-reviewed scientific literature (McKinley et al., 2017). There are more than 3,000 active CS projects around the globe (see https://scistarter.org/), and the field is currently developing best practices (Shirk et al., 2012). CS provides a way to fill gaps in research while increasing enthusiasm for science among the public (Kennicutt et al., 2014; Miller, 2016).
ABSTRACT. The Antarctic Peninsula is one of the fastest warming regions in the world, with over 87% of its glaciers in retreat. The resulting influx of glacial melt water to the coastal ecosystems may influence the succession patterns of primary producers.
It is critical to document these dynamics, gathering time-series data throughout the seasonal growth period, because any shifts in primary production can affect higher trophic level organisms in the nearshore food web. The Antarctic tourism industry maintains a fleet of vessels that visit the peninsula’s nearshore waters throughout the austral summer, November to March. We developed a citizen science (CS) program—
FjordPhyto—to leverage these vessels as platforms for gathering data about the region.
Trained staff and travelers collect environmental data and biological samples that are sent to researchers. Preliminary results include phytoplankton species identification, cell abundance determination, carbon biomass estimates, and euphotic depth mea- surement at multiple sites. We show that CS is a valid tool that can enhance research in Antarctica, while also providing an enriching experience to travelers interested in learning more about science in polar environments.
CITIZEN SCIENCE PROJECT DEVELOPMENT
Following the US government’s Federal Crowdsourcing and Citizen Science Toolkit (US Federal Government, 2019), we developed the FjordPhyto project so that staff and travelers on Antarctic tour vessels could contribute to research questions investigating a succession of phytoplankton communities within coastal fjords. The toolkit includes five basic steps for planning, designing, and carrying out a CS project (adapted from Bonney et al., 2009): (1) scope your
problem, (2) design a project, (3) build a community, (4) manage your data, and (5) sustain and improve. Additional resources from the Biological Sciences Curriculum Study (BSCS) within the National Science Foundation (Edelson, Kirn, et al., 2018), along with a workflow Logic Model sheet from the CitSci2017 workshop (Phillips et al., 2014), were used to further guide the initial develop- ment of the project.
The following describes the five basic steps considered during the design and development of the FjordPhyto project.
STEP 1: SCOPE YOUR PROBLEM Scientific Rationale
As glaciers melt along the coast, they deliver ice and freshwater to the marine environment with a maximum signal late in the summer (Dierssen et al., 2002). It is unknown how the freshwater influx from these coastal tidewater glaciers will influ- ence the ecosystem at the level of primary producers (i.e., phytoplankton; Hernando et al., 2015). It has been hypothesized that freshwater provides a stratified environ- ment beneficial for phytoplankton blooms (Dierssen et al., 2002), and studies show
FIGURE 1. Microscope images of phytoplankton taxa from samples collected in the nearshore regions of the Western Antarctic Peninsula display dif- ferent shapes and sizes. (a) Diatom Coscinodiscus bouvet, (b) cryptophytes with diatom (note size differences), (c) small dinoflagellates, (d) Naviculoid diatom, (e) chain-forming diatom genus Thalassiosira, (f) dinoflagellate genus Peridiniella, (g) prasinophyte genus Pyramimonas, (h) cryptophytes, and (i) silicoflagellate Dictyocha speculum. (a–e) Light microscope scale bar is 10 µm. (f – i) Scanning electron microscope scale bar is 2 µm.
a
d
g
b
e
h
c
f
i
there can be cryptophyte abundance in mixed layers enriched in meltwater (Moline et al., 2004; Mendes et al., 2013), although other environmental factors can be equally important (e.g., Brandini and Rebello, 1994; Lange et al., 2015; De Lima et al., 2019). Present-day observations indicate that WAP coastal waters have an early spring diatom bloom from October through November, presumably related to sea ice retreat (Ross et al., 2000; Kim et al., 2018), and a later summer diatom bloom occurring in January. Before and after diatom blooms, smaller flagellates (e.g., cryptophytes) dominate (Kozlowski et al., 1995; Rozema et al., 2017).
Different taxa contribute varying amounts of carbon biomass to the ecosys- tem (Garibotti et al., 2005). Regardless of the phytoplankton succession in any given season, it remains unclear how shifts will affect higher trophic level organisms in the nearshore food web (Corbisier et al., 2004; Saba et al., 2014). This knowledge is crucial to understanding recruitment of larval Euphausia superba—Antarctic krill—a key zooplankton species of the
Southern Ocean (Ross et al., 1996) that feeds higher trophic levels. Krill select for larger diatom and chain-forming phyto- plankton (Haberman et al., 2003) for reproductive success; thus, changes in phytoplankton communities may affect krill populations (Nicol et al., 2010) as well as nearshore food webs containing fish and amphipods (Sailley et al., 2013).
Sampling of both phytoplankton and meltwater along the WAP may help pre- dict future changes.
Objectives
FjordPhyto has both scientific and educa- tional objectives:
1. Scientific aims: (a) Determine the seasonal and interannual changes in meltwater intrusion at fjords and coastal embayments at multiple sites, and (b) characterize the phytoplank- ton community diversity and species succession during the austral growth period (November to March).
2. Education and broader impact aims:
(a) Create a sampling program under which travelers can participate in
the scientific process with the guid- ance of trained staff; (b) gather data at popular landing sites near glaciers, creating a time-series data set; and (c) increase ocean literacy of travelers through education and participation in CS projects.
STEP 2: DESIGNING A CITIZEN SCIENCE PROJECT
The FjordPhyto project is designed to be an engaging bonus activity that comple- ments the cruise experience without com- peting for time allotted to other activi- ties offered. During each voyage, travelers learn about FjordPhyto as a CS project that will be carried out during their trip.
Informative talks are offered by staff, information is posted around the ship, and announcements are made. At each site of interest, staff leading the project organize interested travelers to board a rubber inflatable boat typically seating five to 18 people (Figure 2). Sampling can be carried out during either landing or cruis- ing excursions to or from shore. Once the group reaches the GPS location, ship’s
FIGURE 2. Travelers assist trained tour ship staff in collecting phytoplankton samples from the field. Photo credit: Robert Gilmore
staff distribute tasks among participants.
Staff explain the protocols and the impor- tance of research on Antarctic fjord eco- systems and assist travelers in sampling (Cusick, 2018a; Sear, 2018; respectively).
Training
A high priority was designing a sampling program using easy-to-operate scien- tific equipment and sampling protocols.
Protocols and videos were developed, field tested, and refined with staff input (Lee, 2017). Before each field season, researchers meet with ship staff in person or via teleconference to identify sampling locations and to discuss the transfer of necessary gear to the ship as well as end- of-season logistics, including sending data and samples to Ushuaia, Argentina, and California, United States. Continuous communication and feedback via email throughout the seasons further guide development of this program.
Choosing Sample Locations
Samples are taken from November to March at several locations along the WAP between King George Island (62°S, 58°W) and Marguerite Bay (near 68°S,
68°W; Figure 3). IAATO uses a ship scheduling tool that allows management of landing site visits in accordance with the Antarctic Treaty System (ATS) and IAATO requirements for minimal or transitory impact on the environment.
This coordination is based on the legally binding agreement signed as Measure 15 (2009) during the Antarctic Treaty Consultative Meeting (ATCM) XXXII (IAATO, 2009) and provides a reliable method for determining sites that might be visited during each season.
The specific sampling locations for FjordPhyto are chosen based on popular landing sites located near tidewater gla- ciers (Figure 3). Other considerations include logistical ease for cruise opera- tors to conduct the activity based on time restrictions at that site and the frequency of IAATO-member ships visiting those sites. Landing sites are regulated (via ATS and IAATO requirements) to restrict the number of vessels that can visit any site at a given time. Typically, ships follow a predictable yet flexible itinerary travel- ing similar routes. This coordination per- mits many sites to be visited repeatedly over the season.
Sampling Meltwater
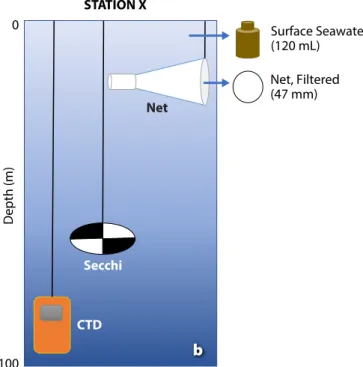
CTD Measurements. Using an annually calibrated SonTek CastAway® CTD, par- ticipants collect water column profiles of temperature and salinity at each sam- pling location (Figure 3). The CTDs are deployed manually and can withstand pressures to 100 m (Figure 4). The range and accuracy of the device is based on company-calibrated specifications with an accuracy of 0.25% of measured value and a drift that does not exceed 0.075°C per year for temperature and 0.380%
per year for salinity. Data that are later exported to researchers for defining the presence of meltwater and calculat- ing mixed layer depths include pressure, depth, temperature, conductivity, spe- cific conductance, salinity, sound veloc- ity, and density (Thomson and Fine, 2003;
Pan et al., 2019).
Secchi Depth. With supervision, CS par- ticipants measure water turbidity by sub- merging a Secchi disk to the depth where it disappears (the oldest turbidostat known to oceanography; Wernand, 2010;
Figure 4). The Secchi disk-determined depth can provide excellent informa- tion on light attenuation and can be used to calculate euphotic depth (Zeu) where photosynthetic available radiation is 1%
of its surface value in the water column (Figure 5; Aas et al., 2014). In this project, commercially available disks were used for the estuarine coastal environment known to have higher turbidity and vary- ing optical properties due to melt water and tidal variations compared to those of the open ocean (Hou et al., 2007).
Sampling Phytoplankton Communities
CS participants collect surface phyto- plankton samples (Figure 4). These sam- ples are later analyzed in the laboratory by microscopy for cell abundance and carbon biomass, and by high-throughput sequencing for species diversity and func- tion. Under the constraints of this proj- ect, only surface phytoplankton can be evaluated, and replicates are taken when
FIGURE 3. A map of the Western Antarctic Peninsula shows the locations of samples collected from 2016 to 2019. The map was created using QGIS Desktop 2.18.24.
Years Sampled 2016–2017
2016–2017; 2017–2018 2017–2018; 2018–2019
2016–2017; 2017–2018; 2018–2019
Marguerite Bay
King George Island
possible. Permits are not needed to sam- ple phytoplankton from seawater as per the United States Antarctic Program fol- lowing the Antarctic Conservation Act (ACA of 1978, NSF 01-151).
Microscopy. Surface seawater (0–5 m depth) is collected and preserved by filling pre-rinsed amber HDPE bot- tles (120 mL) and adding a Lugol’s solu- tion (4% final concentration; Edler and Elbrächter, 2010), which is a less toxic preservation option that stains more fragile organisms. Samples are kept in a cool, dark place until the end of the sea- son, when they are offloaded and sent to Universidad Nacional de La Plata, Argentina, for researchers to analyze (as described in detail in Mascioni et al., 2019). The measurement error is <10%
with 400 cells counted per sample.
Molecular Genetics. A SEA-GEAR Cor- poration plankton net (20 µm mesh) is towed at idle speed for 10 minutes to con-
centrate surface phytoplankton (0–5 m, Figure 4a). The sample is then filtered (0.2 µm) using a hand-operated vacuum pump. Filters are inserted into pre-filled tubes with Invitrogen RNAlater Stabili- zation Solution and frozen on board the ship until the end of the season. In the absence of deep-freezing capabilities, this nontoxic reagent rapidly permeates cells to stabilize and protect genetic material.
According to manufacturer specifica- tions, genetic material can be protected from potential degradation if left at room temperature for up to one week. This ben- efit allows samples to be unfrozen during air transit to San Diego, California, where researchers then freeze tubes until they can be processed.
Educational Outreach
Aboard a tour vessel, every day pro- vides multiple opportunities for educa- tion. Formal and informal lectures are typically offered by staff and guest sci- entists on topics that include explo-
ration, natural history, and science.
FjordPhyto provides lecture slides detail- ing aspects of oceanography and the importance of phytoplankton in the polar and global ecosystems. Vessels that do not have microscopes on board are given a Celestron TetraView LCD Digital Compound Microscope and the book Plankton by Christian Sardet (2015) for further engagement with the phyto- plankton world. A portion of the plank- ton net tow can be reserved for viewing on board, offering additional opportuni- ties for teaching about the invisible forest and primary producers.
STEP 3: BUILDING A COMMUNITY Establishing Capacity
Before launching any CS project, it is important to establish the capacity of interested partners. IAATO members work together within the ATS framework to deliver safe, environmentally respon- sible operations in Antarctica. One of IAATO’s missions is to support science in
FIGURE 4. Sampling methods. (a) Citizen scientists assist staff with a phytoplankton net tow. Photo credit: Mathew Farrell (b) Schematic of sampling methods. Two measurements (CTD and Secchi depth) and two samples are collected at each station. Surface seawater is collected in bottles for examination by microscopy to determine cell abundance and carbon biomass, and high-throughput sequencing of net-collected phytoplankton provides data on species diversity and function.
Net
Secchi
CTD STATION X 0
100
Depth (m)
Surface Seawater (120 mL)
Net, Filtered (47 mm)
a
b
various ways. They report their activities annually under the ATCM, making this information, including annual reports, tourism statistics, and guidelines for trav- elers and tour operators, available pub- licly on their website (IAATO, 2019b).
In addition, FjordPhyto researchers pre- sented at various conferences before and during the project’s launch to gain per- spective from multiple stakeholders, including private-sector tour operators and staff, polar researchers, grant pro- gram managers, and CS practitioners (Cusick, 2017a,b).
Pilot and Launch
FjordPhyto was tested during the 2016–2017 season with two IAATO- member operators (see section below on Phytoplankton Diversity in Fjords;
Mascioni et al., 2019). With funding for subsequent seasons, sampling efforts were expanded (detailed herein), and part- nerships with tour operators increased (Table 1). An estimated 2,500 travelers have directly participated in sample col-
lection since the launch of the program, with additional participants attending the onboard lectures. FjordPhyto is open to all interested IAATO ships; however, we have not been able to fully accommo- date increasing interest and integrate new partners due to program funding con- straints (see Discussion).
STEP 4: DATA MANAGEMENT One of the most common questions and recognized concerns about CS is data quality. Many CS studies have shown that these challenges can be successfully managed (Wiggins et al., 2011; Miller- Rushing et al., 2012) to provide valid results publishable in peer-reviewed sci- entific journals (Crall et al., 2011). To reduce the possibility of poorly collected data, researchers chose user-friendly equipment and developed clear protocols to ensure sampling consistency among all participants. Researchers train the ship staff annually in person at meetings and on ships in the field, with reinforcement via teleconference. The same gear is dis-
tributed to all ships, and instrumentation is calibrated annually by the manufac- turer. Researchers participate in cruises to take additional replicates. All data files are transferred to researchers who iden- tify missing or erroneous information.
Additionally, quality control procedures exist for downstream sample processing to ensure the integrity of microscopy and genetic samples.
To date, samples are being processed and form the basis of two PhD theses.
Once published in scientific journals (e.g., Mascioni et al., 2019), the environ- mental data will be sent to a long-lived repository (e.g., BCO-DMO), and meta- data will be deposited in the Antarctic Master Directory. Genetic sequencing data will be stored in online databases (e.g., GenBank BioProject).
STEP 5: SUSTAIN AND IMPROVE To sustain and improve a CS project, there must be communication among the scientists, operators, staff, and trav- elers. In addition to coordinating logis- tics and analyzing samples for publica- tion, researchers must be available to solve issues that occur during the season, gauge strengths and weaknesses of the program, share results in a timely man- ner, and secure funding to ensure the project’s longevity.
The impact of the FjordPhyto pro- gram is gauged in two ways. First, are samples scientifically relevant and do they advance knowledge of this region?
Peer review will help determine whether the data are of sufficient quality to pro- vide scientific merit (e.g., Mascioni et al., 2019). Second, is there a posi- tive impact on travelers’ participation and learning? The latter question is par- tially evaluated by distributing question- naires to staff and travelers, asking for feedback and suggestions for improve- ments. The responses received (Table 1) help guide further project development (see Discussion).
The personal contact information of participants is not shared with the researchers for privacy reasons. Therefore,
FIGURE 5. Time-series data at select locations (shapes) showing euphotic depth (Zeu) for (a) 2017/2018, and (b) 2018/2019. Values were calculated using the Secchi depth (Ds) to obtain diffuse attenuation coefficient (Kd) in the equation Kd ~ 1.7/Ds and euphotic depth using Zeu = LN(0.01)/Kd, where 0.01 is 1% irradiance at depth (Iz) to surface (I0); Iz/Io = 0.01 (as in Aas et al., 2014).
LOCATION NAME Cierva Cove Cuverville Island Danco Island Neko Harbor Paradise Bay Wilhelmina Bay 0
20 40 60 80
0 20 40 60 80
Zeu (m)
Nov Dec Jan Feb Mar
Zeu (m)
a Nov
b
Dec Jan Feb Mar
2017 13 14 19 22 23
2 22 28 5 8 9 10 13 15 16 20 24 25 26 28 31 5 9 15 18 19 21 26 27 2 3 5 11 12 15 18 19 20 21 24 26 8 10 19 2 9 13 14 15 16 18 19 20 25 28 30 2 4 5 6 7 11 19 20 3 5 6 12 16 17 18 20 2 3 10 11 17
2018
2018
2019
in an effort to maintain engagement and disseminate results, we developed a web- site (https://www.fjordphyto.org) and social media accounts (@FjordPhyto on Facebook, Twitter, and Instagram) where we post updates. We also present our proj- ect to the scientific and CS communities by attending and speaking at conferences (Cusick, 2018b,c, 2019; Mascioni, 2019).
PHYTOPLANKTON DIVERSITY IN FJORDS
The identity, abundance, and bio- mass of the phytoplankton sampled in FjordPhyto’s first year reveal the sea- sonal development of phytoplankton communities at varying sites, north to south (Figures 3, 5, and 6). For example, Figure 6 shows data from Cierva Cove (64°09'18''S, 60°55'12''W), Wilhelmina Bay (64°37'13.44''S, 62°12'07.14''W), and Neko Harbor (64°50'34.44''S,
62°32'13.13''W). At these three sites, small flagellates were present during the entire sampling period and usually dom- inated the phytoplankton community at the beginning of the season. Most of the phytoplankton carbon biomass (as esti- mated using cell-volume conversion described in Mascioni et al., 2019) came from large cells, diatoms, and dinofla- gellates, although prasinophyceans were also important in Neko Harbor during January (Figure 6). In Wilhelmina Bay, in mid-December, there was a crypto- phyte bloom of organisms morpholog- ically related to the genus Plagioselmis, presumably a new species for Antarctica (Mascioni et al., 2019). During this first season of sampling, we also iden- tified two other flagellate blooms, Pyramimonas sp. in Neko Harbor, and an unidentified unarmored dinoflagellate at Danco Island (data not shown).
DISCUSSION
After three years of operation, we con- sider FjordPhyto a successful CS proj- ect, proven to be feasible in the field. It provided scientifically relevant samples, and it was well received by IAATO oper- ators and travelers (Table 1). We attri- bute its success to the efforts of dedicated staff and scientists who provided travelers with a meaningful experience.
When scoping the problem, we started by setting realistic goals regard- ing the project’s capacity, scale, partici- pant interests, and scientific priorities.
Due to the difficulty in collecting data from this region, we consider CS a benefi- cial approach to addressing questions on phytoplankton community succession, and further, relating that to meltwater over the growth season. Although sam- ples are limited to ship-visited locations, involving more ships can extend the spa-
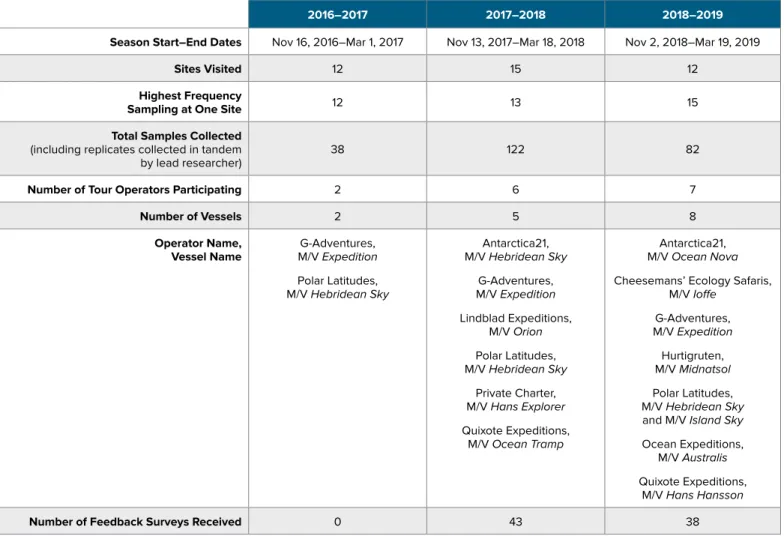
TABLE 1. Sampling results of three seasons (2016–2019).
2016–2017 2017–2018 2018–2019
Season Start–End Dates Nov 16, 2016–Mar 1, 2017 Nov 13, 2017–Mar 18, 2018 Nov 2, 2018–Mar 19, 2019
Sites Visited 12 15 12
Highest Frequency
Sampling at One Site 12 13 15
Total Samples Collected (including replicates collected in tandem
by lead researcher) 38 122 82
Number of Tour Operators Participating 2 6 7
Number of Vessels 2 5 8
Operator Name,
Vessel Name G-Adventures, M/V Expedition Polar Latitudes, M/V Hebridean Sky
Antarctica21, M/V Hebridean Sky
G-Adventures, M/V Expedition Lindblad Expeditions,
M/V Orion Polar Latitudes, M/V Hebridean Sky
Private Charter, M/V Hans Explorer Quixote Expeditions,
M/V Ocean Tramp
Antarctica21, M/V Ocean Nova Cheesemans’ Ecology Safaris,
M/V Ioffe G-Adventures, M/V Expedition
Hurtigruten, M/V Midnatsol Polar Latitudes, M/V Hebridean Sky and M/V Island Sky Ocean Expeditions,
M/V Australis Quixote Expeditions,
M/V Hans Hansson
Number of Feedback Surveys Received 0 43 38
tial and temporal sampling.
Samples collected from November to March allow us for the first time to obtain seasonal data from these pre- viously underexplored nearshore sites along the WAP in a cost-effective way.
The results to date (Figures 5 and 6; Mascioni et al., 2019) are more encour- aging than expected, with unknown spe- cies being discovered. Although the sea- sonal progression follows the expected response to day-length changes, there is large variability in the timing of abun- dances of different taxa. We expect this variability is in part due to physical prop- erties, particularly those related to melt- water input from the glaciers (Dierssen et al., 2002). We will be able to test this
hypothesis with further analysis of data collected during subsequent seasons.
Sampling methods chosen for FjordPhyto avoid the need for ultra- freezer space (e.g., liquid nitrogen) to store and transport easily-degradable bio- logical material. Therefore, compromises were made as to what types of data could be collected to best address our scientific aims. We consider surface sampling to be representative of the mixed layer phyto- plankton (Garibotti et al., 2005; Pan et al., 2019), albeit some error is expected and will be addressed as time and instrumen- tation permits. This project would addi- tionally benefit from analysis of inorganic nutrients and chlorophyll concentrations;
however, samples must remain frozen
until analysis. To best address the objec- tive of determining seasonal and inter- annual intrusion of meltwater through salinity data, a first-order effort will be based on salinity and optics, as devel- oped by Pan et al. (2019). Further efforts to quantify the fraction of meltwater from sea ice versus glacial melt requires δ18O oxygen isotope analysis (Meredith et al., 2013) and is considered in planning for future sampling efforts.
Building an Antarctic CS commu- nity relies on support from tour opera- tors, staff, and travelers. Within the travel industry, CS projects must be integrated into an already full schedule of activities.
FjordPhyto was designed to fit within a one-hour time window that would com- plement normal operations. If CS pro- grams are to be successful on board, staff need to be given time to make proj- ects a priority.
A unique problem in this collabora- tion is the frequent turnover and rotation of staff mid-season. Because these remote regions lack a reliable Internet connec- tion, researchers must speak with all CS-identified staff at the beginning of the season to discuss potential issues that may arise such as broken or lost equipment and to avoid the “telephone effect” and the degradation of instructions. To ensure that instructions are clear, we also provide in-person training and detailed protocols for reference once the season is underway.
The main consensus from many CS practitioners and participants empha- sizes the importance of feedback from the scientists themselves. FjordPhyto results are shared through putting post- trip materials online and distributing annual reports to the tour operators, who may distribute these materials directly to travelers. It is important that opera- tors and CS participants understand the timeline of the scientific process as well.
It may take months to years to fully pro- cess, analyze, and publish peer-reviewed work. Regardless, scientists can still pro- vide simple updates each season so that staff can show travelers the impacts of authentic scientific endeavors.
Total Biomass (µgC L–1)
2016 2017
(c) Neko Harbor 100
80 60 40 20 0
Dec 17 Dec 26 Jan 12 Jan 20 Feb 3 Feb 9 Feb 12 Feb 17 Mar 1 2016
Total Biomass (µgC L–1)
2017 (a) Cierva Cove
Nov 18 25 20 15 10 5
0 Nov 24 Dec 23 Jan 2 Feb 20 Feb 27
Total Biomass (µgC L–1)
2016 2017
Nov 25 100
80 60 40 20
0 Dec 8 Dec 14 Jan 4 Jan 20
(b) Wilhelmina Bay
Diatoms Dinoflagellates Cryptophytes Prasinophyceans Small Flagellates < 5 µm FIGURE 6. Time-series data collected at three loca-
tions ranging north to south (top to bottom). Five main taxa were identified at each sampling date over the 2016–2017 season, shown here as total biomass (µg C L–1). Note the change in scale.
To ensure the growth and sustainabil- ity of FjordPhyto partnerships, we rely on frequent feedback from staff. Between the 2017/2018 and 2018/2019 seasons, we received 81 feedback survey responses.
Travelers who participated expressed greater appreciation for the role of sci- ence: “Participating in [CS] allowed me to be more than just a tourist. It also rein- forced the Antarctic as a crucial part of climate change.” Because CS projects are a recent addition within the polar tourism industry, we have not yet quantitatively assessed attitudes toward science and the environment. This is something being considered by other researchers, and col- laboration with social scientists may pro- vide a possible metric for future growth.
In addition to travelers’ personal testimo- nies, staff enthusiasm is equally import- ant. As one staff person indicated, “If the passengers go home educated and have a new perspective on this planet—how they fit into it—and are motivated to tell their family and friends all about their expe- rience in Antarctica, and are also moti- vated to change possible former environ- mentally destructive behavior, then our [CS] Program was an absolute success!”
Within the research and tour industry there is a paradigm shift to embrace CS as a valid research tool. Federal agencies are investing in CS projects, and polar tour operators are marketing CS projects as an attraction for travelers to remote regions (Walsh, 2019). CS projects are non-revenue-producing and need to rely on diverse funding sources to sustain them long term. By comparison to the costs of established national research pro- grams, the real savings of a CS project is in both ship time and personnel time that ranges in hundreds of thousands of dol- lars over a five-month period. All other costs pertaining to sample analysis, access to the ship, salary, and graduate student tuition costs remain the same. Overall, savings could range between 60% and 80% when doing research from IAATO ships. To date, some of the FjordPhyto costs have been offset by federal grants;
however, FjordPhyto relies on donations
and fellowships from individuals and foundations to carry out the research.
FjordPhyto can serve as a power- ful low-cost tool for furthering research on phytoplankton communities. Results from the first year of sampling have already brought invaluable insights on phytoplankton composition and phe- nology in nearshore waters. Chlorophyll values in an unarmored dinoflagellate bloom at Danco Island are estimated at
~27.5 µg Chl-a L–1 (Mascioni et al., 2019), a concentration comparable to blooms near Anvers Island and Bransfield and Gerlache Straits (Rodriguez et al., 2002).
However, the previous blooms have been related to other taxa, such as diatoms, prymnesiophytes, prasinophyceans, or cryptophytes, but never to dinoflagellates.
Although dinoflagellates are known to dominate the phytoplankton community in Admiralty Bay during February (Lange et al., 2015), the concentration found (around 7 × 10³ cells L–1) is two orders of magnitude lower than those found in this study (9 × 10⁶ cells L–1). Seasonally, the 2016 springtime phytoplankton biomass was dominated by diatoms (Figure 6), although numerically the most abundant group was the small flagellates (<5 µm;
Mascioni et al., 2019), as seen in WAP continental shelf waters (Garibotti et al., 2005). Abundant phytoplankton in near- shore waters are supported by relatively shallow mixed layers, usually <40 m (Figure 5; Mitchell and Holm-Hansen, 1991). Our results suggest that numeri- cally, the diatom spring bloom may not always develop in these nearshore waters (see Schloss et al., 2012). The biomass at WAP fjords seems to be dominated by planktonic diatoms, such as Odontella weisflogii that is well known in WAP pro- ductive environments (Varela et al., 2002;
Garibotti et al., 2005), and it is somewhat different from that in King George Island coastal waters, where benthic diatoms constitute the highest biomass (Lange et al., 2015). However, with only one year of sampling, it is not possible to gener- alize. Low sea ice cover in the fjords and passages in 2016 may have caused a delay
in water-column stratification and pre- vented the formation of the classic dia- tom bloom, as observed in Marguerite Bay (Rozema et al., 2017).
CONCLUSIONS
With rapid rates of environmental change and significant growth in tourism to the WAP, we saw an opportunity for a joint effort among many stakeholders to answer critical science questions and obtain observations over time that would not be possible or affordable using tra- ditional scientific approaches. While CS should not be considered a replacement for studies by scientists, FjordPhyto can enhance the scientific process and sat- isfy travelers wanting an enriching expe- rience. Additionally, Antarctic policy and conservation are influenced by more than scientific data. Sharing in the scien- tific process increases the public under- standing of science, allowing travelers to gain new perspective on ocean life.
Participants may return home with a deeper understanding of the polar envi- ronment and could go on to influence the future protection of the icy continent.
REFERENCES
Aas, E., J. Høkedal, and K. Sørensen. 2014. Secchi depth in the Oslofjord-Skagerrak area: Theory, experiments and relationships to other quantities.
Ocean Science 10:177–199, https://doi.org/10.5194/
os-10-177-2014.
Bender, N.A., K. Crosbie, and H.J. Lynch.
2016. Patterns of tourism in the Antarctic Peninsula region: A 20-year analysis. Antarctic Science 28(03):194–203, https://doi.org/10.1017/
S0954102016000031.
Bernard, K.S., and D.K. Steinberg. 2013. Krill bio- mass and aggregation structure in relation to tidal cycle in a penguin foraging region off the Western Antarctic Peninsula. ICES Journal of Marine Science 70(4):834–849, https://doi.org/10.1093/
icesjms/fst088.
Bonney, R., C.B. Cooper, J. Dickinson, S. Kelling, T. Phillips, K.V. Rosenberg, and J. Shirk. 2009.
Citizen science: A developing tool for expand- ing science knowledge and scientific literacy.
BioScience 59(11):977–984, https://doi.org/10.1525/
bio.2009.59.11.9.
Brandini, F.P., and J. Rebello. 1994. Wind field effect on hydrography and chlorophyll dynamics in the coastal pelagial of Admiralty Bay, King George Island, Antarctica. Antarctic Science 6(4):433-442, https://doi.org/10.1017/S0954102094000672.
Constable, A.J., J. Melbourne-Thomas, S.P. Corney, K.R. Arrigo, C. Barbraud, D.K. Barnes, N.L. Bindoff, P.W. Boyd, A. Brandt, D.P. Costa, and A.T. Davidson.
2014. Climate change and Southern Ocean ecosystems I: How changes in physical habi-