1分子蛍光イメージングを用いたプリオン蛋白オリゴ マーの検出
柴野, 智子
九州大学大学院医学系学府機能制御医学専攻神経病理学分野
https://doi.org/10.15017/24490
出版情報:Kyushu University, 2012, 博士(医学), 課程博士 バージョン:
権利関係:
Detection of prion protein oligomers by single molecule fluorescence imaging
Satoko Shibano, M.S.,1 Kensuke Sasaki, M.D. Ph.D.,1 Satoru Kidoaki, Ph.D.,2 Toru Iwaki, M.D. Ph.D.1
1 Department of Neuropathology, Graduate School of Medical Sciences, Kyushu University, 3-1-1 Maidashi, Higashi-ku, Fukuoka 812-8582, Japan
2 Division of Biomolecular Chemistry, Institute for Materials Chemistry and Engineering, Kyushu University, Motooka 744, Nishi-ku, Fukuoka 819-0395, Japan
Short title: TIRF imaging for PrP oligomers
Corresponding author: Dr. Toru Iwaki
Department of Neuropathology, Graduate School of Medical Sciences, Kyushu University, 3-1-1 Maidashi, Higashi-ku, Fukuoka 812-8582, Japan
Tel: +81-92-642-5536; Fax: +81-92-642-5540 E-mail
Abstract
The degree of polymerization of prion protein (PrP) has a close relationship with the pathological mechanisms of prion diseases. We examined, at the molecular level, the polymerization state of PrP in lysates of prion-infected cells using total internal reflection fluorescence microscopy (TIRFM). The crude lysates were fractionated by gel-filtration spin columns according to their molecular size. Both the oligomer-rich and the monomer-rich fractions were probed with fluorescein-labeled anti-PrP antibodies (mAb SAF70 and mAb 8G8). Fluorescent spots of varying intensity were detected, with the ratio of intense fluorescent spots being greater in the oligomer fraction samples with mAb SAF70 than those with 8G8, whose specific epitope is thought to be buried in abnormal PrP molecules. The results indicated that PrP oligomers could be specifically detected and conformational changes of abnormal PrP molecules observed. Imaging by TIRFM may aid in determining the polymerization state and properties of PrP oligomers in pathological processes.
Keywords: Prion; Oligomer; Cultured cell system; Single molecule imaging; TIRF microscopy.
Introduction
Prion diseases, also known as transmissible spongiform encephalopathies, such as Creutzfeldt-Jakob disease in humans, are progressive neurodegenerative disorders caused by abnormal deposits of prion protein (PrP) in the brain and are fatal. These deposits mainly consist of polymerized disease-associated PrP (PrPSc), which is derived from normal cellular PrP (PrPc). PrPSc is largely refolded into a β-sheet from an α-helix of PrPc, therefore PrPSc is likely to form detergent-insoluble aggregates and be partially resistant to proteinase K (PK) digestion.1 Prion diseases are usually diagnosed by detecting PK-resistant abnormal PrP (PrPres). However, the existence of protease-sensitive PrPSc (sPrPSc) has recently been revealed.2-6 In order to detect not only PrPres but also sPrPSc (i.e. total PrPSc) alternative measures without the use of protease treatment have been developed, including conformation-dependent immunoassay.3-5, 7-8
Recent studies have indicated that the oligomeric PrP equivalent of the 14–28 PrP molecules (300–600kDa) have higher infectivity and cytotoxicity than fibrillar PrPSc.9-10 Because of the close relationship between the polymerization states of PrP molecules and pathological mechanisms, the techniques that distinguish the degree of polymerization are important, for example, size-exclusion gel chromatography,11-13 sucrose gradient sedimentation14 and fluorescence intensity distribution analysis
(FIDA).15-16 The study which intends to obtain information on oligomeric state using fluorescent as parameter was also reported recently.17
To detect PrP oligomers, and to visualize the actual degree of polymerization at the molecular level, we applied the technique of single-molecule imaging using immunofluorescence with total internal reflection fluorescence microscopy (TIRFM) by simple cell culture system which has few impurities. TIRFM is commonly used for individual molecular imaging, rather than employing techniques that measure the overall mean, such as fluorescence correlation spectroscopy. In the research of Alzheimer’s disease, TIRFM was used to image Ca2+ influx through membrane pores formed by Aβ oligomers.18 In this study we applied TIRFM to image individual PrP molecules to characterize the molecular state of PrP in a pathological process.
Methods
Sample preparation
PrP was extracted from cultured F3 cells, the technique of which has been previously described.19-20 N2a#58 cells, which express five times the amount of normal PrP than mouse neuroblastoma N2a cells, were infected by Fukuoka-1 strain and maintained as the F3 cell line. F3 cells were cultivated in Opti-MEM (Invitrogen, CA, USA) medium,
supplemented with 10% fetal calf serum until confluent growth and then lysed in lysis buffer (100mM Tris, 100mM NaCl, 10mM EDTA, 0.5% Nonidet P-40, 0.5%
deoxycholate, pH 7.6). Crude proteins in the lysate were fractionated by gel-filtration spin columns (CHROMA SPIN-200, Clontech, CA, USA) according to their molecular size, following the method previously reported.13 Fraction No. 3 (shown in Fig. 1) was the oligomer-rich fraction and Fraction No. 7 the monomer-rich fraction. Proteins of each fraction were separated by SDS-polyacrylamide gel electrophoresis (SDS-PAGE) in 12% Bis-Tris gels (Invitrogen), and transferred to polyvinylidene difluoride (PVDF) membranes (Immobilon-P; Millipore, Billerica, MA, USA). The membranes were incubated for 1 h at room temperature with EzBlock (ATTO, Tokyo, Japan) in Tris buffered saline with Tween-20 (TTBS) (10 mmol Tris-HCl, 150 mmol NaCl, 0.05%
Tween-20) to block the nonspecific binding of antibodies. Membranes were then incubated for 1 h at room temperature with an anti-prion antibody (mouse monoclonal SAF70 or mouse monoclonal SAF83, Cayman, MI, USA), followed by a peroxidase-conjugated anti-mouse IgG secondary antibody (AP192P, 1:20 000;
Chemicon, Temecula, CA, USA). Immunoreaction was visualized using ECL plus Western Blotting Detection System (GE Healthcare; Chalfont St. Giles, Buckinghamshire, UK).
Labeling of antibodies
We used two anti-PrP primary antibodies: mAb SAF70, which recognizes amino acid residues 142–160; and mAb 8G8, which recognizing amino acid residues 95–110 (Cayman, MI, USA) (Fig. 4A). The antibodies were purified using IgG Purification Kit-G (Dojindo, Kumamoto, Japan), and the amino group of each purified IgG was labeled with fluorescein using Fluorescein Labeling Kit-NH2 (Dojindo, Kumamoto, Japan). Efficient fluorescein labeling was confirmed by specific immunostaining of kuru plaques in the cerebellar samples of Gerstmann-Sträussler-Scheinker disease after adequate autoclave pretreatment to unmask the epitope (data not shown). The labeling ratio of each antibody was measured according to the manufacturer's instructions and was 12.3 for the SAF70 antibody and 11.2 for the 8G8 antibody.
Microscopic observation
Each fluorescent antibody (10 pmol) was reacted with 20 mg/ml of fractionated proteins for one hour at room temperature. The samples were diluted with lysis buffer to approximately 1nM fluorescein and then transferred to a chamber made up of two glass coverslips. The glasses had been cleaned in 3M KOH for 12 hours and washed with
distilled water.
Fluorescein-labeled anti-PrP antibodies, with or without PrP molecules attached to the glass surface, were observed using TIRFM (illustrated in Fig. 4B). TIRF using a blue laser (wavelength 488nm) was connected to an IX71 microscope (Olympus, Tokyo, Japan) with an objective lens with 1.45 numerical aperture (100× Plan Apo TIRFM, Olympus) and a high-sensitive CCD camera (Roper, TX, USA). Dozens of static images were taken with an exposure time of 1000 msec for each condition.
Image analysis
Background gradation was compensated for using a rolling-ball algorithm from image-analysis software (ImageJ, NIH, MD, USA). The boundaries of individual fluorescent spots were detected and the signal intensity and area of each spot were measured using image-analysis software (MetaMorph, Molecular Devices, CA, USA) (Fig. 2D). A distribution histogram of the varying integral intensities, which were the products of area and intensity, was plotted by image. The major peak was fitted by Gaussian distribution and the area under the Gaussian curve was calculated. Intense spots were defined as those excluded from the 99.9 percentile of the Gaussian distribution. The ratio of intense spots to the total number of spots was used as the
polymerization index.
Results
Selection of fractions
PrP molecules were successfully separated according to their molecular size (or polymerization state) by repeated centrifugation using gel-filtration spin-columns for the first time in cultured cells system. PrPs eluted in each fraction were evaluated by sodium dodecyl sulfate-polyacrylamide gel electrophoresis (SDS-PAGE) (Fig. 1). We previously reported that the molecular weight of the fraction No. 3 was estimated to be >200 kDa and that proteins whose molecular weights were
approximately 30 kDa, such as monomer PrP molecules, were collected mainly in fractions 6–8.13 Both oligomer-rich (Fraction No. 3) and monomer-rich (Fraction No. 7) fractions of F3-cell lysate were examined in the following experiments.
Measurement of the fluorescent intensity of the detected spot
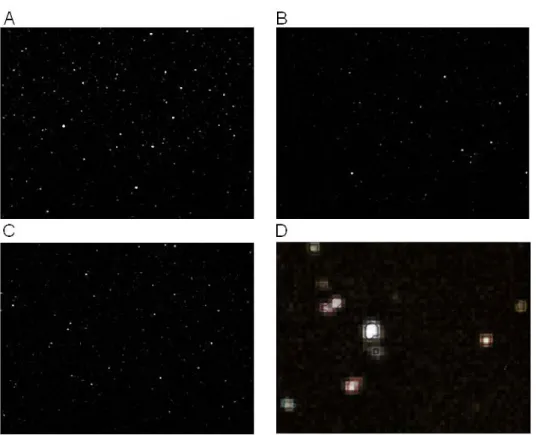
Disseminated fluorescent spots were observed in the samples of both oligomer and monomer fractions reacted with both PrP-specific antibodies (Fig. 2). These fluorescent spots were not observed in blank samples in which fluorescent antibodies were not used
(data not shown). The histograms of signal intensities showed that the numbers of intense fluorescent spots were increased in the oligomer fraction samples than in the monomer fraction samples when treated with the SAF70 antibody (Fig. 3A). Samples reacted with the 8G8 antibody presented less difference in the signal intensity between the samples of PrP oligomers and monomers (Fig. 3B).
Difference in detection rate of intense spots
The shapes of the histograms of fluorescent intensity were assumed to be a superposition of many Gaussian distributions. The major peak of each histogram was fitted with a Gaussian distribution to extract the area that would correspond to the fluorescent intensity of a single molecule of the fluorescent antibody (Figs. 3C and D).
The average rate of intense spots was calculated by subtracting the Gaussian distribution of a single fluorescent antibody from the total area of the histogram (Table.
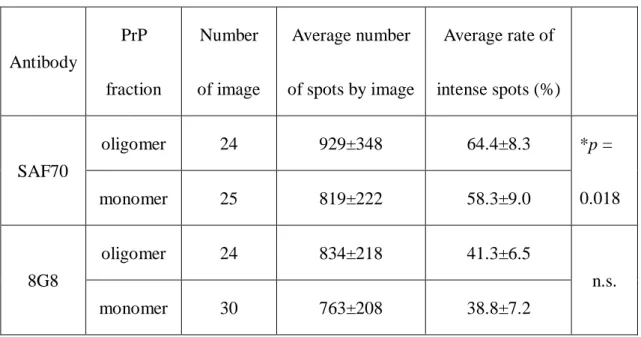
1). The ratio of the intense spots detected using the SAF70 antibody was 58.3±9.0 % in the monomer fraction sample; and 64.4±8.3 % in oligomer fraction sample. The difference between the two was significant (Student’s t test, p = 0.018), whereas no significant difference was detected using the 8G8 antibody (38.8±7.2 % in the monomer-rich sample and 41.3±6.5 % in the oligomer-rich sample).
Discussion
In this study we detected fluorescent spots of varying intensities using TIRFM. This is a simple and useful approach to estimate the polymerization state of PrP molecules with reference to each individual spot though it does not measure the overall average, which is the result with some other techniques, such as fluorescence correlation spectroscopy.16 TIRFM enables an analysis of the variance of polymerization of PrP molecules in crude cell lysates. Birkmann et al. previously reported that FIDA, implemented in confocal laser scanning microscopy, could also detect polymerized PrP by using an immunoreaction with fluorescent anti-PrP antibodies following the concentration of abnormal PrP with sodium phosphotungstic acid (PTA) precipitation.15 However, concentration with PTA precipitation eliminates most monomeric PrPc and may also diminish small PrP oligomers. Examination in crude cell lysates could therefore detect small PrP oligomers and avoid the distorted measurements of the polymerization state of PrP.
Conformational changes in PrP oligomers were examined in this study using comparative analysis with different epitope-specific antibodies. The major peak of intensity shown on the histograms represented both an excess of fluorescent antibodies and those bound to monomer PrP molecules. The fluorescent intensity may have been
affected by the labeling rate of antibodies, fluorescent intermolecular interaction in immunocomplexes or the adhesion time of fluorescent molecules to the glass surface during exposure, therefore the major peak could represent a broad distribution. Even though a free, single fluorescent antibody is indistinguishable from one bound to a PrP monomer molecule, exclusion of major low-intensity peaks would reveal the amount of polymeric PrP particles that reacted with multiple antibodies. For the reason of above-mentioned uncertainly a particular cut-off value, which defined polymerization state, was not set. The rates of the intense spots were estimated, and the difference between the distribution of fluorescent intensity between samples of oligomer and monomer fraction was found to be greater when reacted with the SAF70 antibody than with the 8G8 antibody. This may be due to the epitope which is recognized by the 8G8 antibody (PrP95-110) being mostly buried in abnormal PrP,4 whereas the SAF70-specific epitope (PrP142-160) may be exposed, regardless of polymerization state (Fig. 4A). It is suggested that the various intensities of the detected spots may correspond to the degree of polymerization of PrP.
Although the difference in results between the oligomer and the monomer fractions was significant, it was less remarkable than expected, even using the SAF70 antibody. There are three possible reasons for such observations. First, the low resolution of the
spin-columns used may have resulted in the insufficient separation of oligomers and monomers in each fraction. Second, PrP molecules in monomer-rich fractions, extracted from a prion-infected cell line, could have been partly polymerized into oligomers during the sample preparation. Protein oligomerization reactions may be highly dynamic, involving highly heterogeneous populations whose equilibria are easily perturbed by the environment condition. Third, binding of multiple antibodies to a single (1,000 kDa) oligomer could have interfered with each other. Oligomer fractions would not contain highly aggregated fibrils, so the multiplication of fluorescent intensity available may be limited. Some intense spots detected with the 8G8 antibody might suggest that the PrP molecules of some oligomers are loosely folded and the specific epitope in the core domain is exposed, or it may merely indicate the aggregation of antibodies. Several residual problems such as unclear quantity of extra fluorescent antibody must be solved to obtain accurate data. And further investigation is needed to develop the methods, including the selection and the concentration ratios of antibodies and samples, and the detection procedures, such as exposure time.
However in conclusion, we detected PrP oligomers in crude lysates of prion-infected cells and discerned conformational changes of abnormal PrP molecules. TIRFM will not only contribute to determining the molecular state of PrP in the pathological process
examined in this study but will also be applicable in the study of other conformational diseases.
Acknowledgments
This work was funded by Grants-in-Aid for Scientific Research (B) (No. 22300116) and (C) (No. 21500337) from the Japan Society for the Promotion of Science (JSPS).
References
1. Prusiner SB. Prion diseases and the BSE crisis. Science 1997; 278: 245-251.
2. Lasmezas C. Transmission of the BSE agent to mice in the absence of detectable abnormal prion protein. Science 1997; 275: 402-405.
3. Safar J, Wille H, Itri V et al. Eight prion strains have PrP(Sc) molecules with different conformations. Nat Med 1998; 4: 1157-65.
4. Tremblay P, Ball HL, Kaneko K et al. Mutant PrPSc conformers induced by a synthetic peptide and several prion strains. J Virol 2004; 78: 2088-99.
5. Safar JG, Geschwind MD, Deering C et al. Diagnosis of human prion disease.
Proc Natl Acad Sci U S A 2005; 102: 3501-6.
6. Zou WQ, Puoti G, Xiao X et al. Variably protease-sensitive prionopathy: a new sporadic disease of the prion protein. Ann Neurol 2010; 68: 162-72.
7. Safar JG, Scott M, Monaghan J et al. Measuring prions causing bovine spongiform encephalopathy or chronic wasting disease by immunoassays and transgenic mice. Nat Biotechnol 2002; 20: 1147-50.
8. Bellon A, Seyfert-Brandt W, Lang W, Baron H, Groner A, Vey M. Improved conformation-dependent immunoassay: suitability for human prion detection with enhanced sensitivity. J Gen Virol 2003; 84: 1921-5.
9. Silveira JR, Raymond GJ, Hughson AG et al. The most infectious prion protein particles. Nature 2005; 437: 257-61.
10. Simoneau S, Rezaei H, Sales N et al. In vitro and in vivo neurotoxicity of prion protein oligomers. PLoS Pathog 2007; 3: e125.
11. Cali I, Castellani R, Yuan J et al. Classification of sporadic Creutzfeldt-Jakob disease revisited. Brain 2006; 129: 2266-77.
12. Minaki H, Sasaki K, Honda H, Iwaki T. Prion protein oligomers in Creutzfeldt-Jakob disease detected by gel-filtration centrifuge columns.
Neuropathology 2009; 29: 536-42.
13. Sasaki K, Minaki H, Iwaki T. Development of oligomeric prion-protein aggregates in a mouse model of prion disease. J Pathol 2009; 219: 123-30.
14. Yuan J, Xiao X, McGeehan J et al. Insoluble aggregates and protease-resistant conformers of prion protein in uninfected human brains. J Biol Chem 2006; 281:
34848-58.
15. Birkmann E, Henke F, Weinmann N et al. Counting of single prion particles bound to a capture-antibody surface (surface-FIDA). Vet Microbiol 2007; 123:
294-304.
16. Birkmann E, Schafer O, Weinmann N et al. Detection of prion particles in samples of BSE and scrapie by fluorescence correlation spectroscopy without proteinase K digestion. Biol Chem 2006; 387: 95-102.
17. Lindgren M, Hammarstrom P. Amyloid oligomers: spectroscopic characterization of amyloidogenic protein states. FEBS J 2010; 277: 1380-8.
18. Demuro A, Smith M, Parker I. Single-channel Ca(2+) imaging implicates Abeta1-42 amyloid pores in Alzheimer's disease pathology. J Cell Biol 2011;
195: 515-24.
19. Nishida N, Harris DA, Vilette D et al. Successful transmission of three mouse-adapted scrapie strains to murine neuroblastoma cell lines overexpressing wild-type mouse prion protein. J Virol 2000; 74: 320-5.
20. Ishikawa K, Doh-ura K, Kudo Y et al. Amyloid imaging probes are useful for detection of prion plaques and treatment of transmissible spongiform encephalopathies. J Gen Virol 2004; 85: 1785-90.
Figure legends
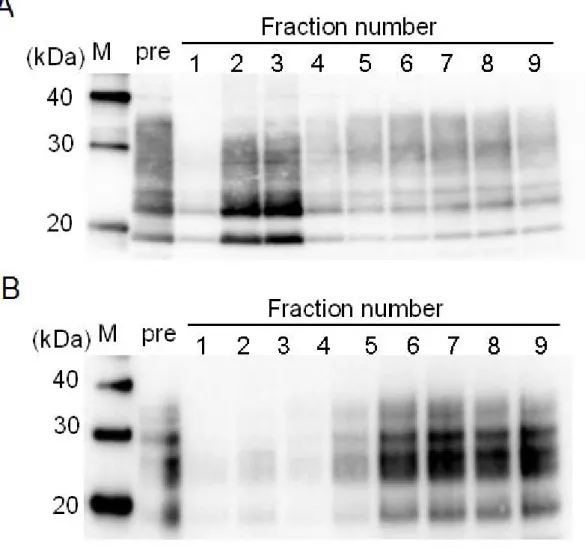
Figure 1. Western blot analysis of culture cell homogenate in the eluted fractions separated by gel-filtration spin column
Cell lysate was size-fractionated using a gel-filtration spin column. Large molecules are eluted in early fractions, whereas smaller molecules are collected in late fractions. PrPs eluted in each fraction were evaluated by SDS-PAGE. M: molecular markers. pre:
pre-fractionated sample. (A) The fractionation pattern of F3-cell lysate. mAb SAF70
was used as the anti-PrP primary antibody. Fraction No. 3 was considered as the oligomer-rich fraction, even though PrP molecules are disassembled into monomers as shown due to SDS treatment, and Fraction No. 7 was considered as the monomer-rich fraction. (B) The fractionation pattern of N2a-cell lysate. mAb SAF83 was used as anti-PrP primary antibody.
Figure 2. Fluorescent spots observed under TIRF microscopy
(A) Oligomer-rich fraction reacted with fluorescein-SAF70. (B) Monomer-rich fraction reacted with fluorescein-SAF70. (C) Oligomer-rich fraction reacted with fluorescein-8G8. (D) The edges of individual fluorescent spots are identified.
Figure 3. Histogram of the signal intensity
(A) SAF70 antibody. (B) 8G8 antibody. The data of all images are gathered in one unit for each condition and shown in single logarithmic chart. The difference of the distribution between the oligomer-rich fraction (red line) and the monomer-rich fraction (blue line) is better detected using the SAF70 antibody rather than the 8G8 antibody. (C, D) The major peak of each histogram of the oligomer-rich fraction probed with the SAF70 antibody (C) or with the 8G8 antibody (D) is fitted with a Gaussian distribution
to extract the area that would correspond to the fluorescent intensity of a single molecule of the fluorescent antibody.
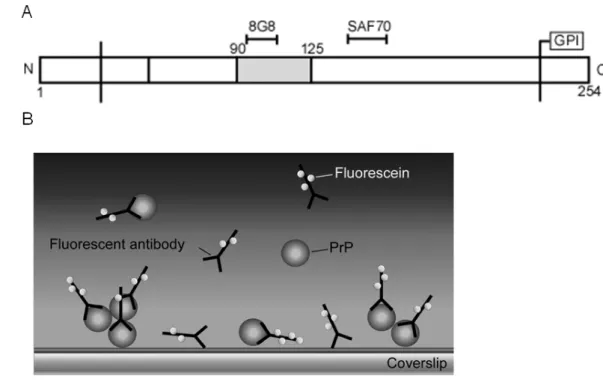
Figure 4. Schematic protein sequence
(A) The epitopes of the antibodies are indicated. mAb SAF70 recognizes amino acid residues 142–160 and mAb 8G8 recognizes amino acid residues 95–110. The epitope of 8G8 is thought to be buried within abnormal PrP molecules. The gray bar indicates the buried region in PrPSc. GPI: glycosylphosphatidylinositol anchor site. (B) Schematic drawing of experimental design. PrP molecules coupled with fluorescent anti-PrP antibodies were nonspecifically immobilized on glass surface. Diagram not to scale.
Table 1. Comparison of the detection rate of intense spots.
Antibody
PrP fraction
Number of image
Average number of spots by image
Average rate of intense spots (%)
SAF70
oligomer 24 929±348 64.4±8.3 *p =
0.018
monomer 25 819±222 58.3±9.0
8G8
oligomer 24 834±218 41.3±6.5
n.s.
monomer 30 763±208 38.8±7.2
* Student’s t-test. n.s.: no significant.