human papillomavirus promoter activity patterns at different disease stages
Author Ayumi Taguchi, Kazunori Nagasaka, Charles Plessy, Hiroe Nakamura, Yoshiko Kawata, Sachi Kato, Kosuke Hashimoto, Takeshi Nagamatsu, Katsutoshi Oda, Iwao Kukimoto, Kei Kawana, Piero Carninci, Yutaka Osuga, Tomoyuki Fujii journal or
publication title
Scientific Reports
volume 10
number 1
page range 17991
year 2020‑10‑22
Publisher Nature Research
Rights (C) 2020 The Author(s).
URL http://id.nii.ac.jp/1394/00001752/
doi: info:doi/10.1038/s41598-020-75133-2
Creative Commons Attribution 4.0 International(https://creativecommons.org/licenses/by/4.0/)
1 Scientific Reports | (2020) 10:17991 | https://doi.org/10.1038/s41598-020-75133-2
www.nature.com/scientificreports
Use of Cap Analysis Gene
Expression to detect human
papillomavirus promoter activity patterns at different disease stages
Ayumi Taguchi
1, Kazunori Nagasaka
1,2*, Charles Plessy
3, Hiroe Nakamura
1,
Yoshiko Kawata
1, Sachi Kato
4, Kosuke Hashimoto
4, Takeshi Nagamatsu
1, Katsutoshi Oda
1, Iwao Kukimoto
5, Kei Kawana
6, Piero Carninci
4, Yutaka Osuga
1& Tomoyuki Fujii
1Transcription of human papillomavirus (HPV) genes proceeds unidirectionally from multiple
promoters. Direct profiling of transcription start sites (TSSs) by Cap Analysis Gene Expression (CAGE) is a powerful strategy for examining individual HPV promoter activity. The objective of this study was to evaluate alterations of viral promoter activity during infection using CAGE technology. We used CAGE-based sequencing of 46 primary cervical samples, and quantitatively evaluated TSS patterns in the HPV transcriptome at a single-nucleotide resolution. TSS patterns were classified into two types:
early promoter-dominant type (Type A) and late promoter-dominant type (Type B). The Type B pattern was more frequently found in CIN1 and CIN2 lesions than in CIN3 and cancer samples. We detected transcriptomes from multiple HPV types in five samples. Interestingly, in each sample, the TSS patterns of both HPV types were the same. The viral gene expression pattern was determined by the differentiation status of the epithelial cells, regardless of HPV type. We performed unbiased analyses of TSSs across the HPV genome in clinical samples. Visualising TSS pattern dynamics, including TSS shifts, provides new insights into how HPV infection status relates to disease state.
Uterine cervical cancer is the second most commonly diagnosed cancer, and the third leading cause of mortality among women in developed countries
1. Persistent infection with high-risk human papillomaviruses (HR-HPVs) is the main cause of cancer development
2–4. During the last two decades, HPV-induced carcinogenesis has been extensively studied. The HPV-derived E6 and E7 oncoproteins inactivate the p53 and pRb tumour suppressor proteins, respectively, which results in resistance to apoptosis and promotion of cell proliferation. Continuous high expression of E6 and E7 is the most important factor in cervical cancer progression
5,6.
HPV transcription is unidirectional and generates numerous viral transcripts via differential RNA splicing.
At least 13 transcripts from eight HPV genes were identified in HPV-16–infected W12E cells
7. These transcripts overlap, complicating the evaluation of expression levels of each transcript. There are two major promoters in the HPV genome: the early promoter, located in the long control region (LCR); and the late promoter, located in the E7 gene downstream of the early promoter. The early promoter controls the expression of E6 and E7, while the late promoter regulates the expression of E1, E2, E4, and E5 (which are important for cell differentiation and viral replication), as well as the expression of L1 and L2 capsid protein genes
8. The activity of these promoters is regulated by cellular transcription factors, or by the epigenetic alteration of the viral genome.
A transcriptome profiling method known as Cap Analysis Gene Expression (CAGE)
9can be used to determine the 5′-terminal sequence of RNA, allowing for promoter detection and quantitative measurement of promoter activity. The two main CAGE protocols currently used are no-amplification non-tagging (nAnTi)-CAGE
10, which does not involve PCR amplification, and nanoCAGE
11, which is designed to process samples that yield nano- grams of RNA. nanoCAGE is based on PCR amplification, with the PCR bias removed through the use of unique molecular identifiers
12. We previously reported that nAnTi-CAGE may be used to identify precise transcription
OPEN
1
Department of Obstetrics and Gynecology, Graduate School of Medicine, The University of Tokyo, Tokyo,
Japan.
2Department of Obstetrics and Gynecology, Teikyo University School of Medicine, Tokyo, Japan.
3Okinawa
Institute of Science and Technology Graduate University, Okinawa, Japan.
4Division of Genomic Medicine,
RIKEN Center for Integrative Medical Science, Yokohama, Japan.
5Pathogen Genomic Center, National Institute
of Infectious Diseases, Tokyo, Japan.
6Department of Obstetrics and Gynecology, Nihon University School of
Medicine, Tokyo, Japan.
*email: [email protected]
start sites (TSSs) in the HPV genome, and have used this technology to quantify the activity of multiple promoters in three cell lines and one patient sample
13. Direct evaluation of TSSs may represent a novel diagnostic strategy to assess HPV infection status and disease progression.
HPV genes are differentially expressed in parallel with the differentiation programme of the cervical epithe- lium. At the initial stage of HPV infection, the copy number of the viral genome in cells in the basal layer of the cervical epithelium is very low. Viral DNA replication proceeds along with epithelial differentiation
14,15. In the upper epithelial layers, the viral late genes L1 and L2 are expressed to allow viral capsid assembly, packaging, and shedding from the superficial layer of the epithelium. As the viral late gene expression is promoted, E2 sup- presses the activity of the early promoter by binding to the E2 binding sites (E2BS) of the LCR
16–18. Thus, in the late stages of epithelial differentiation, HPV early promoter activity is relatively suppressed. As the severity of cervical intraepithelial neoplasia (CIN) increases, sustained high expression of E6 and E7 is driven by the early promoter, and, conversely, L1 gene expression is suppressed
19. Several methods have been devised to evaluate the expression of late genes, such as L1 or E4, as biomarkers for CIN progression
19–25. Precise evaluation of the late gene expression patterns could support their use as novel biomarkers for cervical cancer progression.
In this context, we propose that a quantitative assessment of promoter activity, by evaluating TSS activity, would allow for classification of HPV status, as well as CIN severity. In the present study, we developed a novel approach for the evaluation of differences of viral promoter activity at the single-nucleotide level using CAGE technology in clinical HPV samples.
Results
HPV TSS patterns of cervical lesions. Forty-six cervical lesions, from normal and cancerous lesions, were analysed by nAnTi-CAGE or nanoCAGE (9 for nAnTi-CAGE and 37 for nanoCAGE). As the principle of both nAnTi-CAGE and nanoCAGE is highly similar, we first performed nAnTi-CAGE analysis for 9 samples, and we used 37 samples for nanoCAGE analysis, which is a novel technology developed after nAnTi-CAGE to meaningfully observe TSS pattern dynamics with CAGE analysis. The HPV TSS patterns were classified into broad TSS types. First, we visualised TSS activity at a single-nucleotide level using ZENBU software
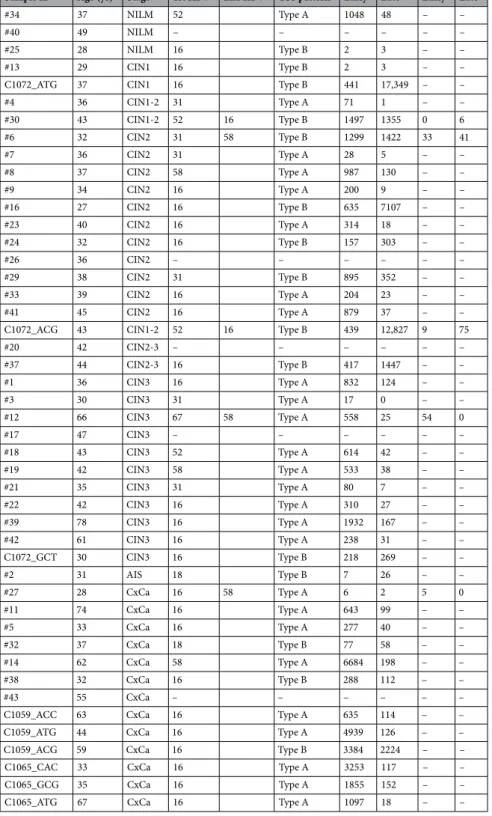
26. We iden- tified two TSS patterns when focusing on the most activated TSS clusters: the early promoter-activated pattern and the late promoter-activated pattern, which were designated Type A and Type B, respectively. To analyse mul- tiple HPV subtypes in parallel, we defined broad windows containing the early and late promoters in any HPV genome: from nucleotide 80 to 110, and from nucleotide 600 to 950, respectively. We discovered TSS patterns indicative of the early and late promoters, and we subsequently refined the TSS pattern definitions so that Type A included samples where one-third of early promoter activity ≥ late promoter activity; Type B, one-third of early promoter activity < late promoter activity (Fig. 1). The cervical lesion grades and corresponding HPV TSS types are summarised in Fig. 2 and Table 1. Type B was more common in CIN2 or CIN1 than in other samples, while CIN3 or cancerous lesions were predominantly Type A (chi-square test, p = 0.0224), and the observed frequency of Type B decreased with CIN progression (Cochran–Armitage test, p = 0.0208).
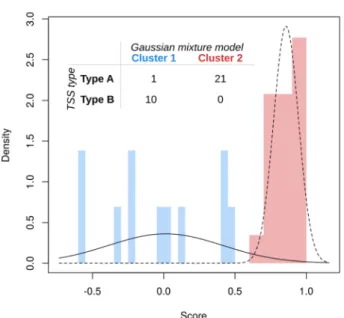
We then investigated whether the initial observation of multiple TSS patterns would be supported by a more systematic approach. We fitted Gaussian mixture models
27to investigate the accuracy of the classified HPV- derived TSS types. Among 37 samples analyzed by nano-CAGE, 33 samples of which HPV-derived TSS was detected were included in this study. Of them, 2 samples were co-infected with two HPV genotypes. Thirty-five HPV-derived TSS types were classified by Gaussian mixture models, and compared to the types of HPV-derived TSSs classified according to the averaged difference in expression between the early and late promoters, defined as (early – late)/(early + late). The model with the highest likelihood was univariate, with two components and unequal variance: this corresponded closely to Type A and the union of Type B, since only one Type A sample (sample #27) was classified as Type B (Fig. 3).
TSS patterns in multiple infections. We detected transcriptomes of multiple HPV types in five samples in the current study (Table 1). The following co-infections were observed: HPV-16 and HPV-52 (samples C1072_ACG and #30); HPV-31 and HPV-58 (sample #6); HPV-16 and HPV-58 (sample #27); and HPV-67 and HPV-58 (sample #12). Interestingly, the TSS patterns of both detected HPV types were the same in each sample (Fig. 4).
Furthermore, a dominant HPV type was apparent in each case of co-infection (Fig. 4 and Table 1).
Assessment of small promoters by nAnTi-CAGE technology. In a previous study, we identified numerous HPV-derived TSS clusters in a CIN cell line and a CIN sample
13. In the present study, we used nAnTi- CAGE to detect small HPV16-derived TSS clusters, as well as the prominent early and late promoters, in clinical samples (Table 2). One of the small TSS clusters was found to be for the E8^E2 gene, and is located at nt1125- 1148. We identified the E8^E2 TSS in 3 of 6 cancer samples and 2 of 3 CIN samples. Another small TSS cluster found to be for the E5 gene, located at nt3391-3420
7, was identified in all CIN samples. Furthermore, we also identified a cluster located at nt12-15 in all cervical cancer samples. Focusing on the early and late promoters, as well as the cluster located at nt12-15 for the E6/E7 genes and nt3391-3420 for the E5 gene, there are changes in gene expression according to the usage of each viral promoter (Fig. 5).
Discussion
In the present study, we noted that the TSS patterns in the HPV genome may reflect the lesion stage of infected
tissue. In all cancer samples and in several CIN samples, the prominent TSS patterns corresponded to the early
promoter, while in low-grade CIN samples, the dominant TSS clusters had shifted from the early to the late
promoter. Furthermore, in lesions with multiple infections, the prominent TSS patterns were the same, regard-
less of HPV type.
Scientific Reports | (2020) 10:17991 | https://doi.org/10.1038/s41598-020-75133-2 3
www.nature.com/scientificreports/
Figure 1. nAnTi-CAGE and nanoCAGE TSSs of HPV-positive cervical lesions. Forty-six cervical lesions, representing both normal and cancerous lesions, were analysed by nAnTi-CAGE or nanoCAGE (9 for nAnTi- CAGE and 39 for nanoCAGE). The HPV TSS patterns were investigated and classified by the prominent TSS types. Regardless of the HPV type, early and late promoter activity was defined by the numbers of TSSs in each transcriptome that started either between nucleotides 80 and 110, or between nucleotides 600 and 950. The TSS patterns were defined as follows: Type A, one-third of early promoter activity ≥ late promoter activity; Type B, one-third of early promoter activity < late promoter activity. To visualise TSS levels at the single-nucleotide level, nanoCAGE data were visualised using ZENBU software. Representative data for each TSS pattern are shown.
TSS transcription start site.
Figure 2. nAnTi-CAGE and nanoCAGE TSSs of HPV-positive cervical lesions. Thirty-nine cervical lesions with HPV-16, HPV-31, HPV-52, and/or HPV-58 infections, isolated from normal and cancerous lesions, were analysed by nAnTi-CAGE or nanoCAGE. The HPV TSS patterns were investigated and classified according to the prominent TSS types. Regardless of the HPV strain, early and late promoter activity was defined by the numbers of TSSs in each transcriptome that started either between nucleotides 80 and 110, or between nucleotides 600 and 950. The TSS patterns were defined as follows: Type A, one-third of early promoter activity ≥ late promoter activity; Type B, one-third of early promoter activity < late promoter activity. The TSS patterns of HPV-positive cervical lesions along with HPV type and cervical lesion status are summarised.
aTwo samples were co-infected with HPV-16 and HPV-52.
bOne sample was co-infected with HPV-31 and HPV-58.
c