75
ISSN: 2187-3666 (online)
DOI: http://dx.doi.org/10.14246/irspsd.3.4_75
Copyright@SPSD Press from 2010, SPSD Press, Kanazawa
Study of Intercity Travel Characteristics in Chinese Urban Agglomeration
Zhuoran Li *1, Yan Wang1 and Shichen Zhao2
1Department of Architecture and Urban Planning, Shandong Jianzhu University
2Department of Architecture and Urban Design, Kyushu University
* Corresponding Author, Email: [email protected] Received 17 August, 2014; Accepted 24 January, 2015
Keywords: Urban agglomeration, Inter-city transportation system, Travel characteristics,
Traffic demand forecast
Abstract: Due to rapid urban development in china, traffic problems are fast becoming considerably serious. In this study, we focus on intercity travel characteristics’
research. By investigating the travel characteristics of passengers and the intercity traffic demand forecast, we aim to discriminate the geographical spatial characteristics of departure places and to establish coupling law of city public transportation hubs and urban space which directly connect with the intercity rail station. In future research, we will try to determine theoretical research methods of node location choice in the urban transfer system. We will determine the location of the key hub node and form a transfer service for intercity public network system to improve the efficiency of residential travel.
1. INTRODUCTION
Urban agglomeration is a special kind of geographical space organization in the urbanization process. It takes one or two metropolises as the core area of regional economic development, relying on certain natural environmental conditions, modern transport and high accessibility of its integrated transport network, in order to expand the urban geographical scope and increase the number of cities, thus constituting an integrated urban area composed of economy, society and technology. China currently has three emergent urban agglomerations: Yangtze River Delta, Pearl River Delta and Beijing-Tianjin-Tangshan area. Other areas such as Liaoning Peninsula urban agglomeration, Shandong Peninsula urban agglomeration and Bashu urban agglomeration have been rising.
Intercity transportation is a representation of a healthily developed urban agglomeration. It includes two parts: passenger transportation and freight flow. For commute and leisure purposes, passenger traffic is the most important part of intercity transportation. Passenger travel flow forecast is important for two main reasons:
1) To understand the intercity travel characteristics inside the urban agglomeration, and make reasonable arrangements for the travelers’
itineraries. A reasonable passenger flow forecast can obtain intercity travel characteristics such as average daily traffic flow and rush hour traffic flow, with that travelers can select an appropriate way to travel according to their travel destination and travel needs, as well as saving travel time.
2) To guide the construction of intercity transportation networks and avoid blind construction. The intercity transportation network is mainly composed of intercity railway and intercity highways, both of which need huge material input and long payback periods are required; once started it cannot be reversed. Reasonable flow forecasts could assist decision-making and reduce investment risk and optimize transportation network source configuration.
2. RELATED WORKS
Among the research of intercity travel, Yusak and Ryuichi (2008) make a comparative study of private car and public transport commuters in the Osaka metropolitan area based on a traffic survey during 1980-2000, finding that both kinds of commute have increased in distance during the past thirty years. On the contrary, the travel time has declined. In addition, with the increase of social and leisure travel demand, private car commuters are more willing to increase the number of trips rather than increase the number of trip nodes, while the condition for bus commuters is the opposite. From the aspect of trip influencing factors, based on an analysis of a UK domestic travel survey during 1995 -2006, Dargay et al. (2012) analyzed nine influential factors for long-distance travel, including income, age, gender, occupation and family status. They found that for long-distance travel, the most influential factor is income. Moreover, income, gender and age have important influences on the long distance transportation type selection.
Compared with developed countries, income has a more important and straightforward influence on travel in China because of the relatively low income per capital. Corradino (2000) studied the regional travel characteristics of southeast Florida, by investigating 5200 samples, including family and personal travel times and travel methods.In China, this number should be greater to ensure the accuracy of the experiment because of the larger population density than that of the United States. Khandker et al.
(2009) researched the travel characteristics of the Toronto metropolitan area based on a hybrid discrete-continuous model, and combined travel time with travel mode rather than the separated survey of the two indicators.In the field of Chinese intercity travel characteristics research, Zhou et al. (2007) compared city residents’ travel modes of China with several foreign countries. They found that for the distribution of domestic city residents’ trip purpose, commuter travel has dropped, corresponding to the proportional increase of daily travel. Through comparing the travel characteristics of three huge urban agglomerations of China (Yangtze River Delta, Pearl River Delta and Beijing-Tianjin-Hebei), Song (2010) found that city residents’ average trip frequency increased with the growth of urban economy, and that residents in developed cities have increased the number of their living and recreational trips. Li (2006)analyzed travel time distribution, travel purpose and type of intercity travel in the Changsha-Zhuzhou-Xiangtan urban agglomeration.
Intercity travel can be regarded as an amplification of a city group’s travel within a geographical area, therefore, there are similarities between the intercity and city groups’ travel characteristics. Within the city groups, distribution of the nodes would be more elastic. Consequently, in the case of absence of research on domestic intercity travel characteristics, we can learn from travel characteristics research for city groups. In the field of intercity passenger traffic flow forecasts, Feng (2006) proposed a feedback forecast model of regional traffic demand for the Jabodetabek metropolitan area in
Indonesia. This model can be used in Transcad software, and the forecast is more precise than the traditional non-feedback model. Zhang et al. (2000) have also introduced a demand forecast model based on multiple variable feedback mechanisms, and applied it for New York City. They found that to control the iteration process, the use of road flow is more superior to travel time or speed. Chandra and Sujit (2000) have established a travel generation forecast model for commuters based on the activity and travel mode. The model framework is constituted of the workers’ commuting trip in two cities of the Boston metropolitan area. Zhang et al. (2006) used the principal component analysis to extract the factors that affected the port throughput and took Nanjing port as an example to verify the model. The results show that the model can well reflect the actual case and is effective for system fitting. Gao (2011) obtained the key impact factor and selected it as the variable for a gravity forecast model. He used the sensitivity analysis to measure the impact factor of the passenger special line flow. He also determined the total passenger volume from origin to destination of the previous years and earmarked the parameters of a passenger special line flow gravity forecast model.
3. METHODOLOGY
This research attempts to introduce the gravity model to forecast the demand of intercity traffic with inter-regional economic and social parameters. Gravity function is a generalized distance function to measure the attenuation law with distance of the gravity between two regions. The model considers geometric distance, transportation costs, transportation time, economic exchanges and the linear combination of these factors. Based on the investigation of residents’ travel and social economic development levels, we try to rank each impact factor by the analytical hierarchy process that combines the travel characteristics. For flow calibration, field investigation was carried out in the intercity traffic hubs.
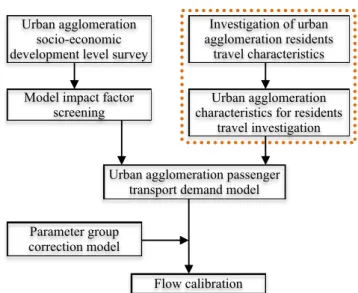
The technology roadmap of this study is as shown in Figure 1.
Figure 1. Research technology roadmap
In the steps which are surrounded by the dotted frame, we first investigate the characteristics of residents’ travel, and try to find and induce
Urban agglomeration socio-economic development level survey
Investigation of urban agglomeration residents
travel characteristics Model impact factor
screening Urban agglomeration
characteristics for residents travel investigation
Urban agglomeration passenger transport demand model Parameter group
correction model
Flow calibration
the other characteristics of urban agglomeration from the investigation. They are important sources of information.
This paper focuses on the survey of resident travel characteristics in two typical Chinese urban agglomerations. In the subsequent studies we will use the research results to modify and check a travel demand forecast model of urban agglomeration. Intercity travel characteristics mainly include the travel purpose, travel mode, trip distance/time consumption and other basic travel characteristics, as well as the associations with traveler income, occupation, age, gender and other factors, in order to determine the traveler’s expected travel mode, travel time and delivery speed of each class. In this paper, we select Beijing-Tianjin and Beijing-Zhengzhou intercity railway line as the research objects to analyze the travel characteristics of each line.
4. CASE STUDY OF INTERCITY TRAVEL CHARACTERISTICS
4.1 Analysis of Beijing-Tianjin intercity high speed rail travel characteristics
Beijing-Tianjin Intercity High Speed Rail quickly won the intercity passenger market with its advanced and reliable technology and equipment, human services system, efficient and convenient transport product and transit-oriented mode of transport. This research will analyze the characteristics of Beijing-Tianjin intercity passenger flow with the investigation data of passenger flow and historical information of passenger tickets from the Beijing South Railway Station.
4.1.1 Passenger flow structure analysis
For travel purposes, among the passengers of Beijing-Tianjin Intercity High Speed Rail, business trips accounted for the largest proportion, 35.3%, followed by visiting relatives’ passenger flow, which accounted for 27.3%.
For the occupation of passengers, company staff accounted for the largest proportion, 37.3%, followed by institution staff and freelancers, respectively accounting for 18.7% and 14%.
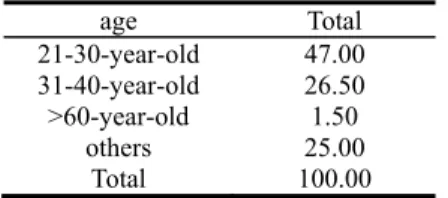
4.1.2 Travel purposes and passenger age
Table 1. Passengers of different ages (%)
age Total
21-30-year-old 47.00 31-40-year-old 26.50
>60-year-old others
1.50 25.00
Total 100.00
Among the passengers of the railway line, 21-30 year-old passengers accounted for the largest proportion, 47%, followed by 31-40 year-old passengers, who accounted for 26.5%, and; people over 50 years old accounted for the smallest proportion, 6.6%, among them, over 60s only accounted for 1.3%. Among the passengers of 21-40 year-olds, the purpose of business trip and visiting relatives accounted for the largest proportion, 17.9%
and 15.9% respectively, and is higher than the average; other non-key-age
travelers’ private travel proportions were significantly higher than the average.
4.1.3 Source of expense and travel purposes
Passenger’s sources of expense and travel purpose are as follows:
Table2. Relation of source of expense and travel purpose (%) Public
Expense Own Expense Total
Visiting Relatives 1.90 24.70 26.60
Public Affairs 29.10 5.10 34.20
Tourism 0.00 12.70 12.70
Business 1.90 4.40 6.30
Employment 0.70 0.50 1.20
Study 0.00 3.20 3.20
Others 2.50 13.30 15.80
Total 36.10 63.90 100.00
According to Table 2, private travel expense accounted for 63.9%, which is significantly more than public travel expense. In this case, passengers will make their travel plans based on their own income. These two kinds of people are completely different for the purpose of node selection.
4.1.4 Passenger monthly per capita income structure
Table 3. Passenger monthly per capita income(%)
Income Total
<$160 6.80
$160一
$320
9.60
$320一
$480
24.70
$480一
$800
26.70
>$800 32.20
Total 100.00
Among the passengers of Beijing-Tianjin Intercity Railway line, personal monthly income over $320 accounted for 84%, over $480 accounted for 59%, while the proportion of passengers is proportional to income. This result supports the influence of income and concludes the trend of travel rate is in the range of less than $800.
4.1.5 The main factors of rail line choice
The main factors for choosing Beijing-Tianjin Intercity Railway line include fares, safety, convenience, comfort etc. Speed is the primary reason for choosing this line, as 57.5% of passengers think the most important factor is travel time, followed by convenience—51% of passengers think that this line is convenient with efficient ticket service and high-frequency departure.
The percentage of reasons for line selection, such as safety, comfort and punctuality is not high, compared to other means of transport in this area, Beijing-Tianjin Intercity Railway’s advantages are not obvious. Most travelers think the fare is expensive; only fewer than 15% of travelers think the current fare is reasonable.
4.1.6 Travel frequency
70% of passengers will travel between Beijing and Tianjin more than once per month, and more than 40% of passengers will travel more than three times, thus it can be seen that most passengers are frequent travelers.
These frequent experiences reflect the objectivity of evaluation from passengers.
4.1.7 Round-trip weekly distribution
Table 4. Date of travel statistics Date Monday Tuesday-
Thursday
Friday Saturday
-Sunday
% 19.50% 30.82% 43.40% 38.99%
As shown in the table, the passenger flow volume between Beijing and Tianjin is comparatively larger from Friday to Monday, especially on Friday, which means a lot of passengers choose departing on Friday, and returning back on Saturday/Sunday or Monday. Weekend trip flow is commonly busier, while daily working time, for example Tuesday, Wednesday and Thursday, is subjectively smaller. It is consistent with the necessary demand of time for passengers who visit relatives and tourism.
4.1.8 The typical periods of time
The intensive periods of time which passengers usually choose is between 7-9am in the morning, and before 7pm at night. The ratio of other time periods chosen are more or less balanced.
4.1.9 Conclusion
The Beijing-Tianjin intercity high-speed railway for leisure travel is slightly higher than for business travel. For leisure travel the largest flow is for visits, while travel for business accounts for the largest shares in official business flow. The characteristics compared with other lines did not show obvious differences. This indicates that there is great potential for the Beijing-Tianjin intercity high-speed based on the effect of commuter flow and induced passenger flow.
Among the passengers taking the Beijing-Tianjin intercity high-speed railway, 54% of them are company employees or public institution clerks.
This ratio is higher than for other railways. Passengers with an average monthly household income of $320 and above accounted for 84% of travelers. Those with incomes of more than $800 reached 32%. This expenditure is also significantly higher than for the other lines. The Beijing-Tianjin high-speed rail passengers’ income level is relatively higher.
Marketing measures can be made on account of its high quality service requirements and high consumption capacity.
The Beijing-Tianjin intercity high-speed railway passengers are mainly between 21 - 40 years old. They are active, energetic and are needed to participate in collective activity features such as the implementation of tcorresponding marketing measures.
The Beijing-Tianjin intercity high-speed railway passenger is often a passenger on a long term basis (above 70%). This part of passenger travel
was focused mainly on Friday and the weekends. Corresponding marketing measures such as passenger credits and frequent membership may be considered for this kind of travel feature, so as to enhance their sense of belonging to railway high-speed products.
The Beijing-Tianjin intercity high-speed railway passenger on the rankings for the recognition of the high-speed railway considered speed, convenience, comfort, safety, punctuality and price. Among them the lowest priority is price. From the perspective of income structure, the proportion of low-income passengers between the Beijing and Tianjin high-speed railway stations is significantly lower than the other lines. Under the circumstances of enhancing transportation capacity in the future, additional discount coupons or discount ticket forms can be considered to narrative flow-income passengers, so as to expand the base of commuters.
Based on the date and time of travel, the passenger flow from Friday to Monday, 7am-9am, 4pm-7pm reaches maximum. Train operation plans can make some adjustments according to this data. To improve the efficiency of CRH (China Railway High-speed, usually refers to the emu trains which operate after the sixth railway acceleration in China on April 18, 2007), train number distribution averages can be managed, off-peak period measures such as the 5th point, which is proposed, can be considered and discount coupons or discount tickets can be used to attain a more balanced distribution of passenger flow.
4.2 Analysis of characteristics of Jing-Zheng transport corridor
Jing-Zheng transport line is a section of the Beijing-Guangzhou transport channel, starting from Beijing, traveling through Haoding, Shijiazhuang, Kandan, Xinxiang to the city of Zhengzhou. This is one of the busiest sections of China's north-south transportation. Jing-Zheng channel includes national highway, express highway, railway, civil aviation and other modes of transportation. In 2003, the quantity of railway flow accounted for 26.4%
of all traffic of the channel, and passenger turnover accounted for 33.7% of the total turnover. At the same time, the corresponding highway capacity accounted for 73.6% and 66.3%, respectively. Thus, highways and railways were undertaking most of the traffic pressure. Following the development of China’s society and economy, trip modes of the channel are in continuous developement and stages of improvement. The transportation structure is also changing.
We selected seven areas along this line as samples: Zhengzhou, Xinxiang, Anyang, Handan, Shijiazhuang, Baoding and Beijing. The samples are selected in order to comprehensively and objectively reflect the status of travel. The research method was adopted following a questionnaire and fixed spot study of maximum car flow. Within the comparatively busy lines or sections of the channel, the researchers selected the main long-distance bus station, passenger train and long-distance bus and airport hubs for sampling. The trip direction and the transportation flow has no implications according to the passengers of the investigation, nor does trip distance above 200 km (passenger travel in districts is excluded).
The survey content includes: basic situation of passenger by differing trip mode; the travel purposes, demands and the option of trip modes of passengers; passengers for any mode of transport's satisfaction with the
service properties, and the ideal sort; the level of satisfaction and the ideal rank of the trip modes.
Table 5. Most unsatisfactory service attribute rank (%)
4.2.1 Passengers’ occupation distribution
Passengers’ occupation distribution is mainly composed of different trip modes and the proportion of all kinds of travelers. Business administrators take the largest proportion of the travel flow of Jing-Zheng channel, accounting for 24.1%, followed by scientific research personnel, individual business personnel, workers and peasants.
4.2.2 Passenger income
Survey results show that passengers with an income of less than $160 and
$160-$320 accounted for the largest proportion, 29.4% and 32.1%, respectively. Comparing income level of different models, it can be found that, for passengers with less than $160 monthly income, proportion of highway has the largest proportion; for monthly income between $160-$320, railway has the largest proportion; for monthly income of over $320, flight selection has the largest proportion.
4.2.3 Passenger travel purpose
The purposes of personal affairs, business and visiting relatives, accounted 39%, 16% and 15% respectively, totalling more than 70%.
Official affairs accounted for 39%, for the purpose of business travel, 26%, and non-official business accounted for 33%.
4.2.4 Trip distance
Highway passenger transport is flexible, convenient and suitable for short distance travel. Within the travel distance of less than 300km, highway occupies the biggest proportion of trips; for the distance of more than 300km, railway transportation has a greater market share.
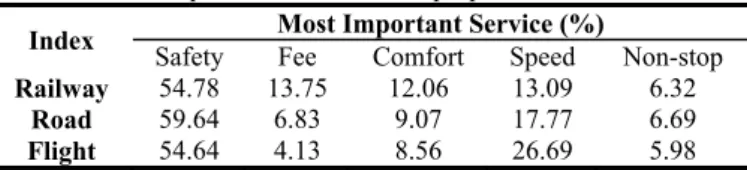
The questionnaire asked passengers to rank the order of the service properties for all the travel modes, assuming that airline, high-speed and high-speed railway, and highway are all available. The most important service properties for different modes of transportation are listed as shown in Table 6.
Index Single mode of transport ation
Expen sive
Uncomfor table
Inconven ient
Uns afe
Slo w
Unpunct ual
Tot al
Railw ay
11.65 23.07 16.10 11.93 6.54 21.
38
9.33 100
Road 5.23 38.69 40.52 3.79 3.41 7.5
6
0.80 100 Fligh
t
9.82 78.04 2.80 7.68 0.97 0.5
2
0.17 100
Table 6. Most important service choice proportion Index Most Important Service (%)
Safety Fee Comfort Speed Non-stop Railway 54.78 13.75 12.06 13.09 6.32
Road 59.64 6.83 9.07 17.77 6.69 Flight 54.64 4.13 8.56 26.69 5.98
Passengers who are mostly concerned about safety, account for about 56%; speed and cost are the second concern, with non-stop service rarely being chosen as the most important factor; with the increasing income of passengers, the cost will no longer be the controlling factor. Passengers are not satisfied mostly with railway transportation being highly priced and low speed, with 23.1% and 21.4% respectively. Compared with Table 2, in which passengers value safety the most, Passenger’s satisfaction in Table 3 is higher for the existing transportation security than for speed, so in comparison, meeting the passenger’s demand about speed and price is more urgent.
4.2.5 Passenger's choice of travel mode
The proportion of passengers who are willing to choose the CRV is the largest, about 42.4%. It is followed by highway, which is about 16.7%. This suggests that the demand of passengers is more about speed and comfort.
These demands should determine the direction of future transportation development. However at the same time, there are 14.4% of passengers choosing the present railway, showing that there are still some consumers considering cost as the key factor of their decision.
4.2.6 Travel frequency
Table 7. The number of passenger travels
railway average most
0 ~ 10 times 7.2 4
0 ~ 20 times 14.5 5
airplane average most
0 ~ 5 times 4.2 2
Research data shows that most of the passengers travel by railway 0 - 10 times per year, with an average of 7.2 times, and with four times at most.
Passengers by highway are mainly concentrated in the range of 0 - 20 times, with an average of 14.5 times, and with five times at most. The frequency by airplane mainly concentrated in the range of 0 - 5 times, with an average of 4.2 times, and two times at most. The travel frequency distribution curve is as shown in Table 7.
The number of passengers traveling by highway is significantly larger than by train (about once). This suggests that the railway service is not sufficient, neither is transport supply and the development of the regional railway is further needed.
4.2.7 Conclusion
By analyzing the social and economic features, travel purpose, trip distance and the trip mode choice behavior for Jing-Zheng transport channel, this paper can predict the demand structure change for future rail lines, so as to guide the coordinated development of transportation.
In the future transportation market, safety, speed and comfort will be the main factors that are considered by the majority of passengers. Construction of high-speed railway, direct expressway and a complete network of express highway and civil aviation is the best choice for the complex and diverse demands of the future passenger.
It should be pointed out that further study is needed to analyze the different psychological factors of behavior and the natural environment of different passengers.
5. SUMMARY
Through an analysis of the intercity transportation characteristics of Beijing-Tianjin and Jing-Zheng urban agglomerations, we can conclude three characteristics for intercity transportation:
1) Intercity transportation is still primarily for business purposes; the future trend has turned to meet the mutual demands of commuter and business.
2) The intercity rail has become the most popular trip mode for business purposes for its speed, convenience and safety. As cost is still the main influencing factor of the intercity rail, the users are still mainly high income people. Therefore, further action of reducing cost is needed to satisfy the travel demand of the majority of passengers.
3) Thanks to the speed, many long-distance intercity commutes can take place during the daytime. The intercity rail shows a peak in the morning and evening. It also provides support and assurance for commuter travel.
Note
This paper is supported by Projects in the National Science &
Technology Pillar Program of China (2012BAJ15B05).
REFERENCES
Chandra, R. B. and Sujit, K. S. (2000). “A comprehensive daily activity-travel generation model system for workers”. Transportation Research Part A , 34, 1-22.
Corradino, C. S. (2000). Southeast Florida Regional Travel Characteristics Study Executive Summary Report.
Dargay, J. M. and Clark, S. (2012). “The determinants of long distance travel in Great Britain.” Transportation Research Part A ,46, 576-587.
Feng, X. et al. (2006). “A travel demand prediction model with feedback for Jabodetabek metropolitan area, Indonesia”. 5th International Conference on Traffic and Transportation Studies.
Gao, D. (2011). “The application of gravity model on passenger volume forecast of the passenger dedicated line”. Southwest Jiaotong University.
Khandker, M. et al. (2009) “An investigation of commuting trip timing and mode choice in the Greater Toronto Area: application of a joint discrete-continuous model”.
Transportation Research Part A, 43, 639-653.Li, J. et al. (2006). “Trip characteristics of intercity and incity of Changzhutan urban agglomeration”. Transportation Science &
Technology, 6, 69-73.
Song, C. (2010). “Resident trip characteristics comparison in main cities among three city circles of China”. Transportation, 7, 1-4.
Yusak,S. and Ryuichi, K. (2008). “Structural changes in commuters’ daily travel: the case of auto and transit commuters in the Osaka metropolitan area of Japan”. Transportation Research Part A, 42, 95-115.
Zhang, P. et al. (2006). “Distilling inner influencing factors on port throughput”. China harbor engineering, 146.
Zhang, Y. et al. (2000). “Variable comparison for introducing "feedback" in travel demand model-application in New York Metropolitan area”. 2nd International Conference on Traffic and Transportation Studies.
Zhou, Q. et al. (2007). “Comparison and analysis of urban resident trip characteristics”.
Central South Highway Engineering, 32(2), 145-150