Proceedings of the 40th JAXA Workshop on “Investigation and Control of Boundary-Layer Transition”
Introduction of Towing Wind Tunnel Facility in Sunrise Beach Research Facility
S. Yoshioka
*, T. Kato
*, and Y. Kohama
**
Institute of Fluid Science, Tohoku University
ABSTRACT
In this paper a newly constructed Towing wind tunnel facility is introduced. This Towing wind tunnel system can create highly complex flow and zero free stream turbulence condition. The performance of this facility is first explained. The results of our first experiment on the boundary layer transition on a flat plate are then given. We concluded that this facility has good performance for complex flow testing under very low freestream turbulence condition.
Key Words: Towing wind tunnel, free stream turbulence, Boundary-Layer transition
1. Introduction
Fluid dynamics experiments have ever been done using wind tunnel. Highly complex flow such as flow between steady surface and moving obstacle is, however, hardly realize in this kind of conventional wind tunnel. It is also hardly realize the zero free stream turbulence condition. These two major fundamental problems make wind tunnel difficult to re-create actual flow condition.
To solve the first problem mentioned above, such as to re-create flow under a moving automobile on the ground and flow around an airplane taking off and touching down in the wind tunnel, we often use a moving belt system set up in the bottom wall of the wind tunnel. This moving belt, however, always generates wall vibration and electric noise which interfere the measurement especially in the region close to the wall. As to the second problem mentioned above, fan certainly generates free stream turbulence.
This is fundamentally impossible to avoid. The moving belt also generates turbulence which level is not negligible.
In this paper the development of towing wind tunnel, that may fundamentally solve above mentioned problems is reported. Some first results of experiments of boundary layer transition using this facility is then explained.
2. Towing Wind Tunnel
We have built 7 km long testing line in Sunrise beach research facility of Tohoku University in Hyuga city, Miyazaki, Japan in 2003. In the first 2 km out of total 7 km we constructed a testing track of the towing wind tunnel. A schematic of this facility is shown in Fig. 1. The first 910 m is accelerating region, the next 515 m is the measuring region and the final 475 m is the decelerating region. In this track an electrically driven vehicle runs, see Fig. 2. We named this facility
as HART which stands for Hyuga Aerodynamic Research facility by Towing. We call the vehicle as HART vehicle.
The measuring region is covered by FRP hood in which acoustic material was installed to avoid external noise. In this hood ventilators and lighting facilities are set up. This HART vehicle has 8 tires underneath its body to run, and 4 side tires to guide. 4 tires out of 8 tires underbody was electrically driven.
4 side tires are forced to touch guide walls by springs.
At the nose of this HART vehicle an arm supported by hydraulic pressure actuators is equipped. On the tip of this arm an testing model is set. The vibration of the this arm is minimized by the actively controlled hydraulically operated actuator. The acceleration and deceleration rates are 0.15G and -0.45G. The maximum speed of this HART vehicle is 50 m/s.
This HART vehicle is radio controlled from the control room beside the testing track
3. Experiments 3.1 Performance test
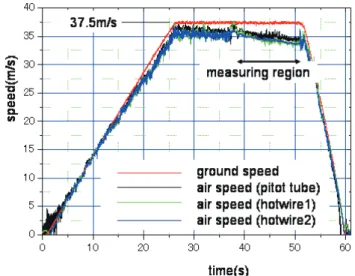
In Fig. 3 the ground speed and air speed measured by a pitot tube and two hotwires set up on the arm of the HART vehicle are shown. The experiment speed was set at 37.5 m/s as a ground speed. In the middle of the accelerating region the ground speed reached to 37.5 m/s. In the measuring region the air speed is decreasing. As a whole, the air speed is slightly slower as compared with the ground speed. This may be because the HART vehicle drives air around the vehicle itself. This trend is remarkably found in the measuring region. It is inferred that the vehicle pushes out the air inside of the measurement region to the exit direction. As a result, in the exit region of the hood the air speed is slower roughly 10% than the ground speed.
This document is provided by JAXA.
0 JAXA Special Publication JAXA-SP-07-06E
3.2
Boundary-layer transition measurement
In the next stage we replaced the arm on the HART vehicle by a vertical flat plate, see Fig. 4, and tried to measure the boundary layer transition on this flat plate.
We put a single hot wire sensor 1 mm away from the surface of the flat plate. We measured velocity signals changing the streamwise location of this sensor keeping the vehicle ground speed constant, 45 m/s to see their Reynolds number dependence.
Fig. 5 shows the obtained velocity signals. Signals in Fig. 5 are representative signals measured in laminar (Re=1.6×10⁶), intermittent (Re=2.4×10⁶, 3.2×10⁶) and turbulent (Re=9.2×10⁶) boundary layers.
In the signals measured in the intermittent boundary layer (Re=2.4×10⁶, 3.2×10⁶), the passage of the turbulent spots are clearly observed as a positive spike.
The transitional Reynolds number Retr where the intermittency factor falls to 0.5 is determined as Retr ~ 4.0×10⁶. It can be therefore concluded that the free stream turbulence of HART facility is extremely low and boundary layer transition occurs at higher Reynolds number.
Fig .1 Schematic view of HART, towing wind tunnel facility
Fig .2 HART vehicle running in the measuring region
Fig .3 Comparison of ground and air speed of HART vehicle
Fig. 4 Vertically installed flat plate on HART vehicle
㪏 㪈 㪇 㪈 㪉 㪈 㪋 㪈 㪍 㪈 㪏 㪉 㪇 㪉 㪉
㪇 㪉 㪇 㪇 㪋 㪇㪇 㪍㪇 㪇
㫋㫀㫄㪼㩿㫄㫊㪀
㫍㪼㫃㫆㪺㫀㫋㫐㩿㫄㪆㫊㪀
㪩㪼 㪔㪐 㪅㪉㫏㪈 㪇㪵㪍 㪩㪼 㪔㪊 㪅㪉㫏㪈 㪇㪵㪍 㪩㪼 㪔㪉 㪅㪋㫏㪈 㪇㪵㪍 㪩㪼 㪔㪈 㪅㪍㫏㪈 㪇㪵㪍
Fig. 5 Measured velocity signals
This document is provided by JAXA.