Development of Water Quality
Improvement Channel with Citizen
in Amagasaki Canal, Japan
Ryoichi YAMANAKA1, Yasunori KOZUKI1, Keisuke ISSHIKI2,
Sayaka MORI1, Mari MAEDA1, Hironori Okegawa1,
Hiroshi KAWAI3, Mamoru ISHIGAKI4, Takashi NAKANISHI5,
Hideki UESHIMA4 and Sumio HIRAI6
1 The University of Tokushima 2 KOBELCO Eco-Solutions Co., Ltd 3 Kobe University
4 Hiroshima Institute of Technology 5 Osaka City University
Table of Contents
1. Introduction
2. Method
New System of Water Quality Improvement
3. Results and Discussion
Effect of Water Quality Improvement Channel
Water Quality Improvement Activity with
Citizen
Background
~Amagasaki Canal~
● Location of Amagasaki Canal
Closed by two water gates Industrial area
This coastal area is surrounded by vertical seawalls.
⇒Water pollution problem !!
Osaka Bay Pacific Ocean Japan 30㎞ Osaka Bay 1km Lockage (Ama Lock) Water gate (Kitahori) Amagasaki Canal
Environmental Conditions
Water quality of Amagasaki Canal is one of the pollution area in the world !!
High concentration of suspended solids Eutrophication Suspended Solids Phytoplankton Deteriorated sediment Anoxic oxygen Deteriorated sediment Damage of Blue tide Industrial waste water
The Sea Blue Project of Amagasaki
~The Sea Blue Project of Amagasaki ~
●Purpose : Water quality improvement
for recreation demand
●Requirement : Low cost, Low environmental load,
Sustainability
⇒Biological reduction function, Civic collaboration
New System of Water Quality Improvement
Objectives
1. Applicability evaluation for new water quality improvement technique in Amagasaki canal
2. Beginning new nutrient removal activity with children and evaluation of the educational effect for parents
New System of
Water Quality Improvement
SS Removal
Aquarium
1
Dissolved N&P
Removal Channel
2
Composting
3
Bivalve AlgaeMaterial Flow of New System
Surface seawater in canal POC
【Phy.pla】 【Phy.pla】PN 【Phy.pla】PP
1 Catch Transform & Rejection 2 DIN PO4-P Assimilation 3 Algae Pick up the algae and bivalve in the channel with local
people, after composting. Bivalve
Experimental Equipment
6600 300 4600 9200 【Unit : mm】Measurement items Period
Water Quality Temperature Salinity DO In September 2007, Once a month Dissolved inorganic nitrogen (DIN) & phosphorus (PO4-P)
Algae Contained carbon and nitrogen October 2009 and August 2010 Experimental condition Length 120 m Width 0.3 m Depth Ave. 0.12 m Flow rate 25 L/min Residence time 2.7 hr
Results
Change in DIN and PO
4-P concentration
in the channel in summer daytime
St.1 St.5
St.4
St.3 St.2
Inflow Outflow
⇒Concentration of nutrients decreased drastically from St.1 to St.3. Therefore, we consider that efficient length of the
channel is only 60 meters in Amagasaki canal.
DIN
PO
4-P
0 0.2 0.4 0.6 S t.1 S t.2 S t.3 S t.4 S t.5 PO 4 -P ( m g/L ) Inflow O utflow 0 0.3 0.6 0.9 1.2 S t.1 S t.2 S t.3 S t.4 S t.5 N H 4-N N O 2-N N O 3-N D IN ( m g/L ) Inflow O utflowReduction function of DIN and PO
4-P in daytime
St.1St.3
R : Amount of reduction (mg/day)
CSt.1,3 : DIN and PO4-P concentration (mg/L)
Q : Flow rate (L/day)
Results
Summer time 0 20 40 60 80 100 1 3 5 7 9 11 1 3 5 7 9 11 1 3 5 7 D IN P O4-P R em ov al r at e (%) 【m onth】 2008 2009 2010 0 4 8 12 16 0 1 2 3 4 1 3 5 7 9 11 1 3 5 7 9 11 1 3 5 7 D IN P O4-P D IN (g N /da y) PO 4 -P (g P /d ay ) 2008 2009 2010 【m onth】Amount of reduction
Removal rate
Design for Restoration Plant ①
⇒Twenty-nine 60m-channels are required for total industrial
waste water to meet environmental standards of Japan
(0.09 mg/L) for PO4-P.
Canal
Industrial waste water
Restoration Plant
C
I
N
/
N : The number of channels (60m-channels)
I : Concentration of nutrients in
industrial waste water (mg/day)
C : Collecting algae in summer (mg/day)
Case1
Collecting algae in summer
⇒Five 60m-channels are required for total industrial waste water to meet environmental standards of Japan (0.09 mg/L)
for PO4-P.
Design for Restoration Plant ②
N : The number of channels (60m-channels)
I : Concentration of nutrients in
industrial waste water (mg/day)
R : A maximum amount of reduction (mg/day)
R
I
N
/
Canal
Restoration Plant
Case2
Continue the best summer daytime removal capability (Without collection of algae)1.Algae cleaning in the channel with Junior high
school students
2.Education for Sustainable Development (ESD)
for elementary school
Water Quality Improvement
Activity with Citizen
Date : August 18, 2010
Number of participants : 10 Cleaning time : 30min.
Picked up amount of algae : 13 wet.kg Impressions :
① It was a work worth doing ② Very tired !!
③ I feel like I improved water quality. ④ I enjoyed a lot!
⑤ I want to do this again !
Algae cleaning in the channel and composting
with local junior high-school students
Algae Cleaning in the Channel
Present for Bury algae in the ground Picked up algae Composting Potato Raspberry
ESD
The Restoration Plant can be used as a place
learning education for sustainable development
Age : 9 years old
Total number of participants
in 2010 : 440
Result of a questionnaire for
parents :
“Do you change in environmental
problems attitudes” (N=116)
興味・関心が向上 興味・関心が低下 変化なし 53.0% 9.1% 37.9% Increase awareness of the problems Decrease awareness of the problems Not changes興味・関心が向上
興味・関心が低下
変化なし
43.1%
5.2%
51.7%
興味・関心が向上
興味・関心が低下
変化なし
43.1%
5.2%
51.7%
興味・
興味・
関心が向上
関心が低下
変化なし
43.1%
51.7%
18/21Water Quality Improvement with
Citizen in Amagasaki Canal
Citizens
Hyogo Pref.
and Amagasaki City
Company University
New Water Quality Improvement Plant
Elementary School, Junior High School and High School
Tidal flat SS Removal Aquarium Dissolved N&P Removal Channel Compostin g ESD
First plant will be completed in this winter !!
10m
New Plant of Water Quality
Improvement
March, 2011 Construction started
in December, 2010
4. Conclusions
Applicability of the water restoration plant using primary production of autogenetic algae to the Amagasaki Canal is confirmed by long-term field experiment. And beginning new nutrient removal activity with children and evaluation of the educational effect for parents
1.We found the effect of water quality improvement channel. (5 to 29 60m-channels need total industrial waste water to
meet environmental standards of Japan for PO4-P.)
2.It's necessary that someone to cleanup decomposed sea algae. We created a cooperative framework with a local junior high-school and students, and composted algae.
This achievement means that new social-based water quality restoration is starting at the Amagasaki Canal.
Thank you for your
attention
-3 -2 -1 0 0 4 8 12 16 20 24 8/6 11:00 13:00 15:00 17:00 19:00 21:00 23:00 8/7 1:00 3:00 5:00 7:00 9:00 -3 -2 -1 0 0 30 60 90 120 150 180 8/6 11:00 13:00 15:00 17:00 19:00 21:00 23:00 8/7 1:00 3:00 5:00 7:00 9:00 DO(mg/L) supersaturated hypoxia Chl.a( g/L)
Water Quality of Amagasaki Canal in Summer
Results of investigation for 24 hours(Chl.a,DO) in summerChl.a was high in surface, and red tide occurred. DO was below 1mg/L at the bottom in summer. Bottom water was chronic hypoxia. The stratification was kept through the
0 0 .5 1 1 .5 2 2 .5 3 3 .5 4 S t.1 S t.2 S t.3 S t.3 - 1 S t.3 - 2 S t.4 S t.5 S t.5 - 1 S t.6 S t.7 S t.8 S t.9 S t.1 1 2 0 0 8 .8 .6 表 層 P N D O N N O 3 - N N O 2 - N N H 4 - N 0. 39 4 0. 93 1. 41 0. 57 4 0. 81 4 0. 60 4 0. 42 6 0. 82 2 0. 43 6 1. 32 1. 77 2. 7 0. 53 0. 00 6 0. 06 6 0. 01 6 0. 07 6 0. 07 2 0. 09 0. 07 0. 01 8 0. 05 6 0. 00 4 0. 11 4 0. 04 0. 04 6 0. 00 4 0. 06 8 0. 00 3 0.68 7 0. 09 1 0. 56 6 0. 72 9 0. 74 1 0. 98 5 0. 79 0. 18 7 0. 08 9 0. 22 0. 34 0. 93 1 N (m g/ L ) 0 0 .5 1 1 .5 2 2 .5 3 3 .5 4 S t.1 S t.2 S t.3 S t.3 - 1 S t.3 - 2 S t.4 S t.5 S t.5 - 1 S t.6 S t.7 S t.8 S t.9 S t.1 1 2 0 0 8 .8 .6 表 層 P N D O N N O 3 - N N O 2 - N N H 4 - N 0. 06 6 0. 19 2 0. 02 2 0. 11 4 0. 07 8 0. 07 6 0.09 8 0. 09 8 0. 09 4 0.09 2 0. 13 6 0. 06 4 0.1 0. 09 8 0. 12 8 0. 11 8 0. 12 6 0. 00 6 0. 09 4 0. 02 4 0. 02 8 0. 21 4 0. 04 0. 02 8 0. 62 4 1. 17 1. 31 0. 46 2 0. 19 1 0. 54 4 0. 61 1 0. 6 0. 17 1 0.35 7 0. 22 5 0. 63 6 1. 46 1. 7 2. 12 0. 53 7 0. 3 0. 03 4 0. 19 1 調 査 地 点 N (m g/ L ) 0 0 .5 1 1 .5 2 2 .5 3 3 .5 4 S t.1 S t.2 S t.3 S t.3 - 1 S t.3 - 2 S t.4 S t.5 S t.5 - 1 S t.6 S t.7 S t.8 S t.9 S t.1 1 2 0 0 8 .8 .6 表 層 P N D O N N O 3 - N N O 2 - N N H 4 - N 0. 39 4 0. 93 1. 41 0. 57 4 0. 81 4 0. 60 4 0. 42 6 0. 82 2 0. 43 6 1. 32 1. 77 2. 7 0. 53 0. 00 6 0. 06 6 0. 01 6 0. 07 6 0. 07 2 0. 09 0. 07 0. 01 8 0. 05 6 0. 00 4 0. 11 4 0. 04 0. 04 6 0. 00 4 0. 06 8 0. 00 3 0.68 7 0. 09 1 0. 56 6 0. 72 9 0. 74 1 0. 98 5 0. 79 0. 18 7 0. 08 9 0. 22 0. 34 0. 93 1 調 査 地 点 N (m g/ L ) 0 0 .5 1 1 .5 2 2 .5 3 3 .5 4 S t.1 S t.2 S t.3 S t.3 - 1 S t.3 - 2 S t.4 S t.5 S t.5 - 1 S t.6 S t.7 S t.8 S t.9 S t.1 1 2 0 0 8 .8 .6 表 層 P N D O N N O 3 - N N O 2 - N N H 4 - N 0. 06 6 0. 19 2 0. 02 2 0. 11 4 0. 07 8 0. 07 6 0.09 8 0. 09 8 0. 09 4 0.09 2 0. 13 6 0. 06 4 0.1 0. 09 8 0. 12 8 0. 11 8 0. 12 6 0. 00 6 0. 09 4 0. 02 4 0. 02 8 0. 21 4 0. 04 0. 02 8 0. 62 4 1. 17 1. 31 0. 46 2 0. 19 1 0. 54 4 0. 61 1 0. 6 0. 17 1 0.35 7 0. 22 5 0. 63 6 1. 46 1. 7 2. 12 0. 53 7 0. 3 0. 03 4 0. 19 1 調 査 地 点 N (m g/ L ) 0 0 .5 1 1 .5 2 2 .5 3 3 .5 4 S t.1 S t.2 S t.3 S t.3 - 1 S t.3 - 2 S t.4 S t.5 S t.5 - 1 S t.6 S t.7 S t.8 S t.9 S t.1 1 2 0 0 8 .8 .6 表 層 P N D O N N O 3 - N N O 2 - N N H 4 - N 0. 39 4 0. 93 1. 41 0. 57 4 0. 81 4 0. 60 4 0. 42 6 0. 82 2 0. 43 6 1. 32 1. 77 2. 7 0. 53 0. 00 6 0. 06 6 0. 01 6 0. 07 6 0. 07 2 0. 09 0. 07 0. 01 8 0. 05 6 0. 00 4 0. 11 4 0. 04 0. 04 6 0. 00 4 0. 06 8 0. 00 3 0.68 7 0. 09 1 0. 56 6 0. 72 9 0. 74 1 0. 98 5 0. 79 0. 18 7 0. 08 9 0. 22 0. 34 0. 93 1 調 査 地 点 N (m g/ L )
Result of Nutrients (NH4-N,NO2-N,NO3-N,DON,DTN,TN)
Left : surface-1.0m Right : bottom+1.0m
Canal had higher concentration of nitrogen nutrients than sea.
NH4-N was very high at the bottom of the canal.
1km
In canal
0 .1 0 .3 0 .5 0 .7 0 .9 1 .1 1 .3 1 .5 S t.1 S t.2 S t.3 S t.3 - 1 S t.3 - 2 S t.4 S t.5 S t.5 - 1 S t.6 S t.7 S t.8 S t.9 S t.1 1 P P D O P P O 4 - P 0. 08 8 0. 00 6 0. 11 6 0. 10 2 0. 11 8 0. 12 2 0. 04 4 0. 11 6 0. 01 8 0. 01 6 0. 04 2 0. 00 2 0. 02 7 0. 00 9 0. 02 8 0. 04 9 0. 04 1 0. 05 1 0. 01 7 0. 03 6 0. 00 3 0. 00 6 P (m g/ L ) 調 査 地 点 2 0 0 8 8 .6 表 層 0 0 .5 1 1 .5 2 S t.1 S t.2 S t.3 S t.3 - 1 S t.3 - 2 S t.4 S t.5 S t.5 - 1 S t.6 S t.7 S t.8 S t.9 S t.1 1 P P D O P P O 4 - P 0 .0 8 8 0 .0 0 6 0 .1 1 6 0 .1 0 2 0 .1 1 8 0 .1 2 2 0 .0 4 4 0 .1 1 6 0 .0 1 8 0 .0 1 6 0 .0 4 2 0 .0 0 2 0 .0 2 7 0.0 0 9 0 .0 2 8 0 .0 4 9 0 .0 4 1 0 .0 5 1 0 .0 1 7 0 .0 3 6 0 .1 6 6 0 .1 3 7 0 .1 2 7 0 .1 0 9 0 .1 6 1 0 .1 2 0 .1 7 0.07 6 0 .1 0 3 0 .0 9 9 0 .1 0 3 0 .1 3 1 0 .1 2 2 P (m g/ L ) 調 査 地 点 2 0 0 8 8 .6 表 層 0 0 .5 1 1 .5 2 S t.1 S t.2 S t.3 S t.3 - 1 S t.3 - 2 S t.4 S t.5 S t.5 - 1 S t.6 S t.7 S t.8 S t.9 S t.1 1 P P D O P P O 4 - P 0. 17 2 0. 43 0. 77 6 0. 34 0. 42 8 0. 31 2 0. 19 6 0. 39 2 0. 21 0. 42 4 0. 91 4 1. 33 0. 24 4 0. 01 8 0.02 5 0. 02 7 0. 12 8 0. 11 1 0. 08 2 0. 28 4 0. 2 0. 16 7 0. 07 2 0. 28 1 0. 20 9 0. 42 4 0. 00 9 P (m g/ L ) 調 査 地 点 2 0 0 8 8 .6 底 層 0 0 .5 1 1 .5 2 S t.1 S t.2 S t.3 S t.3 - 1 S t.3 - 2 S t.4 S t.5 S t.5 - 1 S t.6 S t.7 S t.8 S t.9 S t.1 1 P P D O P 0. 08 8 0. 00 6 0. 11 6 0. 10 2 0. 11 8 0. 12 2 0. 04 4 0. 11 6 0. 01 8 0. 01 6 0. 04 2 0. 00 2 0. 02 7 0.00 9 0. 02 8 0. 04 9 0. 04 1 0. 05 1 0. 01 7 0. 03 6 0. 16 6 0. 13 7 0. 12 7 0. 10 9 0. 16 1 0. 12 0. 17 0.07 6 0. 10 3 0. 09 9 0. 10 3 0. 13 1 0. 12 2 P (m g/ L ) 調 査 地 点 2 0 0 8 8 .6 表 層 0 0 .5 1 1 .5 2 S t.1 S t.2 S t.3 S t.3 - 1 S t.3 - 2 S t.4 S t.5 S t.5 - 1 S t.6 S t.7 S t.8 S t.9 S t.1 1 P P D O P 0. 17 2 0. 43 0. 77 6 0. 34 0. 42 8 0. 31 2 0. 19 6 0. 39 2 0. 21 0. 42 4 0. 91 4 1. 33 0. 24 4 0. 01 8 0.02 5 0. 02 7 0. 12 8 0. 11 1 0. 08 2 0. 28 4 0. 2 0. 16 7 0. 07 2 0. 28 1 0. 20 9 0. 42 4 0. 00 9 P (m g/ L ) 調 査 地 点 2 0 0 8 8 .6 底 層 Result of Nutrients(PO4-P,DTP,TP) Left : surface-1.0m Right : bottom+1.0m 1km In canal Sea
Canal had higher concentration of phosphoric nutrients than sea. Surface: 1.7 times, Bottom: 2.5 times
Pump up
water level Bottom Water Surface Water
Season 2008 2009 2010
Spr. Sum. Aut. Win. Spr. Sum. Aut. Win. Spr. Sum. Side wall
Bottom
Species of Algae in The Channel
Green Algae Brown Algae 2㎝ 10㎝ 2㎝ Blue-green Algae 2㎝ 2㎝ 2㎝ 2㎝
Results
0 0.3 0.6 0.9 1.2 S t.1 S t.2 S t.3 S t.4 S t.5 D ay N ight D IN (m gN /L ) Inflow O utflow 0 0.2 0.4 0.6 0.8 S t.1 S t.2 S t.3 S t.4 S t.5 D ay N ight PO 4 -P (m gP /L ) Inflow O utflowChange in DIN and PO
4-P concentration in the channel in summer
St.1 St.5
St.4
St.3 St.2
Inflow Outflow
Day :Reduction in the concentration of DIN &PO4-P were 40 ~ 75% , which were
similar to sewage treatment facility.
Night : The dead algae were decomposed by microorganism .
This is considered to be the cause of the increases of concentration of DIN and PO4-P in the channel.
Dissolved NP Removal Channel
Item Period
Removal by algae in water flow Removal by collecion of algae N P N P 1 year 483g (5%) 74g (5%) 1444g (16%) 201g (13%) 2 weeks in summer 4.3g (2%) 0.2g (1%) 65g (28%) 9g (20%)
Experiment using LED in the
channel at nighttime
The Amagasaki Sea Blue Project
New Water Quality Improvement System
The Amagasaki Canal is great waterfront in a big city
⇒ Many citizens will hope to be new utilizing of the canal.
However, It is impossible that water quality improvement by a civic undertaking because of the budget deficit problem.
Amagasaki
Canal
Recreation Education Event StudyObjectives
New Water Quality
Improvement Systems
CompostingC
SS Nutrient (N.P) Phytoplankton SS Removal AquariumA
Inflow Surface Water 【High SS】 Organic mud Bottom Water 【Low O2 &High NP】 Dissolved NP Removal ChannelB
Outflow Dissolve N,PTaking up algae from the channel and turning removed sea algae into compost.
Treated Water
【High O2 & Low
NP】
0 5 10 15 20 0 20 40 60 80 100 120 N ight D ay D O (m g/ L )
O xygen depletion line
(m )
≪O
2provided effect
for Primary Productivity of Algae
≫
Date Measurement item
17.August 2009
Temperature(○
C) Salinity (psu) DO (mg/L)
Day Night Day Night Day Night
St.1 29.1 27.7 20.5 23.6 2.8 1.0 St.2 31.5 27.2 21.7 23.3 8.5 0.6 St.3 32.8 26.9 22.2 23.0 13.6 0.8 St.4 33.3 26.7 22.5 22.9 16.8 0.8 St.5 33.0 26.6 23.2 23.1 17.4 1.0 St.1 St.5 St.4 St.3 St.2 Inflow Outflow
Before
SS Removal Aquarium
2.5cmAfter
40min
SS is removed 65%a) 学習シートに聞いたことをメモ b) 淡水と海水の密度の違いを知る実験 c) ヘドロの観察 f) 運河に住む生物の観察 (沈水ネットの付着 生物) d) 水のにごりを調べる実験 e) 運河に住む生物の観察(実験水路) 小学校3年生を対象とした環境学習実施風景 小学校名 環境学習参加人数 (名) 2009年度 2010年度 成徳 41 40 明城 87 実施予定12月 西 74 10/19 表1 これまでの環境学習参加人数
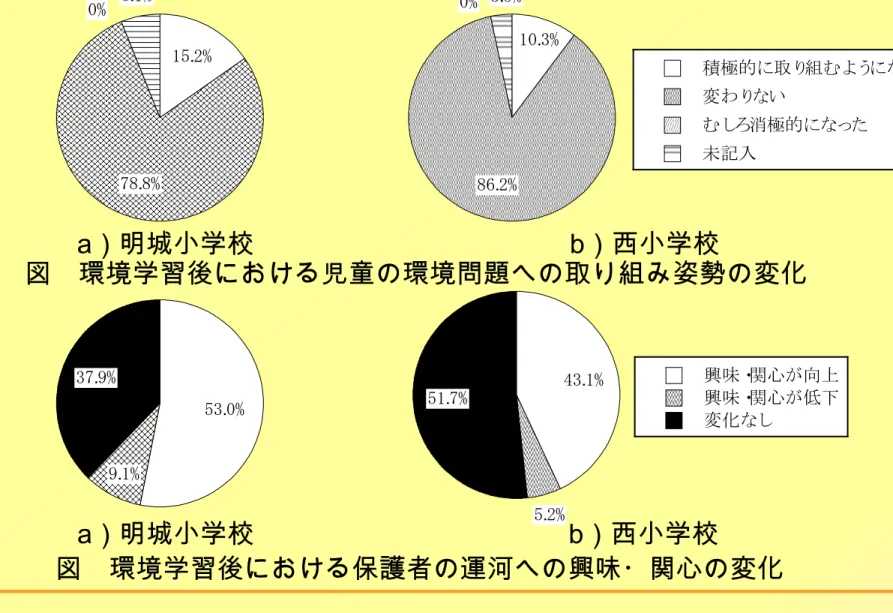
図 環境学習後における児童の環境問題への取り組み姿勢の変化a)明城小学校 b)西小学校 図 環境学習後における保護者の運河への興味・関心の変化 ●環境学習後,約1割の児童に環境問題へ積極的に取り組む姿勢の変化がみられた. ●環境学習で学んだことを子供から聞き,保護者のうちの約半数に運河への興味・関心の向上 がみられた. ●興味・関心が向上したグループと低下したグループ間で,子供が話した学習内容の数を比較 a)明城小学校 b)西小学校 興味・関心が向上 興味・関心が低下 変化なし 53.0% 9.1% 37.9% 興味・関心が向上 興味・関心が低下 変化なし 43.1% 5.2% 51.7% 積極的に取り組むようになった 変わりない むしろ消極的になった 未記入 15.2% 78.8% 0% 6.1% 積極的に取り組むようになった 変わりない むしろ消極的になった 未記入 10.3% 86.2% 0% 3.5%