PAPER
Optimization of Hybrid Energy System Configuration for Marine Diesel Engine
Guangmiao ZENG†a),Nonmember, Rongjie WANG††b),Member,andRan HAN†c),Nonmember
SUMMARY Because solar energy is intermittent and a ship’s power- system load fluctuates and changes abruptly, in this work, the solar radi- ation parameters were adjusted according to the latitude and longitude of the ship and the change of the sea environment. An objective function was constructed that accounted for the cost and service life simultaneously to optimize the configuration of the marine diesel engine hybrid energy sys- tem. Finally, the improved artificial bee colony algorithm was used to op- timize and obtain the optimal system configuration. The feasibility of the method was verified by ship navigation tests. This method exhibited better configuration performance optimization than the traditional methods.
key words: artificial bee colony algorithm, hybrid energy system, diesel engine, optimal configuration, photovoltaic power generation
1. Introduction
A diesel engine generates power using petroleum fuel, which is a heavy polluter. In recent years, green clean energy, such as solar and wind energy, has been used to- gether with diesel engines to supply power to loads, thereby achieving the goal of conserving energy and reducing emis- sions [1]. To realize the optimal configuration of hybrid energy systems, researchers have proposed methods based on genetic algorithms[2]–[4], the particle swarm optimiza- tion algorithm[5],[6], differential evolution[7], and har- monious search [8], [9]. These methods are mainly used for stationary hybrid energy systems. In previous reports, [8],[10], the researchers calculated the solar-panel size, tilt angle, and power output in photovoltaic-power-generation systems based on the geographical location of the city in which the study was conducted to determine the optimal configuration of such hybrid energy systems. The existing methods are used more for onshore hybrid energy systems and less for optimization of shipboard hybrid energy system configurations. Ships are in motion, and long-haul ships, in particular, have long operating hours and travel long dis- tances. Therefore, a ship hybrid energy system used for maritime navigation must consider the geographical loca- tion of the ship and its associated solar radiation. There have been multifaceted studies on energy storage systems on land
Manuscript received March 31, 2020.
Manuscript revised September 13, 2020.
Manuscript publicized November 11, 2020.
†The authors are with the School of Marine Engineering, Jimei University, Xiamen 361021, China.
††The author is with Fujian Provincial Key Laboratory of Naval Architecture and Ocean Engineering, Xiamen 361021, China.
a) E-mail: [email protected]
b) E-mail: [email protected] (Corresponding author) c) E-mail: [email protected]
DOI: 10.1587/transfun.2020EAP1035
[11]–[15]. The coordinated operation of battery packs and solar systems was analyzed to optimize the hourly battery power allocation strategy [16], [17]. The energy storage equipment in the microgrid was analyzed, and the perfor- mance of the system was optimized by changing the layout [18], [19]. Three different battery technologies were pro- posed to optimize unit cost of electricity [20]. Compared with onshore hybrid energy systems, a ship energy system’s operation mode is island-type. In addition to the equipment cost, the service life of the equipment is an important factor in the optimal configuration. Therefore, using a combina- tion of three different battery technologies, the configuration of a marine diesel hybrid energy system was optimized from a cost and service life perspective in this study.
The paper is organized as follows. Optimization of the hybrid energy system configuration is formulated in Sect. 2. In Sect. 3, we first introduce an improved artificial bee colony (IABC) algorithm. We subsequently proposed the optimized configuration of a hybrid diesel energy sys- tem using an improved artificial bee colony algorithm. Fi- nally, the performance of the proposed method is numeri- cally evaluated in Sect. 4, and concluding remarks are pre- sented in Sect. 5.
2. Problem Formulation
The studied marine diesel hybrid energy system is shown in Fig. 1. In a ship hybrid energy system, the power to the load is supplied mainly by solar and wind energy. If the solar and wind energy cannot meet the load requirement at a certain time, auxiliary power is sequentially supplied by battery packs and the diesel engine. When solar and wind energy are abundant, excess energy is stored in the battery packs.
2.1 Photovoltaic-Power-Generation Module
Different from the land, the application of photovoltaic power generation modules on ships has limitations. Due to the variety of ships, unlike oil tankers, some ships are not suitable for laying large-scale solar panels on decks, such as bulk carriers and container ships. Therefore, individual analysis is needed in practical applications.
During ship navigation, the amount of solar radia- tion received by the photovoltaic-power-generation module varies constantly. Therefore, the method illustrated in Fig. 2 was used to adjust the quantity of the solar radiation of the Copyright c2021 The Institute of Electronics, Information and Communication Engineers
Fig. 1 Schematic of a ship hybrid energy system.
Fig. 2 Solar-radiation calculation process.
ship’s photovoltaic-power-generation module. It in the fig- ure is the actual radiation intensity of the unit photovoltaic- power-generation module at timet. In [21], a method for calculating the correspondence between the solar radiation intensity and the solar position is provided.
e=9.87 sin 2B−7.53 cosB−1.5 sinB, (1) whereB= 360(n−81)364 ,n=1,2,· · ·,365,erepresents the time difference (in min), andnrepresents the number of days (on January 1,n=1).
The true solar timeHcan be obtained by H=Hs±L−Ls
15 + e
60, (2)
Ls=15◦·tz, (3)
whereHsis the standard time of the region inh,Lis the local longitude in degrees, Ls is the longitude of the local area standard in degrees,±is positive for the Eastern Hemisphere and negative for the Western Hemisphere, andtzis the local time zone.
The solar zenith anglehcan be obtained from
sinh=sinϕsinδ+cosϕcosω, (4)
ω=15◦·(H−12), (5)
δ=23.45·sin 360×284+n 365
!
, (6)
whereϕis the local latitude,δis the declination angle, and ωis the solar time angle, which are all in units of degrees.
The solar incidence angleican be obtained from cosi=cosθsinh+sinθcoshcos(α−γ), (7) whereθis the slope inclination angle,αis the solar azimuth angle, andγis the slope azimuth angle, which are all in units of degrees.
The total solar radiation intensityIθon the inclined sur- face can be obtained by
Iθ=IDθ+Idθ+IRθ, (8) Iθ=IDN
·
cosi+cos2 θ
2 ·cosh+ρ(sinh+C)·sin2 θ 2
, (9) where IDθ is the direct solar radiation intensity on the in- clined surface, Idθis the Sun’s scattered radiation intensity on the inclined surface, andIRθis the ground-reflected radi- ation intensity obtained on the inclined surface.
The solar radiation intensity actually applied to the unit photovoltaic-power-generation module during the naviga- tion,It, is calculated by
It(t)=
t
X
i=1
Iθ(i). (10)
Therefore, the power ppv(t) generated by a solar panel per unit time can be obtained from
ppv(t)=It(t)×A×jpv, (11) whereArepresents the area of the solar panel (in m2) and jpvrepresents the electric energy conversion rate of the solar panel.
The total power Ppv(t) generated by the photovoltaic- power-generation module of the system at timetcan be ob- tained by
Ppv(t)=Npv×ppv(t), (12) whereNpvis the total number of solar panels in the system, given by
0≤Npv≤Nmax pv, (13)
whereNmax pvrepresents the maximum value ofNpv. 2.2 Wind-Power-Generation Module
For the wind-power-generation module[9], the powerpwt(t) generated by the turbines per unit time can be obtained by
pwt(t)=
0 vt≤vmin or vt≥vmax Prwt
vt−vmin vr−vmin
vmin< vt< vr Prwt vr≤vt< vmax
,
(14) wherevt is the wind speed at time t, vr is the rated wind speed of the wind turbines, andPrwt is the corresponding rated power of the wind turbines. When the actual wind speed is greater than the starting wind speedvmin, the tur- bines start to operate. When the wind speed is greater than the warning wind speedvmax, the turbines stop, to protect the turbines.
The total power Pwt(t) generated by the wind-power- generation module of the system at timetcan then be ob- tained by
Pwt(t)=Nwt×pwt(t), (15) whereNwtis the total number of wind turbines in the system and its value range is given by
0≤Nwt ≤Nmax wt, (16)
whereNmax wtis the maximum value ofNwt. 2.3 Battery Energy-Storage Module
Owing to the intermittent nature of new energy sources, such as solar and wind energy, and because electric loads fluctuate and change abruptly, hybrid energy systems should have sufficient stored energy in addition to meeting the load energy requirements at any time. In[20], the impact of dif- ferent battery types on hybrid systems was proposed. The calculation method of battery energy storage is as follows.
In a battery energy-storage module, the maximum elec- tric quantity emax batt and the minimum electric quantity emin battthat can be stored in a battery can be obtained from
emin batt =(1−DoD)×emax batt, (17) where DoD is the maximum depth of discharge of the bat- tery.
Usually, a battery is shipped with its rated maximum capacity. In this case, the maximum electric quantity Emax batt and the minimum electric quantityEmin batt stored in all the batteries can be obtained from
Emax batt=Nbatt×emax batt, (18) Emin batt =Nbatt×emin batt, (19) whereNbattis the total number of battery packs in the sys- tem, with its range of values given by
0≤Nbatt≤Nmax batt, (20)
whereNmax battis the maximum value ofNbatt.
At timet, if the sum of the electric energy generated by the photovoltaic-power-generation module and the wind- power-generation module is higher than the load demand,
the batteries are charged, and the battery powerEbatt(t) can be obtained by
Ebatt(t) = Ebatt(t−1)
+ Ppv(t)×∆t+Pwt(t)×∆t−El(t) jinv
!
×jbatt. (21) If the sum of the electric energy generated by the photovoltaic-power-generation module and wind-power- generation module is less than the load demand, the batter- ies are discharged, and the total power of the batteries can be obtained by
Ebatt(t) = Ebatt(t−1)
− El(t) jinv
−Ppv(t)×∆t−Pwt(t)×∆t
!
×jbatt. (22) In Eqs. (21) and (22), Ebatt(t) is the sum of the stored energy of the batteries at time t, El(t) is the demand for the electric energy of the load, jinvand jbattare the inverter conversion rate and battery charging efficiency, respectively, and∆tis the change in time.
The total battery capacity should always be between Emax batt andEmin batt. If a battery is fully charged, it cannot be recharged. Conversely, if the battery is not charged, its charge will not drop to 0 but will drop toEmin battat a mini- mum. The powerPbatt(t) that the battery can provide at time tcan be obtained by
Pbatt(t)= Ebatt(t)−Emin batt
∆t . (23)
2.4 Diesel Power-Supply Module
In the diesel power-supply module[9], if at timetthe total energies provided by the above three modules are less than the load demand, the output powerPd(t) of the diesel engine can be obtained by Eq. (24); otherwise, there is no need for the load to be powered by the diesel engine, orPd(t) is equal to zero:
Pd(t)=El(t)
∆t −Ppv(t)−Pwt(t)−Pbatt(t). (24) The fuel consumption amountFD(t) (in units of l/h) of the diesel engine can be obtained from
FD(t)=BD×PN+AD×Pd(t), (25) where PN is the rated output power of the diesel engine, AD=0.246 (l/kW·h), andBD=0.0845 (l/kW·h). According to the fuel unit pricePF, the fuel consumption costCf d(t) of the diesel engine at timetcan be obtained from
Cf d(t)=PF×FD(t). (26) 2.5 Objective Function
First, there are three parameters to be considered for the cost
savings: annual input costCc, annual maintenance costCm, and annual fuel consumption costCf.
The annual input costCccan be obtained from Cc = i(1+i)npv
(1+i)npv−1CpvNpv+ i(1+i)nwt
(1+i)nwt−1CwtNwt + i(1+i)nbatt
(1+i)nbatt−1CbattNbatt+ i(1+1)nd
(1+i)nd−1Cd, (27) wherei is the equipment depreciation rate; npv,nwt, nbatt, andnd are the service lives andCpv,Cwt,Cbatt, andCd are the initial input costs of the solar panels, wind turbines, bat- teries, and diesel engine, respectively.
The annual maintenance costCmcan be obtained from Cm=Npv×Cmtn pv+Nwt×Cwtn wt+Cmtnd, (28) whereCmtn pv,Cmtn wtare the annual maintenance cost per unit of the solar panels and wind turbines, respectively.
These costs are determined by the type of solar panels and wind turbines and the environment in which they operate.
The diesel engine annual maintenance costCmtnd can be obtained from
Cmtnd=
Ndata
X
t=1
Pmtnd×Pd(t). (29) whereNdata is the number of samples, Ndata = 8760, and Pmtndis the maintenance cost of the diesel engine.
The annual fuel consumption costCf of the diesel en- gine can be obtained from
Cf =
Ndata
X
t=1
Cf d(t). (30)
Based on the above analysis, the total costCT of the ship’s hybrid energy system can be obtained from
CT =Cc+Cm+Cf. (31)
Second, to extend the operational hours of the system, the concept of availability is introduced, which is the key ob- jective to determine whether the system is able to continue to operate stably [3]. The availability T can be obtained from
T =1− DNM PNdata
t=1 El(t), (32)
where DNM represents an unmet demand, which can be ex- pressed by
DN M=
Ndata
X
t=1
emin batt−Ebatt(t)
−
Ppv(t)×∆t+Pwt(t)×∆t−El(t)
×u(t)
! . (33) whereu(t) is a step function. When the total power gen- erated by the photovoltaic-power-generation module and wind-power-generation module is greater than or equal to
Fig. 3 Ship hybrid energy system workflow.
the load demand,u(t)=1; otherwise,u(t)=0.
If the objective is only to maximize the cost savings, the service life of the equipment may not be long. Con- versely, if the objective is only to maximize the service life, the cost can be high. Neither system is likely to be useful in actual applications. Therefore, it is crucial to choose a system that has a low cost and long service life. Therefore, the values of the variablesNpv,Nwt, andNbattare determined when the objective functionCTreaches the minimum value andT reaches the maximum value. The operating process of the hybrid energy system is shown in Fig. 3.
3. Overview of IABC Algorithm and Optimization Based on It
The optimization of the hybrid energy system configuration of marine diesel engines with the objectives of Eqs. (30) and (31) is a multi-dimensional hyperplane optimization prob- lem. Many studies have shown that the swarm intelligence optimization algorithm exhibited good optimization perfor- mance in similar problems [11]–[13]. The artificial bee colony (ABC) algorithm is a new type of intelligent opti- mization algorithm proposed recently. It imitates the mech- anism of bees eating nectar to obtain the global optimal so- lution of an optimization problem. It has the advantage of not falling into local optima[14],[15]. The particle swarm optimization (PSO) algorithm converges rapidly for the first half of the iteration [4],[5]. Using the PSO algorithm to improve the ABC algorithm allows the improved algorithm to converge more quickly in the early stages of the iteration.
Thus, the IABC algorithm was used to optimize the configu- ration objective function of the marine diesel hybrid energy system.
3.1 IABC Algorithm
According to the principle of bee foraging, the process of the IABC algorithm applied to optimizing the solution is divided into four stages: the initialization phase, employee bee (EB) optimization phase, onlooker bee (OB) optimiza-
Fig. 4 Flowchart of the implementation of the improved artificial bee colony algorithm.
tion phase, and scout bee (SB) optimization phase. The flow of the IABC is shown in Fig. 4.
In the initialization phase, the program must randomly generate the initial values of the NP solutions to be opti- mized.NPrepresents the size of the population. The greater NP is, the more food sources can be found. The number
of food sources is the number of solutions to be optimized, x(l,d). The value ofx(l,d) can be obtained from
x(l,d)=xmin(d)+rand×(xmax(d)−xmin(d)), (34) wherexmax(d) andxmin(d) are their maximum and minimum values, respectively, rand represents a random number be- tween 0 and 1, d is the dimension, and l is the sequence number of the solution to be optimized.
In the EB and OB optimization phases, the update so- lutionz(l,d) can be obtained from
z(l,d)=x(l,d)+yld×(x(l,d)−x(r,d)), (35) whereyld represents a random number between−1 and 1, andris a random integer between 1 andNPand is not equal tol. Becausex(l,d) has maximum and minimum values, the calculatedz(l,d) may be outside the range ofx(l,d). In this case, this new solution must be discarded and another new solution as a substitute is obtained from Eq. (34).
The OB optimization phase comprises the evaluation of the optimal solution obtained from the EB optimization phase. The food source is selected by a probability corre- sponding to the amount of nectar using the greedy principle.
This method does not always select the best data, but bet- ter data are more likely to be selected. This can prevent the value of the objective function from falling into a local op- timum, allowing a global optimal solution to be obtained.
The probability plused in the OB optimization phase is cal- culated as follows:
pl= F(l)
NP
X
l=1
F(l)
, (36)
whereF(l) is the value of the objective function correspond- ing to the optimal solution.
Since the original ABC algorithm is slow in the early stages of the iteration, the self-defined variable eis intro- duced to determine if optimization acceleration is required.
Ifeis less than the optimal solution at this time, the algo- rithm is in the middle and early stages of the iteration, and acceleration optimization is required. The update solution z0(l,d) can be obtained from
v0(l,d,t+1)=ω·v0(l,d,t)
+η1·rand×(pi(l,d)−z(l,d,t)) +η2·rand×
pg(d)−z(l,d,t) , z0(l,d,t+1)=z(l,d,t)+v0(l,d,t+1), (37) whereωrepresents an inertia weight,η1andη2are acceler- ation constants,v0is the particle velocity, pi is the optimal solution found by the particle itself, and pg is the optimal solution. In this case, a single bee in the swarm is used as a particle, and the update method uses the optimization itera- tion formula of the particle swarm.
Ifeis greater than the optimal solution at this time, the algorithm is in the middle and late stages of the iteration,
Fig. 5 The optimization method of IABC algorithms in OB optimization phase.
and there is no need to speed up the optimization.
The optimization method of the IABC algorithm is shown in Fig. 5. The solid line indicates the completion of one iteration, the dashed line indicates the completion of multiple iterations, and the arrows indicate the iterated so- lutions. The solid circles indicate the optimized solutions found by the ABC algorithm, the solid squares indicate the optimized solutions found by the PSO algorithm, and the hollow circle indicate the optimal solution. The black part of the figure shows the update path of the ABC algorithm and the blue part shows the accelerated update path of the IABC algorithm. The number of iterations for the to-be- optimized solutionx1to reach point A changes from 3 to 2 after acceleration through the iterative formula of the PSO algorithm. The optimizing solutionx2arrives at point B af- ter 2 iterations, and its distance from the optimal solution is less than point C. The red part is the solution that is dis- carded after the optimization search.
In the SB optimization phase, if the previously obtained optimal solution has not been updated for a long time, when the number of un-updated times kcount is greater than the threshold klimit, the bees have not found a better solution for a long time. Eq. (34) is then used to randomly obtain a new solution to compare with the previous optimal value.
If the new solution is better, it replaces the current optimal solution.
3.2 Optimization of Hybrid Diesel Energy System Config- uration Based on IABC Algorithm
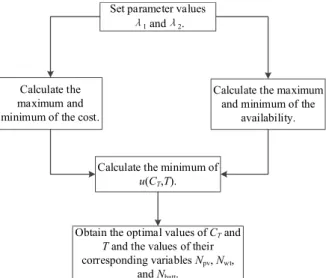
Because there are two objectives to be optimized and they also affect each other, the functionu(CT,T) describing the performance of the system can be obtained from the fol- lowing equation, which takes both objective variables into account:
u(CT,T) = λ1
CT−Min(CT) Max(CT)−Min(CT)
−λ2
T −Max(T)
Max(T)−Min(T), (38)
whereλ1 andλ2 are self-defined parameters that can indi-
Fig. 6 Dual objective optimization process.
cate the importance ofCT andT in the system. In this pa- perλ1 =λ2, which means that the cost and availability are equally important. MatLab (MathWorks, USA) was used to obtain the final optimal result and the minimum value of u(CT,T). At this point, CT in Eq. (31) is closer to its minimum andT in Eq. (32) is closer to its maximum. The optimization process is shown in Fig. 6.
4. Performance of the Proposed Method
To verify the effectiveness and validity of the hybrid energy optimal configuration, the ship navigation test was carried out with a route from Dalian, China to Aden, Yemen. Due to the limitations of the experimental conditions, we were un- able to retrofit the ship and conduct a case test. So, this ex- periment is based on simulation. The ship’s single round trip time was approximately 38 d, a total of 912 h. The ship had a total length of 332.95 m, a profile width of 60.00 m, a depth of 30.50 m. The areas of the solar panels were 10,000 m2, the number of fans was 300, and the battery pack is 4000 sets. Owing to the geographical location of the ship dur- ing the journey, the amount of solar radiation also changed.
Through Eqs. (1)–(10), the amount of solar radiation (It) the ship received in a single round-trip simulation is shown in Fig. 7.
In the wind-power-generation module, the data of the wind speedvtper hour is shown in Fig. 8. Owing to the ran- domness of the wind, the data were obtained by simulating the average climates of the areas on the navigation route.
Five different operating modes of the ship-navigation experiments are described in this section, and the corre- sponding load power is given in Table 1. When the ship was navigating in ordinary seas, it was in full-speed mode. When the ship was navigating in the Straits of Malacca, it was in cruising mode. The ship was docked in Dalian, Shanghai, Hong Kong, Singapore, Sri Lanka, and Aden for transac- tions and maintenance. The time spent docked is given in Table 2. Therefore, in a single round-trip simulation, the
Fig. 7 Solar radiation during navigation.
Fig. 8 Wind speed during navigation.
Table 1 Load power of five different navigation modes.
Table 2 Operating hours in six different ports.
data for the hourly electric loads are shown in Fig. 9.
The simulation calculation was performed on different modules of the hybrid energy system, and the specific pa- rameters required for the calculation are given in Table 3.
To study the influence of different kinds of batteries on the system, lead-acid (LA) batteries, lithium-ion (Li-ion) bat-
Fig. 9 Load during navigation.
Table 3 Numerical value of different modules parameters.
Table 4 Numerical value of battery energy-storage modules parameters.
teries, and nickel-cadmium (Ni-Cd) batteries were tested as the battery energy-storage modules of the system. The spe- cific parameters have been described previously[20]and are given in Table 4.
To verify the optimization performance of the proposed method, we also optimized the configuration and simulation of the hybrid energy system using the IABC algorithm intro- duced in Sect. 2.1, the original ABC algorithm[9], the PSO algorithm[5], and the DE algorithm[7]. The optimization curves are shown in Fig. 10.
Fig. 10 Optimization process of different algorithms in each system: (a) LA batteries, (b) Li-ion batteries, (c) Ni-Cd batteries.
The worst optimization value (Worst), the best opti- mization value (Best), the median value (Median), the mean value (Mean), and the standard deviation (Std.) of the 30 re- peated tests are shown in Table 5. These parameters can be used to quantitatively analyze the optimization effects of the different algorithms. The median reflects the quality of the optimal solution, the average reflects the convergence speed of the optimization algorithm, and the standard deviation re-
Table 5 Comparison of test results by four different optimization algo- rithms.
flects the quality of the optimal solution.
The self-defined variablee=3×10⁻³is the average of the intersection of the iterative curves of the PSO algorithm and the ABC algorithm over 30 repeated trials.
The comparison of the results in Fig. 10 and Table 5 show that the IABC algorithm exhibited better optimization effects in terms of the quality of the solution, the conver- gence speed, the stability, and the robustness of the algo- rithm compared with the other three algorithms.
Table 6 shows the time complexity comparison of the four optimization algorithms. The time consumed by a sin- gle iteration of the 50 iterations in 30 repeated experiments was calculated. It can be seen that the PSO algorithm is the fastest and the IABC algorithm is the slowest. Although IABC increases the time complexity, compared with the PSO algorithm, it can largely avoid the situation of falling into a local optimal.
Compared with ABC algorithm, IABC algorithm in- creases the calculation time by 28%, which not only greatly improves the optimization speed of the algorithm in the early stage, but also increases the probability of finding the global optimal solution.
This indicates that the optimization idea proposed in this paper was feasible, which not only accelerated the con- vergence speed of the original ABC algorithm but also re- tained its characteristic of avoiding local optima. Thus, it exhibited better performance for this problem.
The dual-objective optimized configuration of the hy- brid system detailed in Sect. 2.2 was compared with two previously reported objective function optimization systems
Table 6 Time complexity of different algorithms.
Table 7 Optimal configuration of different optimization targets in differ- ent systems.
[1],[3]. The results are shown in Table 7. The hybrid sys- tem optimized in this paper exhibited a significant advan- tage. When the lowest cost was reached, the availability of the system became very low; conversely, when the highest availability was reached, the cost became very high. How- ever, the optimization results of the dual-objective system configuration showed that the system availability could be greatly improved by adding a certain amount of cost to the lowest cost.
In addition, three different types of batteries were used as energy storage systems to optimally configure the ship.
The actual energy storage of the battery throughout the voy- age is shown in Fig. 11, the power output from the diesel engine is shown in Fig. 12, and the configuration parame- ters for systems loaded with different batteries are given in Table 8.
According to the data in Table 4, it is known that the energy storage capacity of a single Ni-Cd battery is stronger than that of the other two batteries. So, in Fig. 11(c), the bat- tery capacity is at its lowest for some time. However, if the total number of batteries needs to be reduced for some rea- son, and the number of solar panels and fans is not changed, it may happen that the system is still generating electricity power when the battery is full. At this time, the excess en- ergy can be used in non-propulsion systems such as cabin lighting and monitoring. For propulsion systems, this part of the power is “wasted.”
As shown in Fig. 11, Fig. 12, and Table 8, the cost of
Fig. 11 Battery capacity at different sailing times: (a) LA batteries, (b) Li-ion batteries, (c) Ni-Cd batteries.
the Li-ion battery was much higher than that of the LA bat- tery. In the optimal configuration, although the availability of the Li-ion battery system was slightly higher, the total cost was 35% greater than that of the system with the LA battery. If the costs of Li-ion batteries decline in the future, systems with Li-ion batteries will be competitive. For the Ni-Cd battery system, the ship’s diesel engine consumed more power than the other two systems, consuming more
Fig. 12 Output power of the diesel engine at different sailing times: (a) LA batteries, (b) Li-ion batteries, (c) Ni-Cd batteries.
fuel and releasing more harmful gases, which is not con- ducive to the protection of marine environments.
Since the Ni-Cd battery has a memory effect, it is not suitable for a system that requires frequent charging and dis- charging of the battery compared to the other two types of
Table 8 Optimal configuration of systems with different batteries.
batteries. It will be very competitive on ships that work only during the day, such as ships with short working routes and passenger ships that transport tourists. Therefore, in this ex- periment, the system equipped with the LA battery exhibited better performance.
This paper is based on the analysis of simulation ex- periments. In the actual situation, due to the uncertainty of weather conditions, such as calm wind in sunny days and high wind in cloudy days, the electricity provided by photovoltaic-power-generation module and wind-power- generation module fluctuates greatly. For ships with fixed routes, it is necessary to optimize the configuration based on the weather data of ship routes in recent years. For ships with non-fixed routes, the weather data of different sea areas should be statistically calculated in proportion according to the voyage frequency of different ship routes, and then op- timized for configuration. Therefore, the final optimization result is more applicable to individuals.
In addition, solar energy and wind energy are used in this paper. Nevertheless, future research needs to combine more new energy sources to be promoted, such as nuclear energy and hydrogen energy, so as to further reduce the harmful gas emissions of the ship hybrid energy system.
Moreover, the ship’s power system itself will have some im- pact. Therefore, in the following research, the focus is on the impact of distributed power on other parameters related to grid quality, such as low frequency oscillations and tran- sients.
5. Conclusion
A dual-objective optimization method was proposed for the configuration problem of marine hybrid energy systems.
First, the solar-radiation parameters were adjusted accord- ing to the latitude and longitude of the ship and the changes of the environment. The objective function of the optimal configuration was constructed considering the cost and ser- vice life. Second, the IABC algorithm was used to the per- form optimization. A ship-navigation experiment was car- ried out in five operation modes: full speed, constant-speed cruising, port entry and exit, loading and unloading, and an- choring and mooring. Finally, three different systems con- sisting of LA batteries, Li-ion batteries, and Ni-Cd batter- ies were compared. The experimental results show that the proposed method exhibited good performance characteris- tics for the configuration optimization.
Acknowledgments
This work was supported in part by the National Natural Science Foundation of China under Grant No.51879118, in part by the Foundation of Fujian Science and Technol- ogy Supporting Army Project under Grant No.B19101, in part by the Natural Science Foundation of Fujian Prov- ince No.2019J01060381 and No.2020J01688, in part by the Transportation Industry High-Level Technical Talent Train- ing Project No.2019-014, in part by the Scientific Research Foundation of Key Laboratory of Fishery Equipment and Engineering, Ministry of Agriculture of the People’s Repub- lic of China under Grant No.2016002 and No.2018001, in part by the Scientific Research Foundation of Artificial In- telligence Key Laboratory of Sichuan Province under Grant No.2017RYJ02, and in party by the Scientific Research Foundation of Jiangsu Key Laboratory of Power Transmis- sion & Distribution Equipment Technology under Grant No.
2017JSSPD01.
References
[1] J.B. Fulzele and M.B. Daigavane, “Design and optimization of hy- brid PV-wind renewable energy system,” Materials Today: Proceed- ings, vol.5, no.1, pp.810–818, July 2018.
[2] D. Magnor and D.U. Sauer, “Optimization of PV battery systems us- ing genetic algorithms,” Energy Procedia, vol.99, pp.332–340, Nov.
2016.
[3] M.B. Shadmand and R.S. Balog, “Multi-objective optimization and design of photovoltaic-wind hybrid system for community smart DC microgrid,” IEEE Trans. Smart Grid, vol.5, no.5, pp.2635–2643, Aug. 2014.
[4] A.L. de Ocampo and E.P. Dadios, “Energy cost optimization in irri- gation system of smart farm by using genetic algorithm,” HNICEM 2017, pp.1–7, Jan. 2017.
[5] C.D. Rodr´ıguez-Gallegos, “A siting and sizing optimization ap- proach for PV–battery–diesel hybrid system,” IEEE Trans. Ind.
Appl., vol.54, no.3, pp.2637–3645, Dec. 2018.
[6] S.B. Jeyaprabha and A.I. Selvakumar, “Optimal sizing of photo- voltaic/battery/diesel based hybrid system and optimal tilting of so- lar array using the artificial intelligence for remote houses in India,”
Energ. Buildings, vol.96, no.11, pp.40–52, June 2015.
[7] M. Viswavandya, A. Mohanty, and P.K. Ray, “Restoration of sta- ble voltage in an isolated hybrid solar power system with combined JAYA-DE algorithm,” Optik, vol.180, no.2, pp.536–548, Feb. 2019.
[8] B. Das and A. Kumar, “Cost optimization of a hybrid energy stor- age system using GAMS,” ICPEDC 2017, Chennai, pp.1–5, March 2017.
[9] R.J. Wang, Application of Artificial Bee Colony Algorithm, pp.187–
193, Publishing House of Electronics Industry, Beijing, 2016.
[10] S. Yoshida, S. Ueno, and N. Kataoka, “Estimation of global tilted irradiance and output energy using meteorological data and perfor- mance of photovoltaic modules,” Solar Energy, vol.93, no.7, pp.90–
99, July 2013.
[11] R.J. Wang, Y.J. Zhan, and H.F. Zhou, “A class of sequential blind source separation method in order using swarm optimization algo- rithm,” Circuits Syst. Signal Process., vol.35, no.9, pp.3320–3243, Sept. 2016.
[12] R.J. Wang, Y.J. Zhan, and H.F. Zhou, “Application of artificial bee colony in model parameters identification of solar cell,” Energies, vol.8, no.8, pp.7563–7581, July 2015.
[13] R.J. Wang, Y.J. Zhan, and H.F. Zhou, “PID based on artificial
bee colony algorithm controlled AVR system,” International Jour- nal of Innovative Computing, Information and Control, vol.11, no.6, pp.2051–2061, Jan. 2015.
[14] D. Karaboga and B. Akay, “A comparative study of artificial bee colony algorithm,” Appl. Math. Comput., vol.214, no.1, pp.108–
132, Aug. 2009.
[15] C.B. Jagdish, A. Gopala, and K. Nagar, “Stability analysis of arti- ficial bee colony optimization algorithm,” Swarm and Evolutionary Computation, vol.41, no.8, pp.9–19, Jan. 2018.
[16] J. Zhou, S. Kim, and H. Zhang, “Consensus-based distributed con- trol for accurate reactive, harmonic, and imbalance power sharing in microgrids,” IEEE Trans. Smart Grid, vol.9, no.4, pp.2453–2467, Sept. 2018.
[17] X. Liu, Z. Yan, and J. Wu, “Optimal coordinated operation of a multi-energy community considering interactions between energy storage and conversion devices,” Appl. Energ., vol.248, pp.256–273, Aug. 2019.
[18] Q. Sun, B. Huang, and D. Ma, “Optimal placement of energy stor- age devices in microgrids via structure preserving energy function,”
IEEE Trans. Ind. Informat., vol.12, no.3, pp.1166–1179, April 2016.
[19] R. Wang, Q. Sun, and D. Ma, “The small-signal stability analysis of the droop-controlled converter in electromagnetic timescale,” IEEE Trans. Sustain. Energy, vol.10, no.3, pp.1459–1469, Jan. 2019.
[20] A. Kaabeche and Y. Bakelli, “Renewable hybrid system size opti- mization considering various electrochemical energy storage tech- nologies,” Energ. Convers. Manage., vol.193, pp.162–175, Aug.
2019.
[21] J.A. Duffie and W.A. Beckman, Solar Engineering of Thermal Pro- cesses, 4th Ed., pp.3–42, John Wiley & Sons, New York, 2013.
Guangmiao Zeng received the B.S. degrees in Marine Electronic and Electrical Engineering from Jimei University, China, in 2018. He is currently pursuing his Ph.D. in Naval and Ocean Engineering from Jimei University. His research interests include fault diagnosis of power elec- tronics circuit and intelligent information pro- cessing.
Rongjie Wang received the Ph.D. degree in Electrical & Electronic Engineering from Sun Yat-sen University, China, in 2012. He is now a professor and supervisor of Ph.D. student with the Marine Engineering Institute, Jimei Univer- sity, China. His research interests include sys- tem identification, fault diagnosis of power elec- tronics circuit and blind source separation.
Ran Han received the B.S. degrees in Elec- trical Engineering and Automation from Shang- hai Ocean University, China, in 2018. He is cur- rently pursuing his M.S. in Naval and Ocean En- gineering from Jimei University. His research interests include fault diagnosis of power elec- tronics circuit and intelligent information pro- cessing.