Development of boron-doped diamond heater in the Kawai-type multi-anvil apparatus and its application to determine silicate melt viscosity at conditions of deep
magma ocean
2018, August
Longjian Xie
谢龙剑Graduate School of Natural Science and Technology (Doctor’s course)
OKAYAMA UNIVERSITY
Contents
Summary ... 1
Part 1. Boron-doped diamond heater in Kawai-type multi-anvil apparatus ... 2
1.1 Abstract ... 3
1.2 Introduction ... 3
1.3 Experimental procedure ... 6
1.4 Results and discussion ... 8
1.5 Conclusions and perspectives ... 14
References in Part I ... 16
Table ... 20
Figures ... 22
Part 2. Viscosity measurement of silicate melts up to ~30 GPa ... 38
2.1 Abstract ... 39
2.2 Introduction ... 40
2.3 Experimental procedure ... 44
2.4 Results and discussions ... 47
2.5 Conclusions ... 53
References in Part II ... 54
Tables ... 59
3.4 Results and discussions ... 86
3.5 Conclusions ... 90
References in Part III ... 91
Tables ... 98
Figures ... 103
Appendix 1. Liquidus of related mantle materials ... 108
Acknowledgements ... 109
Summary
In this PhD thesis, I summarize my achievements in the recent three years after the interim evaluation September 2015. It consists of three parts: (1) boron-doped diamond (BDD) heater developed in the multi-anvil apparatus, (2) viscosity measurement of silicate melts up to ~30 GPa using in-situ falling sphere method, and (3) implications for the evolution of the magma ocean based on the silicate melt viscosity newly measured in the present study.
Breakthroughs both in experimental techniques and in geoscientific modelling for the early Earth are achieved in this study. Highlights of my study are (1) generation of ~4000 K temperature (world highest) in the Kawai multi-anvil apparatus by using BDD heater, (2) world first measurements of silicate melt viscosity under the lower mantle condition by applying BDD heater in the in-situ falling sphere viscometry; the viscosity data experimentally reproducing all the four pressure induced densification mechanisms predicted in molecular dynamic simulation, and (3) the estimated viscosity of magma ocean suggests a fractional solidification of magma ocean.
Combined with our fractional solidification model and geochemical data of primary upper mantle, we estimated the depth of fractionated magma ocean is ~880 km and the thickness of cumulate layer in the lower mantle is ~220 km. After fully
Part 1. Boron-doped diamond heater in the
Kawai-type multi-anvil apparatus
1.1 Abstract
Methods to use synthesized boron-doped diamond (BDD) as a heater were developed in a multi-anvil high-pressure apparatus. The synthesized BDD heater could stably generate an ultra-high temperature without the issues (anomalous melt, pressure drop and instability of heating) arising from oxidation of boron into boron oxide and graphite-diamond conversion. BDD blocks and tubes with boron contents of 0.5–3.0 wt.% from a mixture of graphite and amorphous boron, were synthesized at 15 GPa and 2000 °C. The electrical conductivity of BDD increased with increasing boron content.
The stability of the heater and heating reproducibility were confirmed through repeated cycles of heating and cooling. Temperatures as high as ~3700 °C were successfully generated at higher than 10 GPa using the BDD heater. The effect of the BDD heater on the pressure-generation efficiency was evaluated using MgO pressure scale by in situ X-ray diffraction study at the SPring-8 synchrotron. The pressure-generation efficiency was lower than that using a graphite-boron composite heater up to 1500 tons.
The achievement of stable temperature generation above 3000 °C enables melting experiments of silicates and determination of some physical properties (such as viscosity) of silicate melts under the Earth’s lower mantle conditions.
1.2 Introduction
measurement such as diffusion, also requires a large volume (larger than several hundred micrometers) with a stable and homogeneous temperature field. Development or improvement of apparatus for stable, homogeneous high-pressure and high- temperature in a large volume is important.
There are only two kinds of high pressure apparatus can generate pressure over 20 GPa and temperature over 2000 °C, that is, laser heated diamond anvil cell (LH-DAC)
eg. 4-7 and multi-anvil apparatus (MAA) eg.1,8 . However, LH-DAC can only generate high pressure at a small sample volume, with a steep T-gradient, large T-fluctuation and uncontrolled chemical environment. The MAA is the only apparatus, which can produce quasi-hydrostatic pressures over 20 GPa in a large volume eg.1,8 with a stable and homogeneous temperature field. Technological advancement to extend the limits of pressure and temperature generation in MAA is thus, an important issue in high- pressure materials and earth science.
Recently, pressures over 100 GPa in MAA were succeeded to generate by employing sintered diamond anvils9. However, the temperature generation over 3000 °C in MAA is still difficult by using traditional heating material (such as TiB2, rhenium, LaCrO3). Since temperatures higher than 3000 °C are needed for melting experiments on mantle materials under lower-mantle conditions eg. 4-7, a refractory heating material is essential to melt materials in the deep Earth such as bridgmanite and ferropericlase.
Moreover, in-situ X-ray observation using synchrotron radiation has become a powerful tool for high pressure research. The combination of synchrotron radiation with MAA not only enables researcher to directly observe the sample under high pressure and high temperature but also measure the structure and properties of materials under high pressure and high temperature 1, 3 . The traditional heater material such Re and
LaCrO3, are not X-ray transparent.
Thus, developing a heater material, which is both refractory to melt the lower mantle and X-ray transparent, are important for Earth science. Boron-doped diamond (BDD) is the best candidate to satisfy both requirements with its high melting point and low X-ray absorption properties3,10-12. In previous works, BDD has been synthesized from a graphite–boron composite (GBC) in situ during heating to avoid directly manufacturing the hardest material, diamond. I also systematically studied this GBC heater, which has been documented in my intern evaluation thesis and published in high pressure research journal12. From the previous researches and my research, several problems of GBC are documented. The graphite–diamond conversion is accompanied by a large volume reduction and drastic change of electrical resistivity leading to a significant pressure drop and unstable heating, respectively. Furthermore, the boron in the graphite–boron mixture is easily oxidized into boron oxide, B2O3, which acts as a fatal melting flux12. Thus, the direct use of BDD is strongly preferable for stable ultra- high temperature generation.
There are two possible routes to overcome the difficulty of manufacturing BDD tube heaters: direct synthesis of a BDD tube or molding of a BDD tube from BDD powders. BDD is usually synthesized via chemical vapor deposition (CVD) or the HPHT method. The CVD method is usually applied to synthesize BDD films (<1 m thickness) e.g., 13-15. In the HPHT method, however, BDD of millimeter size can be
temperature generation. The X-ray transparency and pressure generation of a Kawai cell assembly using the BDD heater were also evaluated using in situ X-ray observation with synchrotron radiation at SPring-8.
1.3 Experimental procedure
1.3.1 Synthesis of BDD tubes and blocks
BDD tubes and blocks were synthesized at ~15 GPa and ~2000 °C for 10-30 minutes in Kawai-type multi-anvil apparatuses (USSA-1000 and USSA-5000) using cubic tungsten carbide (WC) blocks as second anvil with 8-mm truncation edge length.
Figure 1.1 shows some examples of cell assembly. A Cr-doped MgO octahedron (OMCR, Mino Ceramic Co., LTD) with a 14-mm edge length was used as the pressure medium, and zirconia (OZ8C, Mino Ceramic Co., LTD) was used as a thermal insulator.
Rhenium/LaCrO3 was used as a heater. The starting material was a mixture of graphite and amorphous boron enclosed in a MgO capsule. The graphite had a purity of 99.999%
with a grain size of < 1 μm. The amorphous boron with a grain size of 0.8–1.4 μm contained major impurities of H3BO3 < 0.75 wt.%, H2O < 0.5 wt.%, and Mg < 1.0 wt.%.
We prepared powder mixtures with various boron content (0.5, 1.0, 2.0, or 3.0 wt%).
For synthesis of the BDD tube, an MgO rod was placed at the center of the mixture.
For the BDD synthesis runs, temperature was estimated from the power–
temperature relationship for each assembly to avoid reaction and obtain a larger amount of BDD. The temperatures in the calibration runs were measured using a W97Re3‒ W75Re25 thermocouple without corrections for the pressure effect on emf. The thermocouple was insulated from the rhenium heater by an alumina tube, and the junction was shifted to 2 mm away from the center position of heater.
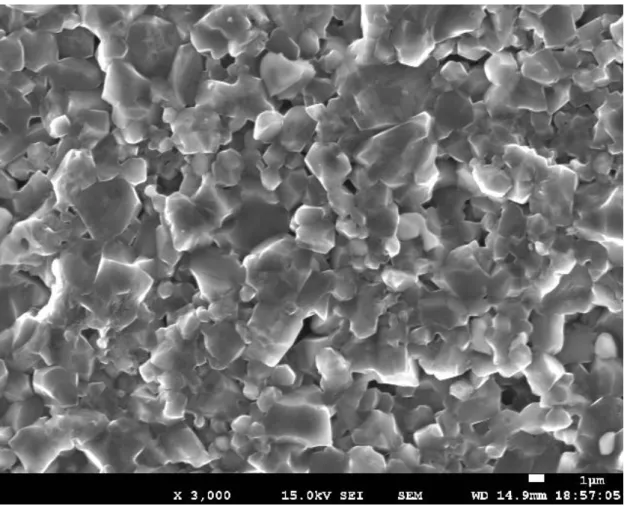
the temperature was increased to ~2000 °C and maintained for 10–30 min. Next, the load was reduced to 204 tons at 1000 °C in more than 5 h and continuously decompressed to 4 tons at 500 °C in more than 5 h to minimize the formation of cracks inside the BDD tubes or blocks. The recovered assembly was rinsed in 10 wt.% HCl solution for ~12 h to remove any MgO around the BDD blocks and tubes. Then, the BDD blocks and tubes were washed with pure water to remove residual HCl and dried at 80 °C in a vacuum oven. The recovered BDD blocks and tubes were checked by an optical microscope and a scanning electron microscope (JSM-7001F, JEOL Co. Jap.) to observe the microstructure. The phases were identified by a micro-focused X-ray diffractometer (RINT RAPID II, RIGAKU Co. Jap.) with 100 μm X-ray beam size.
1.3.2 Heating tests without and with synchrotron X-ray
We tested heating performance of the synthesized BDD heater. The BDD tubes were directly used as heaters, whereas the BDD blocks were first ground into powders using a nano-polycrystalline diamond mortar and then molded into tube shape to be used as heaters. The sintered tube BDD heaters with different boron contents (0.5, 1.0, 2.0, and 3.0 wt.%) and powder BDD heater with that of 3.0 wt.% were examined.
Table 1.1 summarizes runs at 10 or 15 GPa with or without synchrotron X-ray.
Runs without synchrotron X-ray were conducted at Institute for Planetary Materials (IPM), Okayama Univ. to investigate the heating performance of BDD heaters with
length of the edge of the octahedral pressure medium was 14 mm. The temperature was monitored by W97Re3–W75Re25 thermocouple. Detailed cell assemblies were shown in Figure 1.2, 2.3 and 2. 4.
For runs with synchrotron X-ray, a mixture of MgO and diamond (15 wt.%) was used as the pressure marker. The pressure was calculated using the equation of state of MgO19. Amorphous boron was adopted as a thermal insulator and X-ray window. A forsterite/enstatite sample was placed inside the graphite capsule, and two rhenium spheres were placed at the middle and top of the sample to detect melting of forsterite using in situ X-ray imaging. The images were projected on the fluorescence screen and then magnified and detected by a high-speed CCD camera (C9300, Hamamatsu Co.
Jap.). Energy dispersive X-ray diffraction was adopted at a diffraction angle of ~6° in conjunction with a germanium solid-state detector.
The pressure was first increased to 10 or 15 GPa. Then, one or several cycles of heating were conducted for each experiment to confirm the heating performance of the BDD heater. The resistivity of a diamond heater was determined during the heating from the applied voltage and current and its dimensions. The recovered samples were polished by a diamond wheel and checked by an optical microscope and a scanning electron microscope (SEM).
1.4 Results and discussion
1.4.1 BDD blocks and tubes
Figure 1.5 shows the synthesized BDD blocks with diameters of ~2.5 mm and BDD tubes with various dimensions (such as 2.6/1.5/3.35 and 1.5/1.1/3.0 mm for the outer diameter/inner diameter/length, respectively). The BDD blocks and BDD tubes contained some small cracks. The grain sizes of the granular BDD were measured to be
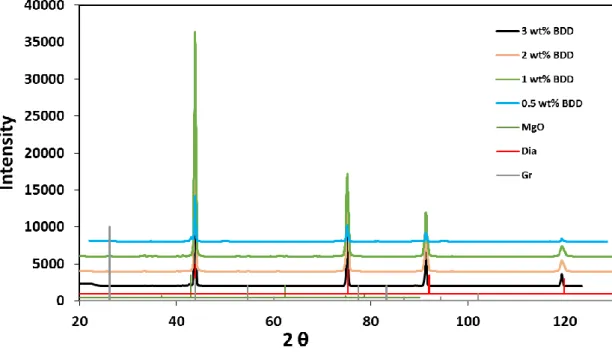
contents show no obvious graphite peaks except for the sample with 0.5 wt% boron (Figure 1.7), which indicates that the graphite may have completely transformed into diamond for the samples with larger boron contents. This observation suggests that boron works both as the dopant and catalyst during the graphite–diamond conversion.
Compared with pure diamond, the peaks of BDD shifted to lower angles, suggesting that the involvement of boron expands the diamond lattice.
1.4.2 Sintered BDD tube heater with different boron contents
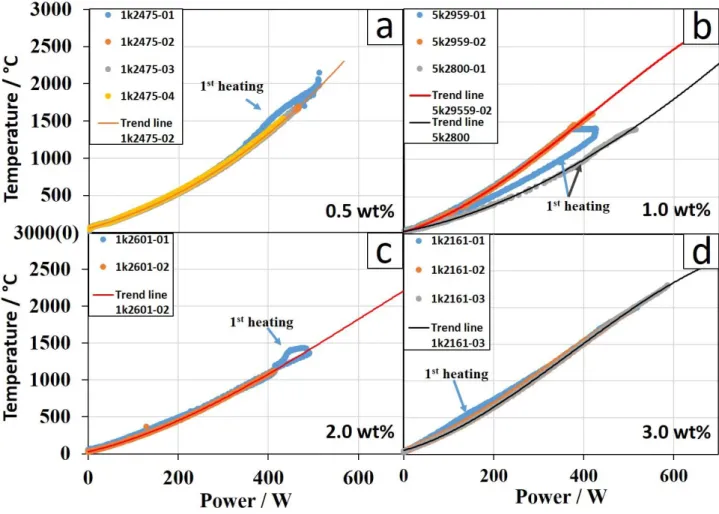
Figure 1.8 displays the power–temperature relationships of the runs for BDD contents of 0.5, 1.0, 2.0 and 3.0 wt.%. First, several heating-cooling cycles were performed at relatively low temperatures (~1500–2000 °C) to prevent failure of the thermocouple. In the last heating, we tried to generate temperature as high as possible.
All the heating cycles showed good reproducibility of the power–temperature relationship except for the first heating cycle. Their relationships can be fitted by a cubic polynomial function. All the BDD heaters with boron contents of 0.5–3.0 wt% were stable during heating.
Figure 1.9 shows the Arrhenius plots of electrical conductivity, which was calculated from the measured total resistance involving heater and electrode during heating by ignoring its dimensional change during compression. No abrupt conductivity changes were observed in all the heating cycles. The conductivities in the first cooling
For the first cooling and successive heating–cooling cycles, the electrical conductivity of BDD increased with increasing boron content. The electrical conductivity also increased with increasing temperature (semiconductive) for BDD with boron contents
< 2.0 wt.%, whereas it showed opposite trend (metallic) for BDD with 3.0 wt.% boron.
For the 5k2959 (1.0 wt.% boron content) experiment, the conductivity in the first heating is higher than that in the first cooling. This is caused by a presence of residual graphite in the BDD tube, which is not well sintered because the heater in the synthesize experiment failed at around 1700 °C. The continuous decrease of conductivity at approximately 1400 °C in the first heating may have been caused by the graphite–
diamond conversion from the residual graphite.
1.4.3 BDD powder heater with 3.0 wt.% boron
Figure 1.10a displays the power–temperature relationship of BDD powder tube heater at 15 GPa. Two heating–cooling cycles were conducted. The temperature was increased to 1300 °C in the first cycle. In the second cycle, the thermocouple was broken at around 1600 °C. We continued to increase the power to ~870 W (~3000 °C based on the power–temperature relationship determined up to 1600 ˚C). A sudden increase of heater resistance occurred at this power. Finally, we increased the power to 1150 W and quenched. The sudden increase of heater resistance indicates something unknown (probably caused by melting of ZrO2 showed in Figure 1.11a) happened at
~870 W. The power-temperature relationship maybe unreliable at power higher than 870 W. The highest temperature in this run should be >~3000 °C based on power- temperature relationship.
Figure 1.10b shows that the conductivity of BDD powder gradually increased with
change was one order of magnitude larger than that of the sintered BDD. Thus, a larger dynamic range of applied voltage was required for heating of the BDD powder tube compared to the sintered BDD tube. The conductivities of the heater in the first cooling and second cycle were similar to those of the sintered BDD tube heater in the corresponding stages.
1.4.4 Pressure generation and X-ray transparency of assembly with BDD heater
Figure 1.12a shows the pressure generation efficiency of cell assembly equipped with sintered BDD or BDG heater at room temperature. Compared with the BDG heater, the BDD heater exhibited lower efficiency for pressure generation at load up to 1500 tons. The pressure was measured to be 8.2 GPa for the assembly with the BDD heater and 10.4 GPa for that with the BDG heater at 1500 tons. Figure 1.12b shows the temperature effect on pressure at 1500 tons for the assembly with the BDD heater.
Below 1000 °C pressure increased with increasing temperature and then remained nearly constant in a temperature range between 1000 and 1500 °C. At 1500 tons, the pressure at 1000 °C was ~2.5 GPa higher than that at room temperature.
We also checked the performance of BDD heater by in situ X-ray imaging combined with falling sphere method. Two Re spheres are set at top and middle of the forsterite powder. During compression, the top sphere moved and disappeared out of
confirming that the BDD heater was highly X-ray transparent and could generate temperatures higher than 2300 °C.
1.4.5 Useful remarks for better use of BDD heater
Choice of electrode is an important issue for stable heating of BDD to very high temperatures. We first tested refractory metals such as Mo and Re and their combination (see Table 1.1). The Mo electrode was usually oxidized and melted or reacted with the BDD heater at temperatures higher than 2500 °C at the central part of assembly. Re foil electrode was always melted at ~2500 °C, possibly because of a hot spot in the Re foil.
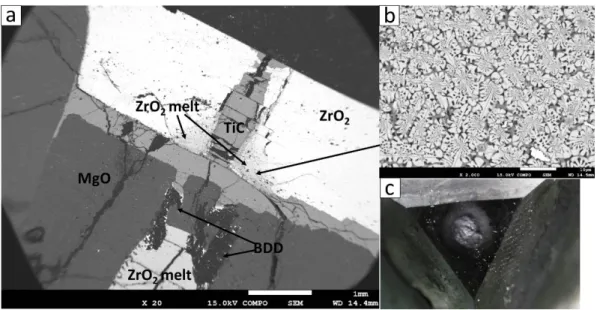
The combination Re and Mo electrode was also tried and not useful for temperatures above 3000 °C because the eutectic melting point between them is approximately 2500 °Ce.g., 21-22. It is found that TiC is as a good electrode material because it has a high electrical conductivity and a high eutectic point (~2800 °C at ambient pressure) between TiC and carbon23. TiC worked well even though the surrounding ZrO2 was melted (Figure 1.11a). No reaction between TiC and BDD was observed.
There are two common thermal insulators used in the Kawai cell: LaCrO3 and ZrO2. LaCrO3 provides a highly oxidized state, which may lead to instability of BDD.
Melting of ZrO2 always occurred at >2000 ˚C (depends on cell assembly) because of the relatively low eutectic point (~2000 °C at ambient pressure) between ZrO2 and MgO24. Figure 1.11a shows the melted ZrO2 penetrating into the heater and failure of heater prevents ultrahigh temperature generation. Figure 1.11b shows the dendritic texture of ZrO2 surrounding the TiC electrode. In the case without thermal insulator, the heating efficiency obviously becomes worse (such as 5k2576 in Figure 1.13).
Therefore, reducing and refractory thermal insulator should be developed in future for ultrahigh temperature (>3000 °C) generation with a BDD heater. In the current state,
Furthermore, melting of the truncated surface of WC anvils bounded by cobalt was frequently observed (Figure 1.11c) because its eutectic point (1300 °C at ambient pressure) is relative low compared with the target temperature and melting point of TiC electrode. We can protect the truncation surface by using a longer electrode (shorter heater) or enhancing the thermal gradient along the electrode. To enhance the thermal gradient between the heater and WC anvils (along the TiC electrode), a thermal insulator should not be used around the TiC electrode.
1.4.6 Ultrahigh temperature generation by BDD heater
We tried different assemblies using BDD heater to generate ultra-high temperature.
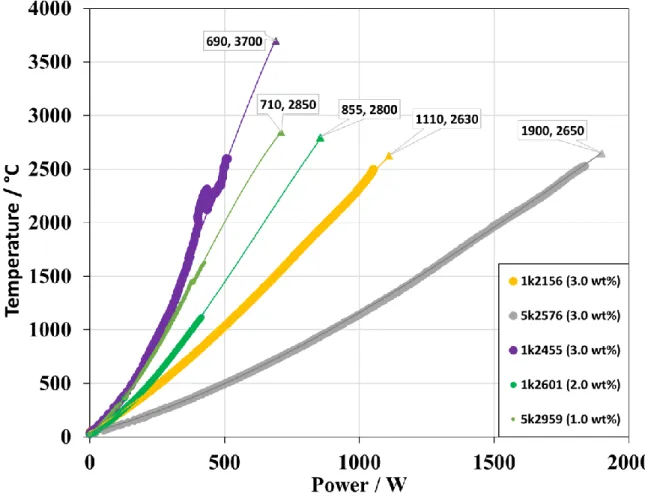
Figure 1.13 summarizes the power–temperature relationships of the ultrahigh temperature generation experiments. The highest temperature (~3700 °C) was generated in run 1k2455. The cell design of run 1k2455 is shown in Figure 1.3b in the supplemental materials. Figure 1.14b shows the heating log. One heating–cooling cycle was conducted. The power was increased to 400 W (corresponding to 2000 °C) smoothly in 1h. Then, the power–temperature relationship became abnormal, which might have been caused by the compaction of the BDD powder. Therefore, we maintained the power at 433 W for 35 min to complete the compaction process. Then, the power was increased again. The thermocouple was failed when the power reached 576 W (~2600 °C); we maintained the power for 5 min. Finally, we performed the challenge of ultrahigh temperature generation, and reached the highest power (690 W)
(~20 µm). This finding may provide evidence of MgO melting around the center. The melting point of MgO from 10 to15 GPa obtained from DAC experiments and theoretical calculation is 3200-4200°C25-29. Our estimated temperature is around the center of temperature range. Melting of the thermocouple and Re chip placed in sample position also occurred, as patchy W-Re alloy was distributed in the quenched MgO melt.
These observations suggest that the sample has experienced ultrahigh temperature. We conclude that BDD heater can generate ultrahigh temperature (>3000 °C) at high pressure (>10 GPa).
1.5 Conclusions and perspectives
We succeeded to synthesize BDD tubes and blocks with different boron contents at 15 GPa and 2000 °C. The conductivity of BDD increased with increasing boron concentration, and BDD with boron contents of 0.5–3.0 wt% exhibited good heating performance.
BDD with lower boron content was more likely to be semiconductor having an advantage for decreasing the thermal gradient inside the heater. In contrast, BDD with a high boron content showed metallic behavior, which was an advantage for achieving more stable heating even for fast heating experiments. BDD with lowe r boron content exhibited higher resistance and is therefore more suitable for a heating system with higher voltage and low current, and vice versa. Depending on the objective, researchers can select different boron contents to obtain BDD with the desired conductivity and heating performance.
BDD with a higher boron content (3 wt.%) is recommended for a BDD powder heater. The resistance of BDD heater is controlled by the boron content, heater porosity
The powder heater during the initial stage of heating has much larger porosity than that of the sintered ones, thus higher electrical resistance. To compensate the porosity effect, BDD with higher boron content is recommended.
The BDD heater can generate temperatures as high as 3700 °C, as estimated from the input power based on the power–temperature relationship. We confirmed melting Re, a W/Re thermocouple, MgO, ZrO2 and forsterite at pressures higher than 10 GPa.
It is found that not only the heater material but also related materials (such as the electrode, thermal insulator, and pressure medium) are important for achieving ultrahigh temperature generation. TiC is the best electrode material for a BDD heater.
Zirconia and LaCrO3 are not good thermal insulators for ultrahigh temperature generation using a BDD heater. Thus, the development of these related materials is needed in the future.
Figure 1.16 summarized the advantages of BDD heater compared with heaters using other heating materials. BDD is stable, refractory and highly X-ray transparent (Re sphere <70 µm is clearly visible) at lower mantle conditions. Thus, it shows great potential for melting the deep Earth and enables the structure and physical properties measurement of melts under lower mantle conditions. It can be applied to experiments on measuring melting points of lower mantle or core materials. It also can be applied to measure the partition coefficients of elements between silicate and iron melts, and viscosity of silicate melts under lower mantle conditions.
References in Part I
1. Ito, E., Schubert, G., Romanowicz, B., & Dziewonski, A. (2007). Theory and practice—multianvil cells and high-pressure experimental methods. Treatise on geophysics, 2, 197-230.
2. Irifune, T., Kurio, A., Sakamoto, S., Inoue, T., & Sumiya, H. (2003).Ultrahard polycrystalline diamond from graphite. Nature, 421, 599-600.
3. Shatskiy, A., Yamazaki, D., Morard, G., Cooray, T., Matsuzaki, T., Higo, Y., ...
& Katsura, T. (2009). Boron-doped diamond heater and its application to large- volume, high-pressure, and high-temperature experiments. Review of Scientific Instruments, 80(2), 023907.
4. Zerr, A., Diegeler, A., & Boehler, R. (1998). Solidus of Earth's deep mantle.
Science, 281(5374), 243-246.
5. Fiquet, G., Auzende, A. L., Siebert, J., Corgne, A., Bureau, H., Ozawa, H., &
Garbarino, G. (2010). Melting of peridotite to 140 gigapascals. Science, 329(5998), 1516-1518.
6. Andrault, D., Bolfan-Casanova, N., Nigro, G. L., Bouhifd, M. A., Garbarino, G., & Mezouar, M. (2011). Solidus and liquidus profiles of chondritic mantle:
Implication for melting of the Earth across its history. Earth and planetary science letters, 304(1-2), 251-259.
7. Nomura, R., Hirose, K., Uesugi, K., Ohishi, Y., Tsuchiyama, A., Miyake, A., &
Ueno, Y. (2014). Low core-mantle boundary temperature inferred from the solidus of pyrolite. Science, 1248186.
8. Frost, D. J., Poe, B. T., Trønnes, R. G., Liebske, C., Duba, A., & Rubie, D. C.
(2004). A new large-volume multianvil system. Physics of the Earth and Planetary Interiors, 143, 507-514.
9. Yamazaki, D., Ito, E., Yoshino, T., Tsujino, N., Yoneda, A., Guo, X., ... &
Funakoshi, K. (2014). Over 1 Mbar generation in the Kawai-type multianvil apparatus and its application to compression of (Mg0.92Fe0.08) SiO3 perovskite and stishovite. Physics of the Earth and Planetary Interiors, 228, 262-267.
10. Yamada, A., Irifune, T., Sumiya, H., Higo, Y., Inoue, T., & Funakoshi, K. I.
(2008). Exploratory study of the new B-doped diamond heater at high pressure and temperature and its application to in situ XRD experiments on hydrous Mg- silicate melt. High Pressure Research, 28(3), 255-264.
11. Yoneda, A., Xie, L., Tsujino, N., & Ito, E. (2014). Semiconductor diamond heater in the Kawai multianvil apparatus: an innovation to generate the lower mantle geotherm. High Pressure Research, 34(4), 392-403.
12. Xie, L., Yoneda, A., Yoshino, T., Fei, H., & Ito, E. (2016). Graphite–boron composite heater in a Kawai-type apparatus: the inhibitory effect of boron oxide and countermeasures. High Pressure Research, 36(2), 105-120.
13. Fujimori, N., Imai, T., & Doi, A. (1986). Characterization of conducting diamond films. Vacuum, 36(1-3), 99-102.
14. Ushizawa, K., Watanabe, K., Ando, T., Sakaguchi, I., Nishitani-Gamo, M., Sato,
15. Takano, Y., Nagao, M., Sakaguchi, I., Tachiki, M., Hatano, T., Kobayashi, K., ...
& Kawarada, H. (2004). Superconductivity in diamond thin films well above liquid helium temperature. Applied physics letters, 85(14), 2851-2853.
16. Ekimov, E. A. (2004). EA Ekimov, VA Sidorov, ED Bauer, NN Mel'nik, NJ Curro, JD Thompson, and SM Stishov, Nature (London) 428, 542 (2004).
Nature (London), 428, 542.
17. Ekimov, E. A., Sirotinkin, V. P., Shatalova, T. B., & Lyapin, S. G. (2015).
Thermally stable, electrically conductive diamond material prepared by high- pressure, high-temperature processing of a graphite+ boron carbide mixture.
Inorganic Materials, 51(3), 225-229.
18. Ekimov, E. A., Sidorov, V. A., Rakhmanina, A. V., Mel’nik, N. N., Sadykov, R. A., & Thompson, J. D. (2006). High-pressure synthesis and characterization of superconducting boron-doped diamond. Science and Technology of Advanced Materials, 7(S1), S2.
19. Jamieson, J. C., Fritz, J. N., & Manghnani, M. H. (1982). High Pressure Research in Geophysics. Center for Academic Publishing, Tokyo, 27-48.
20. Ohtani, E., & Kumazawa, M. (1981). Melting of forsterite Mg2SiO4 up to 15 GPa. Physics of the Earth and Planetary Interiors, 27(1), 32-38.
21. Knapton, A. G. (1958). The molybdenum-rhenium system. J. Inst. Metals, 87.
22. Savitskii, E. M., Tylkina, M. A., & Povarova, K. B. (1959). Phase diagram of the rhenium–molybdenum system. Zh Neorg Khim, 4, 424-34.
23. Seifert, H. J., Lukas, H. L., & Petzow, G. (1996). Thermodynamic optimization of the Ti-C system. Journal of phase equilibria, 17(1), 24-35.
24. Yin, Y., & Argent, B. B. (1993). Phase diagrams and thermodynamics of the
25. Zerr, A., & Boehler, R. (1994). Constraints on the melting temperature of the lower mantle from high-pressure experiments on MgO and magnesioüstite.
Nature, 371(6497), 506.
26. Cohen, R. E., & Gong, Z. (1994). Melting and melt structure of MgO at high pressures. Physical Review B, 50(17), 12301.
27. Du, Z., & Lee, K. K. (2014). High‐pressure melting of MgO from (Mg, Fe) O solid solutions. Geophysical Research Letters, 41(22), 8061-8066.
28. Liu, Z. J., Sun, X. W., Chen, Q. F., Cai, L. C., Tan, X. M., & Yang, X. D. (2006).
High pressure melting of MgO. Physics Letters A, 353(2-3), 221-225.
29. Kimura, T., Ohfuji, H., Nishi, M., & Irifune, T. (2017). Melting temperatures of MgO under high pressure by micro-texture analysis. Nature communications, 8, 15735.
Table
Table 1.1. Summary of temperature generation using BDD heater. The prefixes “1k”
and “5k” in the run numbers correspond to the 1000-ton and 5000-ton presses installed at the Institute for Planetary Materials (Okayama University), respectively, and that of
“S” corresponds to the SPEED 1500 press at the SPring-8 synchrotron facility. The heater size is defined in the order of outer diameter, inner diameter, and length.
Temperatures lower than 2300 °C were the values indicated by a W–Re thermocouple, whereas those higher than 2300 °C were estimated from the temperature–power relationship below 2300 °C. For the thermal insulator, “no insulator” indicates that a thermal insulator was not used in the cell assembly.
Run No.
Heater size / mm
Boron concentration Electrode Sample
Thermal insulator
P / GPa
Highest T / °C Sintered BDD tube heater
1k2128 1.0/0.7/2.0 3.0 wt% Re foil MgO ZrO
2 15 2000
1k2156 2.7/1.7/3.7 3.0 wt% Mo MgO ZrO
2 15 2630
1k2161 2.8/1.6/3.4 3.0 wt% Re tube+Mo MgO ZrO
2 15 2400
1k2188 2.6/1.5/6.0 3.0 wt% Re disk+Mo MgO ZrO
2 15 2500
5k2576 2.6/1.5/9.0 3.0 wt% Mo MgO no insulator 15 2650
S3023 2.8/1.7/9.0 3.0 wt% Mo Fosterite
amorphous boron
10 2300
1k2601 1.5/1.0/3.0 2.0 wt% Mo pyrope no insulator 15 2800
5k2959 1.5/1.0/3.0 1.0 wt% Mo pyrope no insulator 15 2850
5k2800 1.5/1.0/3.0 1.0 wt% TiC +Mo Al
2O
3 no insulator 15 1600
BDD powder tube heater
S3038 2.8/2.0/9.0 3.0 wt% Mo diopside
amorphous boron
10 2000
5k2743 1.5/1.0/6.0 3.0 wt%
TiC surrounded by ZrO2
MgO +Re wire
no insulator 15 >3000
1k2455 1.1/0.7/4.0 3.0 wt% TiC
MgO +Re wire
no insulator 15 3700
Figures
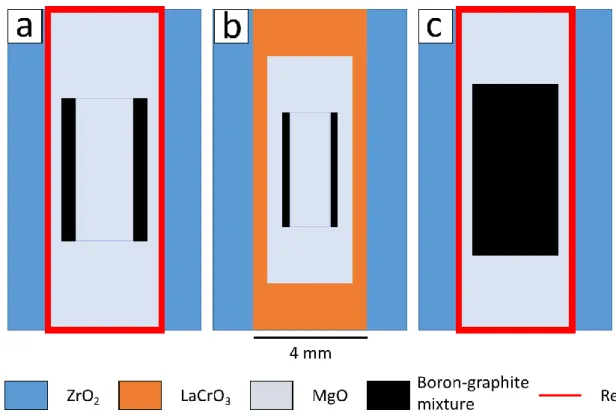
Figure 1.1. Example assemblies for synthesizing BDD tubes and blocks. a, 2.8/1.5 mm BDD tube, where the numbers before and after the slash correspond to the outer and inner diameters, respectively. b, 1.5/1.1 mm BDD tube. c, 2.8-mm-diameter BDD block.
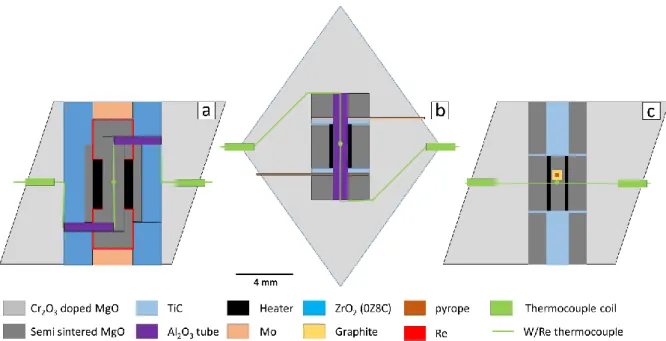
Figure 1.2. Schematic illustration of the cross section of assemblies for heating experiments using sintered BDD tube as a heater in the Kawai cell. a, Assembly for run 1k2161: Cr-doped MgO was used as the pressure medium, Ca-stabilized ZrO2 was used as the thermal insulator, and a BDD tube (2.8/1.6/3.4 mm) with 3 wt.% boron was used as the heater. The heater was separated from zirconia by a MgO tube to prevent the reaction between BDD and zirconia. The heater was filled with MgO. Mo was used as electrodes, which were separated from the heater by MgO rods wrapped with rhenium foil. The W/Re thermocouple vertically penetrating the BDD heater was insulated from rhenium by Al2O3 tubes. b, Assembly for runs 1k2475 and 5k2800: no thermal insulator was used around the heater and a BDD tube (1.5/1.0/3.0 mm) with 0.5 or 1.0 wt.% boron was used as the heater. The heater was filled with the Al2O3 tube
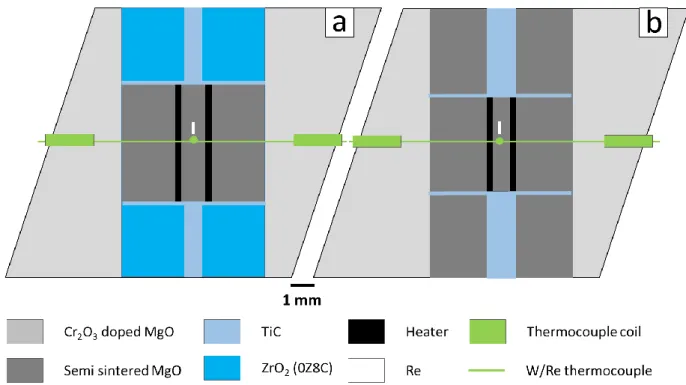
Figure 1.3. Example assemblies for testing BDD powder tube heater. a, 5k2743 and b, 1k2455. A 0.05-mm-diameter thermocouple was used. MgO powder was used near the thermocouple junction to insulate the thermocouple from the heater.
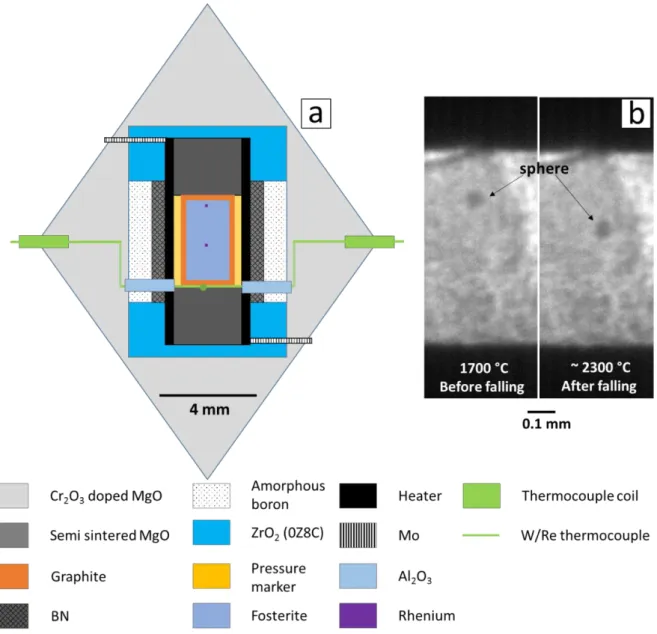
Figure 1.4. Assembly and radiography images for experiments conducted at SPring-8 synchrotron facility. a, Assembly; MgO+15 wt.% diamond was used as the pressure marker. b, X-ray shadow images of rhenium sphere in run S3023 using BDD heater.
Figure 1.5. Microscopic images of synthesized BDD blocks and tubes. a, Microscopic image of BDD blocks. b, Top and side views of 1.5/1.1/3.0 mm BDD tube, which exhibited sufficient strength for assembly as a heater in a Kawai cell. c, Side view of 2.6/1.5/3.35 mm BDD tube. The small white patches in the optical microscopy image are residual MgO attached to the BDD tubes. d, Top view of 2.6/1.5/3.35 mm BDD tube. The wall thickness of the tubes appears fairly homogeneous.
Figure 1.6. Secondary electron image of synthesized BDD. The grain size of granular BDD is ~1–5 μm.
Figure 1.7. X-ray diffraction patterns of the synthesized BBD with various boron contents. Dia: diamond without doping, Gr: graphite, BDD: boron-doped diamond.
The X-ray beam size was 100 μm.
Figure 1.8. The power–temperature diagrams of sintered BDD tube heaters. (a, b, c, d) 0.5, 1.0, 2.0 and 3.0 wt.% BDD, respectively. Assemblies are shown in figure 1.2.
Figure 1.9. Arrhenius plots of sintered BDD tube heaters. (a, b, c, d) 0.5, 1.0, 2.0 and 3.0 wt.% BDD, respectively. Assemblies are shown in figure 1.2.
Figure 1.11. (a,b) SEM images of recovered sample of run 5k2743 and (c) optical microscopy image of recovered truncation area of WC cube. b, Dendritic texture indicating melting of ZrO2. c, Melting of the truncated surface of WC anvil after the heating generation.
Figure 1.13. Summary of power–temperature relationships in the experiments for ultrahigh temperature generation. ZrO2 thermal insulator and no thermal insulator was used in run 1k2156 and 5k2576, respectively. A small heater (1.1/0.7/4.0 mm) and no thermal insulator was adopted in run 1k2455. Only the final heating cycle was plotted in each experiment. The triangle symbols mark the highest applied powers and corresponding temperatures estimated by the power–temperature relationship. The numbers in brackets indicate the boron content. The trend lines were fitted by cubic polynomial functions.
Figure 1.15. (a–d) SEM images of recovered sample of run 1k2455. a, Secondary electron image (SEI) showing wide view of the cell. c, Back-scattered electron (BSE) image of the rectangular area in (a). Zoom up SEI images show that the MgO near the electrode exhibited a larger grain size of ~20 µm (b), whereas the grain size of MgO at the center of heater was approximately 1 µm (d).
Figure 1.16. Comparison between traditional heating material and BDD in multi- anvil apparatus. Solidus and liquidus of peridotite refers to Ref. 5 . BDD is X-ray transparent and can melt lower mantle materials.
Part 2. Viscosity measurement of silicate melts
up to ~30 GPa
2.1 Abstract
Silicate melts exist in the deep interior of both present and early Earth. Silicate melts have played an important role in the differentiation of our planet’s interior at all times. Thus, transport properties, in particular melt viscosity, is a key to understand the chemical evolution of Earth. In this study, we succeeded to extend the experimental measurements of silicate-melt viscosity up to about 30 GPa and more than 3200 K, by devising an in-situ falling sphere method coupled with boron-doped diamond heater and ultra-fast camera (1000 f/s) in the multi-anvil apparatus. We determined viscosities of molten forsterite, enstatite and diopside composition from ~5 to 30 GPa and at temperatures near their liquidus. We obtained the viscosity as a function of pressure and temperature for each composition through fitting the experimental data assuming a thermal activation process against the dimensionless temperature normalized by melting temperature at each pressure. The viscosity of silicate melt shows a complex pressure dependence due to the pressure induced densification mechanism change.
Through our viscosity data, we firstly verify the four densification mechanisms proposed by molecular dynamic simulations. Our results also show some clues on the composition effect on silicate melt viscosity. Si is a network former at low temperature and low pressure. Its role is similar with ‘modifier’ at high pressure and high temperature. The modifier with higher density will cause a lower viscosity of silicate
2.2 Introduction
2.2.1 Silicate melts in the Earth
Silicate melts exit in both the early and present Earth. The Earth experienced several episodes of magma-ocean in the early stage of its accretion, due to radiogenic heating from within and gravitational heating by the bombardment of planetesimals from space, especially the giant Moon-forming impact1. Amount of magma is also expected in the present upper mantle. Seismology detects pronounced low seismic velocity regions in the transition zone and the D” layer, which have been attributed to partial molten processe.g. 2,3.
Throughout most of its ~4.5 Gy history, silicate melts have played an important role in the differentiation of our planet’s interior4,5,6. Detailed knowledge about major magma forming silicate melts is essential to understand the thermal and chemical evolution of our planet.
2.2.2 Viscosity of magma
Transport properties, in particular melt viscosity, which depend on pressure, temperature and composition, are key parameters to understand various magmatic processes in the Earthe.g. 7,8 . In magma ocean, the viscosity is a critical parameter that controls the convection dynamics; then it in turn controls the cooling rate of the early Earth8 and the life time of magma ocean9. Viscosity of magma ocean is also important for chemical equilibration between silicates and core-forming metallic liquids10 and the physics of crystal settling in a convecting magma ocean7,8 . As for partial melt, viscosity is an important parameter which controls its migrationeg.11. The silicate melt viscosity
its ~4.5 Gy history.
In literatures, there are usually two definitions on viscosity: the dynamic viscosity and kinematic viscosity. Dynamic viscosity is expressed as:
τ = 𝜂𝜕𝑢
𝜕𝑦 ……….……….3.1
where η is the dynamic viscosity, τ is stress and ∂u / ∂y is the partial derivative of shear velocity. Kinematic viscosity is expressed as:
ν =𝜂
𝜌 ……….……….3.2
where ν is the kinematic viscosity and ρ is density. In this study, it refers dynamic viscosity when mentioning viscosity.
2.2.3 Methods to determine viscosity of silicate melt at high pressure
Table 2.1 compares different methods to estimate viscosity of silicate melts at high pressures. Simulation method and high pressure high temperature experimental method, which are complementary, are the two main methods. Compared with experimental method, simulation method is less expensive. There are usually two simulation methods:
classical molecular dynamic (C-MD) simulation and first-principle molecular dynamic (FP-MD) simulation. Based on atomistic models, the C-MD simulation permit fast computation, thus can calculate with a relative large cell (more than 2000 atoms) for long time12-15. These advantages in practice make it possible to calculate melt viscosity
electronic structure at each time step16. Thus, maximum atoms used to calculate the viscosity is less than 200 atoms17, which may cause a large uncertainty owing to a finite size effect. Due to the nature of two different simulation methods, a large discrepancy exists between their results. For example, MD simulation shows that a viscosity increases by a factor of 75 along the 3000 K isotherm from the top of the mantle to the core-mantle boundary for MgSiO3 melt14. While, FP-MD reports that a factor over 200 along the 3000 K isotherm from the top of mantle to the core-mantle boundary for MgSiO3 mel17.
As for the experimental methods, there are also two methods: viscosity estimation from self-diffusivity of network forming ions and falling sphere method (FSM). The viscosity is related with the self-diffusivity of network ions through Eyring relation:
D =𝑘𝐵𝑇
𝜂𝜆………..3.3
Where D is the diffusivity of Si or O, kB is the Boltzmann constant, T is temperature (K), λ is translation distance of the diffusion ion (usually taken to be 2.8 Å for silicate melts). Since diffusion experiments have less experimental difficulty than falling sphere method, self-diffusivity of Si and O have been successfully measured up to 15 GPa18. However, this method is an indirect method and the accuracy of results depends on the validity of Eyring equation and translation distance.
Based on the stoke’s law, (in-situ) falling sphere method (FSM) is a direct and most accurate method to measure viscosity. However, the pressure range of this method only reach 13 GPa until now. Extending the pressure range of this method is required.
2.2.4 Previous researches on viscosity measurement by FSM
Kushiro,197619 first introduce the FSM to measure viscosity of silicate melt at
a multianvil apparatus is required for pressure and temperature generation in a large volume. Because of the sample volume reduction, in-situ X-ray observation is critical to determine viscosity precisely. In 1987, Kanzaki et al.20 first developed the method to measure viscosity of silicate melt in a cubic multi-anvil press combined with synchrotron X-ray, and extend the pressure range to ~10 GPa. Reid et al. 200321 implant the in-situ FSM in a Kawai-type multi-anvil and extended the pressure range to 13 GPa.
However, since then, the pressure range has not yet extended due to the technical difficulties caused by ultrahigh melting temperature of silicate and extremely low viscosity of silicate melts at high pressureeg.21-24. More refractory heater material is needed to melt the silicate sample at higher pressure. In order to ensure the laminar flow during sphere falling process, the sphere size must be limited small (<100 μm) for measuring low viscosity, which requires highly X-ray transparent heater material.
The BDD heater is the best candidate to extend FSM to higher pressure because it can generate temperature as high as 4000 K with highly X-ray transparency reported in part 125. Furthermore, accurate determination of rapid terminal velocity is required in low viscosity measurement, which, in turn, requires ultra-fast camera (~1000 fps) for synchrotron X-ray radiography.
Thus, the combination of BDD heater and ultra-fast camera (>1000 fps) for synchrotron X-ray radiography enables us to conduct the IFSV in the Kawai multi-anvil apparatus to the pressure range of ~30 GPa, which corresponds to the pressure near the
study is to apply BDD as a heater for viscosity measurement until the lower mantle conditions and understand the pressure dependence of silicate melt viscosity.
2.3 Experimental procedure
Viscosities were measured by in-situ falling sphere method (FSM) in multi-anvil apparatuses (MAA) installed at beamline BL04B1, SPring-8 and beamline Physché, SOlEIL synchrotron facilities. Cubic WC anvils with 26 mm edge and 4 mm truncation edge length were used as second stage anvils. Rhenium (Re) spheres for falling sphere viscometry were fabricated from stripes of 25 μm thick Re foil through applying flash current generated by a slidac set at 100 V. The Re stripes were immerged in liquid nitrogen to prevent the oxidization and quench the resulting sphere. Diameters in vacuum were measured in a field emission scanning electron microscope with largest uncertainty of ± 2 μm. Spheres of ~70 μm diameter were used for the viscosity measurements. Single crystals of forsterite/diopside were first crashed and grinded into powder, then those powders were molded into a cylinder shape (0.7 mm diameter) and semi-sintered at 1273 K for 1h. Enstatite glass was first made from a mixture of MgO and SiO2 (with molar ration: 1) and grinded into powder, then was molded into a cylinder shape and semi-sintered at 1273 K for 1h.
Figure 2.1a shows the schematic set-up of experiments. The incident and diffracted X-rays will go through horizontal cuttings of first-stage anvils, and vertical gaps between second-stage anvils. The energy dispersive powder X-ray diffraction with white X-rays was conducted using a Ge solid-state detector to identify phases present in a sample and determine pressure. The two-theta angle is ~6 degrees. Fast camera (C9300, C11440 at SPring-8 or Photron FASTCAM SA3 at SOLEIL) was adopted to
The schematic cell assembly is shown in Figure 2.1b. A Cr-doped MgO octahedron with a 10-mm edge length was used as the pressure medium. The edge and vertex of MgO octahedron were truncated. Graphite and BDD were used as heater at pressures lower and higher than 8 GPa, respectively. The preparation of BDD heater were according to Part 1. Mo and TiC were adopted as electrode for graphite and BDD heater, respectively. MgO with 10 wt% diamond (grain size: 1μm) was used as pressure marker.
Polycrystalline sample was placed in graphite capsule. A Re sphere was set near the top of the sample as a probe. A thin sample layer was set between the sphere and graphite cap to prevent contact with the graphite cap. Thermocouple (W97Re3‒W75Re25)was placed below the graphite capsule. No correction was applied for the effect of pressure on the thermocouple emf.
We first compressed the cell to the target load and heated to 1273 ~1773 K. While keeping the temperature, we measured the pressure through X-ray diffractions from the pressure marker. Then we conducted fast-heating (within 4s) just after triggering the fast camera at a speed of 400-1000 fps. It is noted that thermocouple usually broke down during the fast heating. After observing the falling of sphere, we kept the power and measured the pressure again. Finally, samples were recovered and polished for further postmortem analyses after quench and decompression.
Temperatures below 1773 K were measured by W97Re3‒W75Re25 thermocouple and were used to construct a power-temperature relationship in each run. Temperatures
MgO and temperature measured by thermocouple. At the temperature of 1273K, the resulted temperature difference was estimated to be less than 60 K between thermocouple position and center of capsule, while it was less than 10 K between the center and the top of capsule.
To estimate the temperature overshoot during fast heating, we conducted FEM simulation using COMSOL™. The simulation geometry and material was shown in figure 2.2a. We used a cylindrical shape of pressure medium in order to simply the geometry without losing the essence of critical part inside the heater. In the simulation, fast heating was conducted in 2s. The melting temperature was set to be 2500 K; thermal conductivity of sample was assumed to be 50 and 2.5 W/(mK) before and after melting, respectively. Figure 2.2b shows the resulted temperature log. The latent heat effect turned out to be negligible for the present small sample. The temperatures of position 1 is lower and higher than that of position 3 before and after sample melted, respectively (Figure 2.2c). Thus, the center of sample has lowest temperature after sample melted, which should be caused by the low thermal conductivity of melt. The temperature difference among the four points was less than 40 K, which also support our estimated temperature gradient by EOS of MgO. Since the falling time in our experiments is less than 100 ms, the overshoot of temperature is estimated to be ~60 K (Figure 2.2d).
The pressure was calculated using the equation of state of MgO26. We referred the pressure measured after sphere falling as the pressure during sphere falling, if heater survived after fast heating. If heater failed after fast heating, the pressure measured at same condition in another run or the pressure measured at 1273~1773 K was referred as pressure during sphere falling. The error of pressure was estimated to be 1 GPa for such runs.
2.4 Results and discussions
2.4.1 Falling path and terminal velocity of sphere
An example X-ray shadow images of Re sphere was shown in figure 2.3a. The small Re sphere (67.4 μm before compression) is clearly visible. Figure 2.3b shows the microscopic images of recovered sample. Samples were well sealed in the capsule. The shape of Re sphere was well kept.
The position of sphere in sequential images were fitted by Gaussian fitting. In order to determine the accuracy of sphere position, we took sequential images of sphere before heating. The error of sphere position is determined by statistically analysis of sphere position. One standard deviations of sphere position are 0.6 and 0.4 μm for experiments at SPring-8 and SOLEIL, respectively (figure 2.4). A distance-time diagram can be drawn using the fitted sphere position. Figure 2.5 shows an example of the distance-time diagram. The sphere obviously reached the terminal velocity. The terminal velocity (𝑣𝑠) of sphere was calculated from the distance-time diagram.
2.4.2 Viscosity of silicate melts as a function of pressure and temperature
The viscosity η of melt was then calculated using Stokes’ law:
and the melt respectively, and g=9.803 m·s−2 is the acceleration due to gravity. W and E are correction factors that account for the wall and end-effects of a finite cylindrical container of radius 𝑟𝑐 and height ℎ𝑐27. The radius and density of sphere during sphere falling was calculated using the equation of state of Re in ref.28. The density of fosterite, enstatite and diopside melts were calculated from the equation of state of molten Mg2SiO429, MgSiO330(derived from glass density data) and CaMgSi2O631 respectively.
The radius rc and hc (~0.7 mm) was estimated through recovered sample. Because rc
andhc is much larger than the sphere size, the resulted viscosity is not sensitive against the input value of rc andhc.
To understand the error propagation through the equation of state and stokes’ law, we conducted Monte Carlo simulation. The error of pressure, temperature, terminal velocity and sphere size with Gaussian distribution were set as the source errors for propagation.The sampling number for each parameter was 10,000. Figure 2.6 shows the results of Monte-Carlo simulation. The main error source for viscosity was found to be the uncertainty of sphere size in the present set-up. The total viscosity error is less than 10%.
Table 2.2 shows the experimental conditions and results. Good reproducibility was confirmed by repeated experiments at same pressure and same temperature with similar or different sphere sizes. Figure 2.7 shows the viscosities measured in the present work.
Owing to the nature of the present IFSM, the resulted viscosities were mainly measured along the liquidus of each sample. In order to describe the pressure and temperature dependence of the viscosity, we assumed a thermal activation process against the dimensionless temperature normalized by melting temperature at each pressure; the functional form is given as:
(𝑃) ∗(𝑃) ∗(𝑃)
where 𝜂0 a scale factor; k Boltzmann constant; T absolute temperature; P pressure, Tm
melting temperature at pressure P; Ea activation energy; T* dimensionless temperature normalized by Tm; E*a dimensionless form of the activation energy. Owing to the formalism of (1), we can easily obtain the pressure dependence of E*a through the logarithmic viscosity-pressure diagram along the liquidus (figure 2.7 a, c, e).
ln(𝜂) = ln(𝜂0) + 𝐸𝑎∗(𝑃)………..3.8 The melt viscosities of Fo, En and Di compositions can be fitted by cubic polynomials until 30 GPa (figure 2.7 a, c, e). Thus, η can be expressed by the following equation:
𝜂(𝑃, 𝑇) = 𝜂0exp (−𝑎0+𝑎1𝑃+𝑎2𝑃2+𝑎3𝑃3
𝑇∗ ) , 𝑃 ≤ 30 GPa ………3.9 η0, a0, a1, a2, a3 are obtained by fitting the viscosity data at ambient and high pressure using orthogonal distance regression. The melt viscosities of Fo, En and Di compositions is also fitted by two linear sections until 30 GPa (figure 2.12). The fitted parameters are shown in Table 2.3.
Figure 2.7 (b,d,f) shows the calculated viscosities of silicate melts along isothermals using the fitted equations. Viscosity of Fo melt first shows a weak pressure dependence up to ~10 GPa, then shows a gradual increase from ~10 to ~30 GPa.
Viscosity of En melt decreases rapidly in the low pressure range up to ~10 GPa, then gradually increases up to 28 GPa, and decreases again above 28 GPa. As for Di melt, viscosity first increases up to ~10 GPa, then decreases up to ~21 GPa, and then increases at pressures higher than 21GPa. The viscosities of silicate melts along isothermals were
complex pressure dependent17,32, 33. The average value of calculated data along 3000 K for Fo32, En17 and Dimelt33 show similar complex pressure dependence of viscosity at pressures lower than 40 GPa. Thus, the first principle studies support our experimental data. The experimentally determined self-diffusion of oxygen and silicon in diopside melt (up to 15GPa) 18 show a positive pressure dependence of viscosity below 10 GPa, and a negative pressure dependence at higher pressure, which also supports our results.
Figure 2.8 shows the activation enthalpy calculated from fitted functions. The activation enthalpy also shows complex pressure dependence. Fo melt (~100 kJ/mol) has the lowest activation enthalpy of viscosity, which is increasing with pressure. Di melt (~250 kJ/mol) has the highest activation enthalpy of viscosity. It increases with pressure until ~5 GPa, then decrease with pressure until ~22 GPa and increase with pressure again until 30 GPa. The activation enthalpy of En melt is ~150 kJ/mol, which first decreases with pressure and then increases with pressure. Those values are consistent with results of first-principle simulation and diffusion experimental data 17-
18,32-39.
2.4.3 Densification mechanisms of silicate melt under high pressure
The complex pressure dependence of silicate melt viscosity is due to the densification mechanism change with increasing pressure15. According to the molecular dynamic simulation on sodium silicate melts under high pressure, three densification mechanisms (T1, T2 and T3) are proposed before the coordination number change of Si15. Here, we refer the densification by increasing coordination number of Si as T4. In T1 region, silicate melts behave like ionic liquids consisting of modifier ions (Mg or Ca) and SiO4 groups; the main mechanism of densification is thought to be simple
melt increase with pressure (compact effect). In T2 region, the collapse of the SiO4
network is the main densification mechanism; the viscosity has a negative pressure dependence due to the bending of Si–O–Si; on the contrary, the modifier’s CN has a positive pressure dependence for the same reason. In T3 region, the silicate liquids gradually evolve to a coesite-like network structure by increasing the number of four- membered rings and decreasing five to seven-membered rings; viscosity increases with increasing pressure; modifier’s CN almost keep constant. In T4 region, silicate liquids densify through coordination number increase of Si; the viscosity may decrease with increasing pressure. The reported CN of Mg in Fo glass has a positive pressure dependence at 0-~10 GPa34. The CNs of Mg, Ca in diopside melt show positive pressure dependence at 0-~20 GPa35. The pressure induced Si CN change in silica glass starts at
~20 GPa36-37. We expect the Si CN change in Fo/En /Di melt starts at higher pressure.
Because lower SiO2 content in silicate melt, increases the changing pressure of Si CN.
Figure 2.9 shows the pressure range of densification mechanisms for Fo, En and Di melts, based on the pressure dependence of viscosity and modifier’s CN. All the four densification mechanisms are identified in our measured pressure range. The densification mechanisms of Fo melt are T2 (0 to ~10 GPa) and T3 (10 to 30 GPa);
those of En melt are T2 (0 to ~10 GPa), T3 (~10 to ~28 GPa) and T4 (~28 to 30 GPa);
those of Di melt are T1 (0 to ~5 GPa), T2(~5 to ~21 GPa), T3(~21 to ~30 GPa). The densification mechanisms are summarized in Table 2.4.
seems support the SiO4 group and impedes the bending of the Si-O-Si bond.
Figure 2.11a shows the effect of SiO2 content on viscosity by comparing viscosity of Fo and En melt. At high temperature (>3000 K), melt is fully depolymerized; the Fo and En melt act like ionic liquids consisting of Mg ions and small SiO4 groups (or even Mg, Si and O ions); the large silicate anions or O anion are the limiting species; their motions are impeded by Mg cation; thus, melt with higher Mg content has higher viscosity. With decreasing temperature and pressure, the SiO4 group becomes larger and the degree of polymerization controls viscosity of silicate melts; melt with higher SiO2 content (lower Mg content) is more polymerized and has higher viscosity. A crossing of viscosity-pressure curves along isotherms may occur for melts with different SiO2 content (as shown in Figure 2.11a).
Figure 2.11b shows the effect of modifier’s density by comparing viscosity of Fo and Fa melt. Fe2+ has similar diameter but higher atomic mass than Mg2+. Thus, Fe2+
has lower diffusivity than Mg2+, i.e., Fa melt has higher viscosity than Fo melt. Figure 2.11d shows the size effect of modifier by comparing viscosity of En and wollastonite (Wol; CaSiO3) melt. En melt and Wol melt have similar viscosity, but different pressure dependence. En melt shows negative pressure dependence until ~10 GPa, Wol melt shows positive pressure dependence until ~6 GPa, which is roughly consistent with T1 region of Di melt. Figure 2.11c shows the effect of mixing configuration entropy by comparing viscosity of En and Di melt. In the T1 and T3 region, Di melt has lower viscosity than En melt because of the mixing configuration entropy. In the T2 region, viscosity is controlled by the bending of Si-O-Si angle. Owing to the Ca cation, Di melt has higher viscosity than En melt due to the less bending of Si-O-Si angle.
2.5 Conclusions
We succeeded in developing the method to extend the viscosity measurement of silicate melt down to the lower mantle.We determined viscosities of molten forsterite, enstatite and diopside from 5 to 30 GPa and at temperatures just above their liquidus.
Through fitting the high-pressure data in this study and low-pressure data in literature by homologous temperature scaling, we obtained a viscosity function of pressure (up to 30 GPa) and temperature for each composition (Fo, En, and Di melt).
The viscosity of silicate melts shows complex pressure dependence up to 30 GPa, which is related to the pressure induced densification mechanism change. Combining our viscosity data and pressure induced CN change data in literature, we succeeded to
verify all the four densification mechanisms of silicate melt. The size of modifier cation has an influence on the pressure range of densification mechanisms. The large modifier cation can support the SiO4 group and impedes the bending of Si-O-Si bonding. At low temperature and low pressure, the viscosity of silicate melts is mainly controlled by polymerization of SiO4 network. Thus, melts with higher SiO2 content has higher viscosity. At high temperature and high pressure, SiO4 network is depolymerized or changes to ionic-like SiO6 network; viscosity is controlled by the content of
‘modifier’; melts with lower SiO2 content has higher viscosity. The modifier cation with higher density, usually has lower diffusivity and higher viscosity. The size of modifier cation has small effect on the viscosity value of melt, but it has a large effect on the pressure dependence of viscosity.