Spatial Patterns of Higher-Education Workforce
Movements at Entrance to and Graduation from
Universities in Thailand
著者
NIWA Takahito
journal or
publication title
The science reports of the Tohoku University.
7th series, Geography
volume
61
number
1
page range
23-41
year
2015-08
URL
http://hdl.handle.net/10097/60653
Spatial Patterns of Higher
-Education Workforce Movements at
Entrance to and Graduation from Universities in Thailand
Takahito NIWA*
Abstract The spatial patterns of the movement of individuals as they enter a
univer-sity and the movement of univeruniver-sity graduates as they secure a job were examined at the national scale in Thailand. The main findings are as follows : First, the concentra-tion of the workforce of university graduates in Bangkok was remarkable, mainly because many graduates who had come from rural regions to Bangkok continued to stay there for their employment after graduation. At the same time, many students tended to enter their home province’s universities and stay in their home provinces after grad-uation. This occurred in a system that favors local examinees through quota examina-tions. For that reason, many graduates of local high schools entered one of their prov-ince’s universities. They also tended to look for jobs in their own provinces. This tendency was especially strong among graduates in the humanities and social sciences. In contrast, a portion of the graduates in natural sciences and engineering moved to Bangkok and its surrounding areas, where there are abundant jobs in their fields.
Key words : spatial pattern, movement for entering university, movement for job,
educational system, Thailand
*Part-time Lecturer, Saitama University, Shimo-Okubo 225, Sakura-ku, Saitama, 338-8570, Japan E-mail : [email protected]
1. Introduction
This paper examines the spatial patterns of the workforce’s university graduates, which is of importance in light of the significant increase in the level of academic achievement of the workforce in Thailand. The increase in the quality of the workforce has been an urgent chal-lenge for Thailand’s economic growth (Srikatanyoo, 2007 ; Wiboonchutikula, 2009). Having a workforce that has a high academic background increases a country’s labor productivity and supports its economic growth (Bhula-or and Kripornsak, 2008).
However, only a limited number of studies have discussed the spatial structure related to the supply of the workforce’s university graduates. A few studies examined factors that affect the movements of individuals entering higher educational institutions and the movements of university graduates. For example, Sukhawatthanakun, et al. (2010) investigated the factors that affected the choices made by female students at a high school in Udon Thani Province in Thailand’s Northeastern Region when they were considering enrolling in a university, and the
results indicated that when the high school graduates were planning on achieving a higher level of education, the location and quality of the university, the tuition, and the motivation of the stu-dent all had an impact. Moreover, other studies have revealed that when university graduates select their workplace, their selections are influenced by the important social ties of family, and as a result, the tendency to stay in or near the graduates’ local community is strong. It has also been demonstrated that people who move to other areas for a job are influenced by aca-demic achievement, expected income and the experience of moving in the past (Morathop et al. 2010 ; Kanethong et al. 2010).
The above studies analyzed the factors affecting the enrollment at individual universities, but they did not refer to the spatial structures of the movement of university graduates for jobs on a national scale in Thailand. Here, I examined the spatial distribution of universities and the spatial patterns of movement of university students.
2. Educational Policy
2.1 The Higher Educational System in Thailand
In Thailand, the spread of education has been strongly promoted for the development of the society. In concert with its economic growth, Thailand is raising its educational standards to a level that is as high as those of other developed countries, from a level that was low even for developing countries.
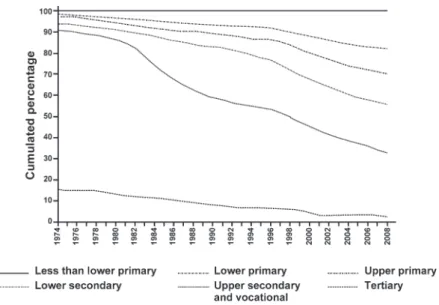
Figure 1 shows the changes in the percentages of the workforce by different academic backgrounds. In 1974, 90% of the Thailand’s workforce population had not completed elemen-tary education, and the Thai workforce at that time was comprised of unskilled laborers. In 2008, due to the spread of education the percentage of individuals who had not completed ele-mentary educationhad been reduced to 60% of the total workforce, and there was a remarkable increase in the percentage of individuals who had completed secondary and higher education. Since the latter half of the 1990s, there has been a further and sudden increase in the percent-age of the Thai workforce that attained higher education. According to the World Bank, the percentage of people in Thailand who were attending an institution of higher education climbed to 45% in 20101). Since the National Educational Plan was set out in Thailand in 1978, the
education system has become the same as that of Japan in its 6-3-3-4 year structure (Figure 2).
Higher education in Thailand originated with the opening of Chulalongkorn University in 19172). In the pre-WWII days, the only universities that were newly established were the
national universities Thammasat University (Political Study) in 1933, Kasetsart University (Agricultural Science) in 1943, and Mahidol University (Medical Science) in 1943. These were specialized institutions for specific fields of study. In the 1960s, Thailand’s first regional uni-versities were established as the primary bases of regional education. Chiang Mai University was established in the Northern Region, Khon Kaen University in the Northeastern Region, and Prince of Songkla University in the Southern Region. The establishment of universities
that fell into the regional category was based on the First National Economic Development Plan, and the establishment of these universities had a significant influence on the spread of education. In the 1970s, Ramkhamhaeng University (RU) and Sukhothai Thammathirat Open University (STOU) were established as open access universities (OAUs). Allowing all of the applicants to enter into these two universities was an attempt to fulfill the national demand for higher education. Since the initial opening of these schools, the number of people admitted to these universities has reached ten times or more the total number of other universities.
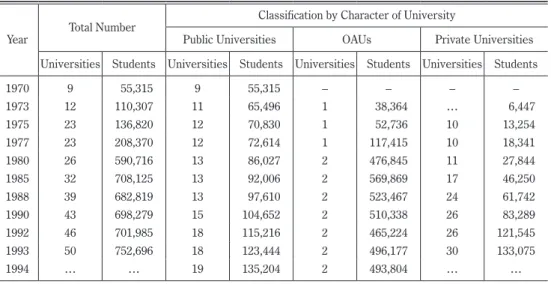
In the 1980s, there was a rapid expansion of both the number of private universities and the number of students enrolled. Table 1 shows the change in the number of universities and the number of students since 1970. In 1970, there were only nine public universities in Thai-land, and the total number of students at these universities was 55,000. At that time, higher education was only intended for a portion of the elite3). Thailand then experienced a sudden
expansion of the number of students along with the establishment of the OAUs and private uni-versities. In 1990, the number of students at the OAUs had grown to 510,000, and there were 26 private universities with 80,000 students. A comparison with the 100,000 students at the 43 public universities from that same point in time makes it apparent that the OAUs and private universities shouldered the burden of the expansion of higher education.
However, many of these universities were located within the Bangkok Metropolitan Administration (BMA). In the 1990s, the decentralization of universities to various regions
Figure 1 Percentages of the workforce by different academic backgrounds (1974-2008). Source : Oudin (2010)
moved forward, mainly by elevating the status of the Rajabhat Institutes and Rajamangala Insti-tute—which are located around the entire country—to universities. Rajabhat Institutes were changed to regional universities in 1995, and the number of their students quickly increased.
Figure 2 The educational system in Thailand. Source : Office of Educational Council (2008)
Table 1 Changes in the Numbers of Universities and Students in Thailand
Year Total Number
Classification by Character of University
Public Universities OAUs Private Universities Universities Students Universities Students Universities Students Universities Students
1970 9 55,315 9 55,315 – – – – 1973 12 110,307 11 65,496 1 38,364 … 6,447 1975 23 136,820 12 70,830 1 52,736 10 13,254 1977 23 208,370 12 72,614 1 117,415 10 18,341 1980 26 590,716 13 86,027 2 476,845 11 27,844 1985 32 708,125 13 92,006 2 569,869 17 46,250 1988 39 682,819 13 97,610 2 523,467 24 61,742 1990 43 698,279 15 104,652 2 510,338 26 83,289 1992 46 701,985 18 115,216 2 465,224 26 121,545 1993 50 752,696 18 123,444 2 496,177 30 133,075 1994 … … 19 135,204 2 493,804 … … Source : Suehiro (2009)
The 39 Rajamangala Institutes across the country were promoted to universities in 2005 and reorganized into nine schools4). In addition to these two instances, several new information
technology (IT) campuses of existing universities have opened since the 1990s. There has thus been a large-scale improvement in the opportunities to attend universities in rural regions
as well (Muangkeow, 2009).
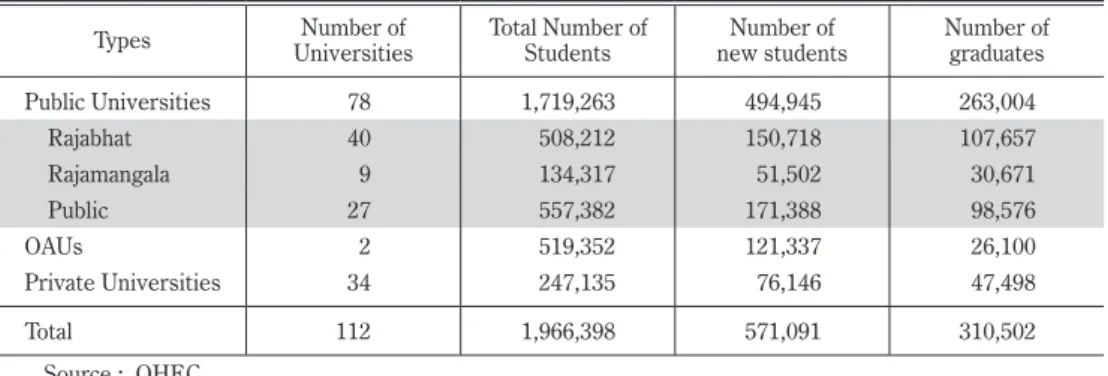
Table 2 shows the total number of undergraduate students, the number of new students and the number of graduates by the type of university in 2008. At that time, there were 112 universities under the jurisdiction of Thailand’s Office of the Higher Education Commission (OHEC). These are 27 public universities, two OAUs, 40 Rajabhat Universities (RUs), nine Rajamangala Universities of Technology (RUTs) and 34 private universities. In 2008, a total of 1.96 million students attended the 112 schools. The two OAUs had the largest combined num-ber of students at approx. 519,000, and the numnum-ber of students at these two schools has hardly changed since the 1980s. The 40 RUs newly transformed as universities also had 508,000 undergraduate students in 2008. The number of undergraduates at the private uni-versities, on the other hand, was only 247,000, and the average number of students for each school was less than half that of the other universities.
In 2008, the numbers of new university students and graduates were 494,945 and 263,004, respectively. The total number of new university students nationwide had climbed to 500,000, but the number of university graduates was approximately half that number at around 250,000. It is possible that in addition to the increase in the number of students accepted into universi-ties, there were many students who dropped out before graduation. This phenomenon may have been caused by the introduction of the new type of universities in Thailand, similar to the introduction of universities by the North American model that is characteristic of having open opportunities for matriculation as well as a high dropout rate (Tangchuang and Mounier, 2010).
The expansion of higher education in Thailand can be divided into three stages. The first stage is the period from the establishment of Chulalongkorn University in 1917 to the establish-ment of the primary regional universities in 1969, and the opportunities for admission to
uni-Table 2 Summary of Universities in 2008
Types UniversitiesNumber of Total Number of Students new studentsNumber of Number of graduates
Public Universities 78 1,719,263 494,945 263,004 Rajabhat 40 508,212 150,718 107,657 Rajamangala 9 134,317 51,502 30,671 Public 27 557,382 171,388 98,576 OAUs 2 519,352 121,337 26,100 Private Universities 34 247,135 76,146 47,498 Total 112 1,966,398 571,091 310,502 Source : OHEC
versities during this time were limited to a portion of the elite. The second stage was from 1970 to 1989, when the spread of higher education progressed rapidly due to the opening of the OAUs and private universities. The third stage is the era spanning from 1990 to the present, in which Thailand has been approaching the popularization of higher education due to the trans-formation of Rajamangara and Rajabhat Institutes.
2.2 The Spatial Distribution of Universities in Thailand
Figure 3 shows the number of universities in each of Thailand’s 76 provinces, divided into public universities, private universities and satellite campuses. The time period when each university was founded was previously categorized into the three stages mentioned above5).
There are a total of 192 university campuses across all of Thailand (excluding the correspon-dence school STOU). There are 112 main campuses and 80 satellite campuses.
Figure 3 The numbers of campuses and the stages of the establishment of universities in each of Thailand’s provinces.
Four provinces opened universities during the first stage ; only one province opened uni-versities during the second stage, and 36 provinces opened uniuni-versities during the third stage. The remaining 35 provinces do not have any main campuses. Of these 35 provinces, 15 have satellite campuses. Although the opportunities to enter university spread in the 1970s and 1980s as mentioned above, the majority of private universities and RUs that were the driving force behind this are located in the BMA. The opportunities to enter universities are thus still considerably spatially biased toward the BMA. However, since the 1990s, the regional disparity in the opportunities to select a university has decreased due to the creation of main campuses in rural regions (mainly by RUs and RUTs).
As a result, many of the provinces in rural regions have one main campus of a public uni-versity and some satellite campuses.
3. The Migration of University Students 3.1 Data Sources
In this section, spatial structures of the movement of university students are analyzed based on data providing the birthplaces of the undergraduate students and their first place of employment. The data are the results of a questionnaire survey that was conducted by the OHEC, distributed to the graduates of undergraduate programs throughout Thailand in 2009. The data contain the information of 220,000 students who moved from their homes to enroll in a university and 140,000 students who moved after they graduated. The survey was not completed by all of the undergraduate students in Thailand, and it lacked the data of some universities such as Khon Kaen University. In the case of STOU, it was not possible to con-firm the actual movement of students because STOU has many learning centers around the country. STOU was thus excluded from this analysis. Moreover, all 76 provinces were included among the potential birthplaces and places of work, but the locations of university campuses were limited to 46 provinces.
3.2 Spatial Patterns of Students’ Movement When Entering a University
I analyzed the movement sphere for advancing to university by using the preference index of migration (PI). The PI was processed by excluding the influence of the size of the popula-tions in the areas of arrival and departure (Otomo 1996). The PI can be obtained using the fol-lowing formula, based on the number of students advancing into higher education in each of the provinces. PIij= P2 PiPjM Mij #100
Mij: the number of students who moved (going on to university from i province to j
Pi: the population in i province
Pj: the population in j province
P : the total population of Thailand
M : the total number of students who moved to enroll in a university
The PI shows the difference between the actual number of movements and the anticipated number of movements, weighted on the population size between each pair of provinces. Thus, if the PI exceeds 100, the movement was larger than the anticipated movement based on the population size of the two provinces. If the PI is less than 100, the number of moving students is not as high as anticipated. It is also possible to understand the direction of regional move-ments for entering universities by using the PI.
Table 3 provides an outline of students’ movement to enter a university for the entire country. Of the approx. 220,000 individuals who enrolled in a university in Thailand in 2009, 90,000 entered universities in the BMA. This exceeds 42% of the total. Of the 90,000 entrants, slightly more than 30,000 were from the BMA, and the remaining 60,000 were indi-viduals who moved into the BMA from other provinces. A total of 50,000 people from the 75 provinces other than the BMA entered an institution of higher education in their own prov-inces. This corresponds to 23% of the total number of people beginning their higher educa-tion. This is one of the important characteristics of the movement of students who are con-tinuing their education at a university. However, the percentages of people entering a university in their own province differ widely among the provinces, ranging from 0.3% in Suphan Buri Province to 72% in Chiang Mai Province. There appear to be no uniform features for entering a university in one’s own province.
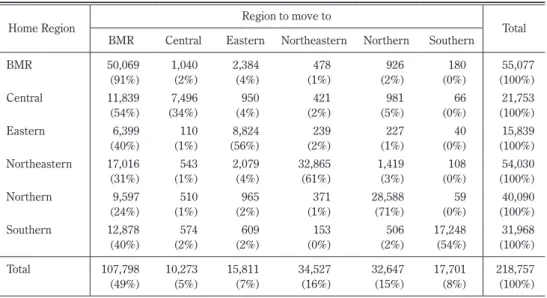
The movement between regions for enrolling in a university can be consolidated, as has been done in Table 4. The 50,000 people who correspond to 91% of the people from the Bang-kok Metropolitan Region (BMR) advanced to a university within the BMR. For individuals liv-ing in other regions, enrollliv-ing at a university in the BMR is a major movement. Hardly any movement is seen between the regions other than the BMR. In addition, the percentage of
Table 3 Number of Moved Students Entering University, by Province in 2009 Destination Provinces The number of new students %
moved to BMA 92,724 42.4%
Who were born in BMA 33,091 15.1%
Who moved when Entering 59,633 27.3%
moved in own province 50,900 23.3%
moved to other provinces 75,133 34.3%
Total 218,757 100.0%
individuals advancing to higher education within the region varies depending on the region. For example, there are more students from the Central Region who advance to a university in the BMR than those who go to a university within the Central Region. This is thought to be because it is easy to move to the BMR, and because there are not many main campuses of uni-versities within the Central Region compared to the other regions, except for RUs and RUTs. Next, the relationship between the regions where the PI exceeds 100 for the advancement to a university is shown in Table 5. There were 599 cases in which the combination of provinces resulted in a PI that exceeded 100. These PI cases showed similar trends, with large popula-tion outflows from the Northeastern, Northern, and Southern Regions to the BMR. However, the PI representing the outflow from the Central Region is much larger than the real number of movements. Similarly, the inflow to the Eastern Region is different from the real number of movements. The real number of movements to the Eastern Region is only 7% of the total number of movements for the country, and half of those movements were by people within the Eastern Region. On the other hand, the PI calculation shows an influx of people to the East-ern Region that is greater than the scope of the population. This indicates that the EastEast-ern Region has many opportunities for higher education. Almost all of this movement to the East-ern Region shows movement to Chon Buri Province. Burapha University, in Chon Buri Prov-ince, accepts many of these students, and this characterizes the movement into the province.
In addition to some cases in the Northern and Central Regions that have high PIs within their own provinces, there are many provinces that have high indicators with the adjoining regions. Movements that are greater than the scope of the populations have been confirmed
Table 4 Regional Movement for Entering Universities
Home Region Region to move to Total
BMR Central Eastern Northeastern Northern Southern
BMR 50,069 1,040 2,384 478 926 180 55,077 (91%) (2%) (4%) (1%) (2%) (0%) (100%) Central 11,839 7,496 950 421 981 66 21,753 (54%) (34%) (4%) (2%) (5%) (0%) (100%) Eastern 6,399 110 8,824 239 227 40 15,839 (40%) (1%) (56%) (2%) (1%) (0%) (100%) Northeastern 17,016 543 2,079 32,865 1,419 108 54,030 (31%) (1%) (4%) (61%) (3%) (0%) (100%) Northern 9,597 510 965 371 28,588 59 40,090 (24%) (1%) (2%) (1%) (71%) (0%) (100%) Southern 12,878 574 609 153 506 17,248 31,968 (40%) (2%) (2%) (0%) (2%) (54%) (100%) Total 107,798 10,273 15,811 34,527 32,647 17,701 218,757 (49%) (5%) (7%) (16%) (15%) (8%) (100%) Source : OHEC
for the movement of students entering from the Southern to the Central Region and from the Central to the Northern Region. High PIs from the Southern Region to the Central Region were observed for Prachuap Khiri Khan Province and Phetchaburi Province in the Central Region, and both of these provinces are adjacent to the Southern Region. The movement from the Central to the Northern Region has a high PI for moving to Phitsanulok Province and Chi-ang Mai Province. This result is thought to be due to the famous public University located in these provinces, i.e., Naresuan University and Chiang Mai University, and to the fact that both of these provinces have two major cities in the Northern Region.
The movements for entering universities in the Northeastern Region and Southern Region are characterized by movements within each region. In both regions, movements are active within their own regions, and the amount of population influx from other regions is extremely small compared with the scope of their populations. Both of these regions have universities which provide higher education for students living in their own regions.
The following two points have become clear from the above findings. The nationwide characteristics of movements for entering a university show two patterns : moving to begin higher education in the BMR (particularly the BMA), and moving within the home region. However, the inter-regional movements in rural regions are concentrated in an extremely
lim-ited number of provinces such as Chiang Mai.
3.3 Relationship between Migration Patterns and the Entrance Examination System
The percentages of individuals moving within the same province or same region are high in the rural regions of Thailand. This is thought to be a reflection of the characteristics of the country’s university entrance examination system. The entrance examinations for new stu-dents are conducted by several different methods. The two main methods are the nationally standardized entrance examination and the direct entrance examination6).
The direct entrance examinations consist of two basic types. One is the examination that
Table 5 Number of Provinces Where the PI Exceeds 100 for Entering a University
Home Region The Number of Provinces with PI>=100 Total
BMR Central Eastern North-Eastern Northern Southern
BMR 16 8 9 1 34 Central 37 23 18 1 22 101 Eastern 25 2 23 1 3 54 Northeasetern 33 3 29 42 7 114 Northern 37 8 24 84 153 Southern 36 18 13 4 72 143 Total 184 62 116 44 121 72 599
can be taken by anyone as long as they have the qualifications for the examination. The other is a quota examination that can be taken by only people who have fulfilled specific required con-ditions7). Each of the universities has its own unique ratio of new students via the direct
entrance examinations to the total numbers of the new students.
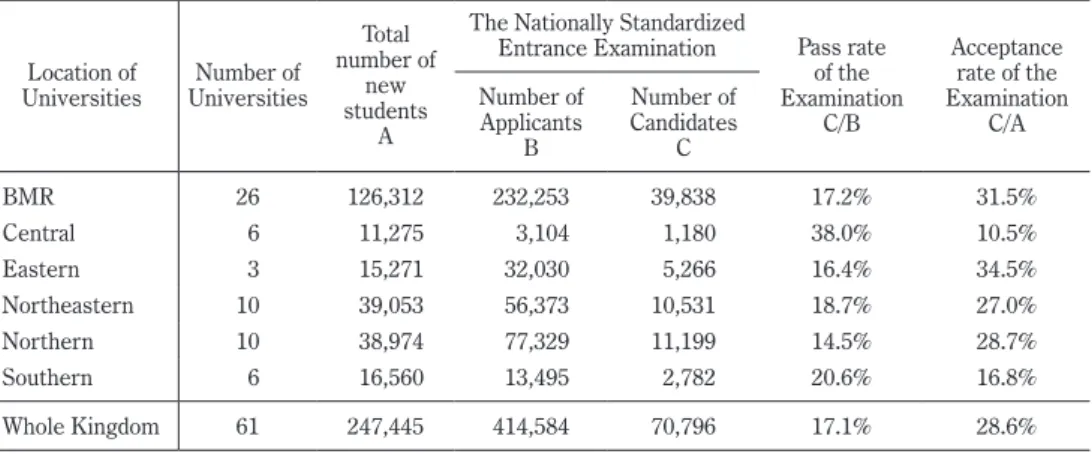
Table 6 shows the rate of new students who passed the national standardized examination to the total number of new students in 20108). There were only 61 universities for which the
results could be obtained for both the total number of new students and the number of students who took and passed the standardized examination. There was a total of 247,000 new students in 2010, but there were 414,000 applicants for the standardized examination and 70,000 people who passed it (17% ; a quite low pass rate). However, because the standardized examination takes place not at the university level but at the academic department level, the actual pass rates differ depending on the academic department, even among departments that are part of the same university. Moreover, it is presumed that the competition was not as intense as 17% because applicants can apply for up to four different desired academic departments at the same university.
Looking at the differences among the regions, the BMR has the highest acceptance rates from the standardized examination and the highest number of applicants and candidates. The competition was the intensest in the Northern Region, and the rate of successful applicants was the lowest at 14.5%. Also, the acceptance rate in the Central Region was low at 10%, but the rate of successful applicants was high at 38%. This is because there are no main campuses of public universities in the Central Region, and because there are not many universities that introduce the standardized examination.
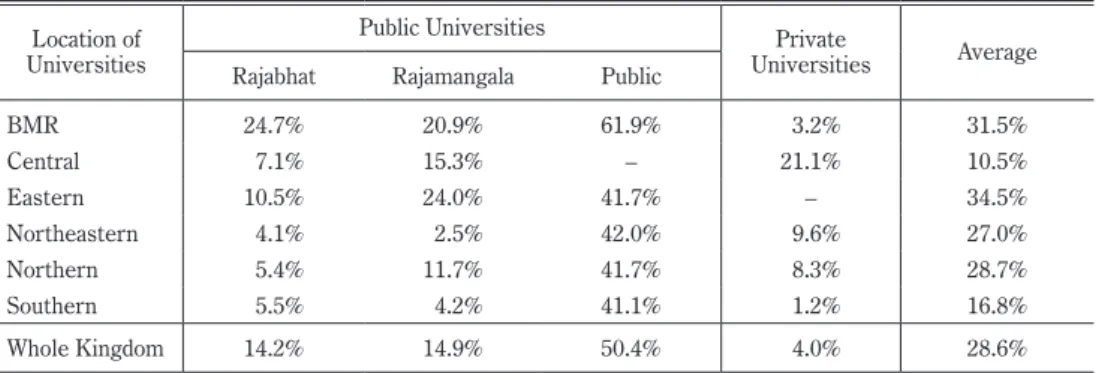
Table 7 provides a comparison of the acceptance rates from standardized examinations by university classification. The public universities use mainly the standardized examination.
Table 6 Number of New Students and Results of the Nationally Standardized Entrance Examina-tion in the 2010 Academic Year
Location of
Universities UniversitiesNumber of
Total number of
new students
A
The Nationally Standardized
Entrance Examination Pass rate of the Examination C/B Acceptance rate of the Examination C/A Number of Applicants B Number of Candidates C BMR 26 126,312 232,253 39,838 17.2% 31.5% Central 6 11,275 3,104 1,180 38.0% 10.5% Eastern 3 15,271 32,030 5,266 16.4% 34.5% Northeastern 10 39,053 56,373 10,531 18.7% 27.0% Northern 10 38,974 77,329 11,199 14.5% 28.7% Southern 6 16,560 13,495 2,782 20.6% 16.8% Whole Kingdom 61 247,445 414,584 70,796 17.1% 28.6% Source : OHEC
Even so, only 50% of the total number of new students was selected, and the remaining 50% of the students were selected by the direct entrance examination. In contrast, many of the RUs, RUTs and private universities do not use the standardized examination, but they do use the direct entrance examination. The direct entrance examination is important in rural regions, particularly in the Northeastern and Southern Regions, where only about 5% of students are selected by the standardized examination. In some of the private universities and RUs where the standardized examination is not used, entrance examinations have become meaningless, and as a result, almost all applicants are admitted (Ebihara, 2008).
In light of the above findings, the spatial patterns of students’ movements for entering a university are characterized by movement to enter an institution of higher education in the BMA (where there are many choices and the universities are concentrated), and the movement within the students’ own province or regions to enter an institution of higher education via the direct entrance examination and the quota examination.
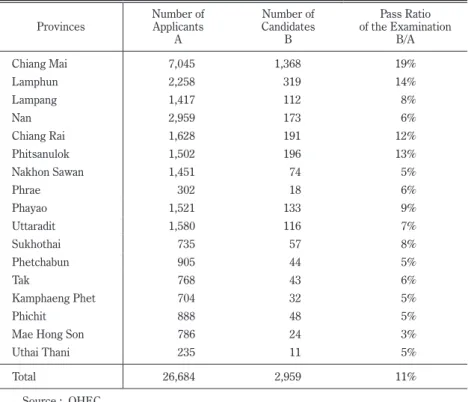
The details of the quota examination results are worthy of study. Table 8 shows the movements for entering Chiang Mai University, from which the quota examination data for 2009 were obtained. Chiang Mai University (in Chiang Mai Province) was opened as the first regional university in 1964. Some 36,000 students are enrolled there, and the number of undergraduates alone has risen to 27,000. There were 6,800 new students in 2009, and 2,900 of them were admitted by the quota examination. The people who were able to take the quota examination were limited to the graduates of high schools only in the 17 provinces in the North-ern Region. The results of selection by the quota examinations in 2009 are shown in Table 8. Although this examination was limited to students from the region, the competitive rate for this examination was higher than that for the standardized examination. This is likely due to the scholarship system for quota examination candidates. Moreover, the further away the stu-dent’s home province was from Chiang Mai Province, the lower the relative rate of the accepted candidates was. This can be viewed as a qualitative difference in education within the region. This is a system that was made equal to combat inequalities in educational opportunities, but it
Table 7 Acceptance Rate of the Standardized Examination in 2010
Location of Universities
Public Universities Private
Universities Average Rajabhat Rajamangala Public
BMR 24.7% 20.9% 61.9% 3.2% 31.5% Central 7.1% 15.3% – 21.1% 10.5% Eastern 10.5% 24.0% 41.7% – 34.5% Northeastern 4.1% 2.5% 42.0% 9.6% 27.0% Northern 5.4% 11.7% 41.7% 8.3% 28.7% Southern 5.5% 4.2% 41.1% 1.2% 16.8% Whole Kingdom 14.2% 14.9% 50.4% 4.0% 28.6% Source : OHEC
cannot be said that the system functions well.
3.4 Spatial Patterns of Movement for Entering the Workforce
Table 9 shows an outline of the movements of individuals entering the workforce among 142,575 graduates of undergraduate programs. The movements for jobs following university graduation are characterized by a concentration toward the BMA. The largest point of differ-ence in the movements for entering the workforce was the origins of the movement. Univer-sities are located in 46 of Thailand’s 76 provinces. A large amount of the movement to another province after university graduation was due to the movement of graduates back to their own provinces.
Approximately 50,000 graduates found employment in the BMA, and this is 35% of the total number of employed university graduates. Of these 50,000 graduates, the majority (35,000) were students who graduated from a university in the BMA. This comprises 25% of the total post-graduation movement, and this feature is similar to the movements for entering a
university. However, the 14,000 people who moved into the BMA from other provinces com-prise 10% of the total movement, and this is a relatively small amount compared to the number of people who moved into the BMA when entering a university. The BMA provides a large
-Table 8 Results of the Quota Examination for Chiang Mai University in 2009
Provinces Number of Applicants A Number of Candidates B Pass Ratio of the Examination B/A Chiang Mai 7,045 1,368 19% Lamphun 2,258 319 14% Lampang 1,417 112 8% Nan 2,959 173 6% Chiang Rai 1,628 191 12% Phitsanulok 1,502 196 13% Nakhon Sawan 1,451 74 5% Phrae 302 18 6% Phayao 1,521 133 9% Uttaradit 1,580 116 7% Sukhothai 735 57 8% Phetchabun 905 44 5% Tak 768 43 6% Kamphaeng Phet 704 32 5% Phichit 888 48 5%
Mae Hong Son 786 24 3%
Uthai Thani 235 11 5%
Total 26,684 2,959 11%
scale labor market that requires specialized professionals and people with high academic achievement. Many of the new members of workforce flowing into the BMA graduated from a university in the BMA or were university graduates who moved into the BMA to get a job, and the number of individuals who moved into the BMA upon graduating is small in comparison to the number of people who moved there to enter a university. It seems that individuals with high academic achievement are common in the BMA due to the abundance of educational opportunities that come from the concentration of universities there.
Although the number of Thai provinces where people can enroll in a university is limited to 46 the number of university graduates who went to work in their own provinces was approx. 33,000 (23% of the whole), and these individuals account for a large part of the movement for working, to the same degree as in the movement to enter a university. In addition, there were approx. 60,000 graduates who moved for work to provinces that were neither the BMA nor their own province. These movements were not concentrated in a specific province, and they have the characteristic of being decentralizing movements to a great number of provinces.
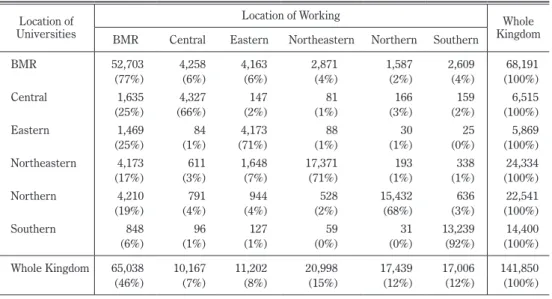
However, many of the movements, when looking only at the features of movements among regions, are movements within a region (Table 10). The largest movement pattern in all of the regions was the movement within a region. Even in the Central Region with the lowest rate of movement, 66% of the people moved within the region. Movement within a region can be considered more of a characteristic of moving for employment than movement to the BMR.
The largest location of employment for university graduates in the BMR is the BMR itself, but the percentage of BMR graduates who find work in the BMR is only 77%, which is small compared to the 91% who enter university there. In addition, the movements for employment in rural regions from the BMR is only about 5% of the total movement, but there are relatively large numbers of this movement that are to the Central Region, the Eastern Region, and the Southern Region. Thus, the amount of people who move from the BMR to these regions is greater than the number of people who move to the BMR for work from these regions. This finding revealed that the decentralizing movements to rural regions exceed the movements that concentrate the population in the BMR.
The various study majors offered by universities have a direct relationship with the labor
Table 9 Movements for Entering the Workforce in 2009
Direction of maximum movement Total Number of Graduates Working
Working in MBA 49,624
Graduated in MBA 35,219
Inflows from other provinces 14,405
Working at same province where graduated 33,256
Outflows to other provinces 58,970
Total 141,850
market, and the characteristics of the regions that employ mainly graduates of university departments of science and engineering differ from those of the regions that employ mainly graduates of programs in the humanities and social sciences9). Of the approx. 72,000 graduates
who moved for work from university humanities and social science departments such as busi-ness studies, management studies and education, approx. 32,000 (48%) work in the BMR. Of the approx. 29,000 graduates of university departments of science and engineering such as majors in technology, science and industrial technology, approx. 15,000 (57%) work in the BMR. There are more graduates who work in the BMR from departments of science and engineering than there are of graduates of humanities and social sciences programs.
Thailand’s Central and Eastern Regions have experienced large-scale industrial
develop-ment. In 2009 there were only 1,777 graduates of departments of science and engineering who attended a university in these two regions, but there were 4,961 graduates of science and engineering programs who were working in the two regions. Thus, the number of employed university graduates from departments of science and engineering greatly exceeds the number of graduates from the same regions, and accordingly, the influx of people from other regions is not small.
The PI can be used to determine the movement for employment upon graduating, with the same formula as that used to determine the movement for entering a university. By identify-ing the provinces that have an excessive influx of people (that is, more than the movement that is anticipated from PIs that exceed 100), it is possible to grasp the range of the supply of univer-sity graduates as workers in the labor market. Table 11 compiles the provinces with the PIs of
Table 10 Inter-regional Movements for Entering the Workforce
Location of Universities
Location of Working Whole
Kingdom BMR Central Eastern Northeastern Northern Southern
BMR 52,703 4,258 4,163 2,871 1,587 2,609 68,191 (77%) (6%) (6%) (4%) (2%) (4%) (100%) Central 1,635 4,327 147 81 166 159 6,515 (25%) (66%) (2%) (1%) (3%) (2%) (100%) Eastern 1,469 84 4,173 88 30 25 5,869 (25%) (1%) (71%) (1%) (1%) (0%) (100%) Northeastern 4,173 611 1,648 17,371 193 338 24,334 (17%) (3%) (7%) (71%) (1%) (1%) (100%) Northern 4,210 791 944 528 15,432 636 22,541 (19%) (4%) (4%) (2%) (68%) (3%) (100%) Southern 848 96 127 59 31 13,239 14,400 (6%) (1%) (1%) (0%) (0%) (92%) (100%) Whole Kingdom 65,038 10,167 11,202 20,998 17,439 17,006 141,850 (46%) (7%) (8%) (15%) (12%) (12%) (100%) Source : OHEC
100 or more for moving for work, by regions. There were 579 cases in which pairs of prov-inces had PIs of 100 or more for moving for work.
There were 101 pairs in which the PI exceeded 100 with regard to the movement from the BMR to other regions. In other words, many more graduates moved from the BMR to rural regions for work than would be expected from the values. In particular, there were many movements of graduates to the Central, Eastern and Southern Regions. Moreover, there were many cases of movement to other regions from the Northeastern and Northern Regions, exceeding what would be expected from the values. However, because there were also many cases of movement even within the Northeastern and Northern Regions exceeding the expected value, it can be said that movement upon graduation is more prominent than move-ment for entering a university.
In contrast, the number of pairs of regions in which the PI exceeded 100 for graduates who attended a university in the Central, Eastern, and Southern Regions is lower than the PI for individuals moving to enroll in a university, and thus regional decentralizing movements are not very prominent. Eighty percent of the pairs in which the PI exceeded 100 in the Southern Region are limited to movement within the region. Both the Central and Eastern Regions have prominent amounts of movement both to the BMR and within the regions.
In light of the above results, no recognizable movement pattern that concentrates people in the BMR (particularly the BMA) was seen in the movement for work, as there was for enter-ing a university. Rather, a decentralizenter-ing movement pattern is characteristic of the movement for work upon graduation. This characteristic shows a similar trend in the actual amount of movement among regions and in the relative amount of movement according to the PI. In addition, despite the fact that the post-graduation movement is limited to the 46 provinces
where universities are located, the higher amounts of movement within the regions suggest that there is a strong connection with the small range of the labor market in rural regions.
This makes it apparent that there is a demand for graduates who majored in science and
Table 11 The Number of Provinces Where the PI Exceeds 100 for Moving for Work
Location of Universities
The Number of Provinces with PI>=100
Total BMR Central Eastern Northeastern Northern Southern
BMR 16 36 26 11 11 17 117 Central 17 24 8 4 8 61 Eastern 11 2 19 1 33 Northeastern 26 15 25 55 5 126 Northern 36 23 20 3 80 9 171 Southern 9 2 2 58 71 Total 115 102 100 69 95 98 579
technology as workers in the BMR and the surrounding area where industry is concen-trated. Conversely, it has been surmised that graduates who majored in humanities and social sciences cannot expect many job opportunities, so they tend to stay in their home region. It is believed that one of the factors that keep these graduates in their home regions is that the sys-tem for the labor market for new graduates is not yet fully outfitted. According to Suehiro (1997), there is no customary practice of Thai businesses hiring new graduates. The employ-ment office of Thailand’s Ministry of Labor holds a monthly job meeting for new graduates from universities, vocational colleges and vocational high schools. However, there are not enough job opportunities provided for the number of recent university graduates.
4. Conclusion
The spatial patterns of the movement for entering universities and of the movement of university graduates for jobs at the national scale were analyzed. The main findings can be summarized as follows.
First, the concentration of the workforce of university graduates in Bangkok was remark-able. The main reason was that many graduates had come from rural regions to Bangkok to enroll in a university and they continued to stay in that area for a job after graduation. Accord-ingly, it is clear that the concentration of universities in the BMA contributes to the concentra-tion of graduated workers in the BMA.
Second, in rural regions, university graduates tend to stay in their own province for both attending a university and for a job. A large portion of the students who enter a university located in a rural province is comprised of local students. This trend is related to the entrance examination system. Many of the private universities, RUs and RUTs in rural regions select mainly local students based on the direct entrance examination. These educational institu-tions are a source of university graduates in rural regions.
Third, it became clear that with regard to moving after graduation to a job, employment in the graduate’s home province was prominent for graduates in the humanities and social science fields, whereas a portion of the graduates in the fields of science and engineering moved into the BMR and its surrounding areas from rural regions. This reflects a greater labor demand for university graduates of natural science and engineering programs in the BMR due to the agglomeration of many large industry-based companies there.
The attempts to create industrial job opportunities in rural regions and to utilize educa-tional institutions that have industrial departments for these jobs could help control the eco-nomic disparity among regions in Thailand.
Notes
1) The percentage of people attending a university is calculated as the rate of people attending universi-ties to the amount of people in the university age range (18-22 years old). It is possible that this estimated percentage is high because there are many students who are working adults.
2) Considering that compulsory education in Thailand began in 1922, it becomes apparent that higher education is considered important.
3) In particular, they existed as institutions to train government workers (Tangchuang and Mounier 2010).
4) Each of these nine universities has several satellite campuses around the country, and as of 2011, there are 45 satellite campuses.
5) The time when university status was obtained was taken to be after the enactment of the law that conferred the title of university on institutions. Because there is such a large number of educational institutions that were elevated to university status in Thailand, there are cases in which the establish-ment of the school itself is actually older.
6) The nationally standardized entrance examination takes the scores from the two types of nationwide examinations into account along with the student's high school record. The system for these exami-nations was established in the entrance examination reform of 2006.
7) The quota examination was established as a regional capacity framework to reduce inequalities in the opportunities for entrance into higher education.
8) The number of candidates who take the standardized examination and the number of new students do not coincide. The actual number of new students who passed the quota examination is unknown. 9) There are 322 unique titles of university departments and 1,050 university departments in the entire
country. Of these department titles, 38 titles that offer courses in more than five universities are analyzed herein. There are 690 programs under the umbrella of these 38 titles that are operating nationwide, and they account for approx. 70% of all of the university departments.
References (*in Japanese ; **in Thai)
Bhula-or, R. and Kripornsak, P. (2008) : Trends of labour demand for high-skilled workers and their wages in Thailand. Journal of International Business Research, 7, 71-87.
Ebihara, T. (2008) : New admission entrance examination system and department with necessity for
Japa-nese subject as for examination in Thailand : Case study of the nationally standardized entrance examination of higher educational institutions in 2007. Journal of Japanese Education in Japanese
Language Department in Japan Foundation, Bangkok, 5, 145-154.*
Kanethong, N., Kanchhanakitsakul, M., Prasartkul, P. and Satayavongthip, B. (2010) : Out- migra-tion from the Hometown Area of New Graduates of Naresuan University. Journal of Demography,
26(2), 15-26.
Morathop, N., Kanchanakitsakul, C., Prasartkul, P. and Satayavongthip, B. (2010) : Intention to
Work in One’s Hometown : Seniors at Naresuan University, Phitsanulok province. Journal of
Demography, 26(2), 1-14.
Muangkeow, S. (2009) : The challenges of creating and maintaining higher education quality under
condi-tions of rapid economic development in Thailand. In Bigalke T.W. and Neubauer D.E., eds. Higher
Education in Asia Pacific : Quality and the Public Good. 165-179, New York, Palgrave Macmillan.
Office of the Educational Council (2008) : Education in Thailand 2007. Bangkok.
Otomo, A. (1996) : Nihon Jinko Ido : Sengo ni Okeru Jinko no Chiiki Bunpu Hendo to Chiikikan Ido*
[Migration in Japan : Changing Population Structures and Interregional Migration after WWII]. Tokyo, Okurasho Insatsukyoku.
Oudin, X. (2010) : The Educational Progress of the Labour Force. In Mounier A. and Tangchuang P.,
eds. Education and Knowledge in Thailand : The Quality Controversy, 159-184, Chiang Mai, Silk-worm Books.
Srikatanyoo, N. (2007) : Internationalising Thai higher education institutions. ASAIHL-Thailand
Jour-nal, 10, 100-111.
Suehiro, A. (1997) : Changes in the Labor Markets and Personnel Management System in Thailand. Journal of Social Science, 48, 59-108.*
Suehiro, A. (2009) : Tai : Chushinkoku no Mosaku [Thai : Groping for Semi-Developed Country]. Tokyo, Iwanami Shoten.*
Sukhawatthanakun, K., Muangkot, T., Wongpangson, K., Kultangwattana, W. and Promnanuritte, K. (2010) : Factors influencing university selection of grade 12 students in the upper northeastern
region of Thailand. Kasetsart Journal (Social Science), 31, 307-318.**
Tangchuang, P. and Mounier, A. (2010) : Higher education : Towards an education market? In Mounier
A. and Tangchuang P., eds. Education and Knowledge in Thailand : The Quality Controversy. 91-107, Chiang Mai, Silkworm Books.
Wiboonchutikula, P. (2009) : Industrial performance and policies in Thailand. In Chirathivat S. and Yuen