Journal of Mechanical Systems
for Transportation
and Logistics
Copyright © 2013 by JSME
Abstract
We have developed a new driving assistance system that can help low-skilled drivers improve their driving skills. We did this in three steps. First, we developed a statistical method to extract distinctions between high- and low-skilled drivers on the basis of AdaBoost, which selects a small number of critical operation features between high- and low-skilled drivers. Second, we built a driving skill evaluation model on the basis of the extracted features. Finally, we performed a series of experiments using a driving simulator, in which advice based on extracted features was supplied to low-skilled drivers and was expected to improve their driving skill. We also proposed an index for evaluating driving skill change, and results show the advice effectively improved the drivers’ driving skills.
1. Introduction
Driving skills are very important for drivers to determine how safely they drive, how much fuel they consume, and even how comfortable they feel while driving. Because accidents and fuel consumption are the most serious traffic problems, many advanced information communication technologies have recently been introduced to improve infrastructure such as ETC, or provide traffic information to reduce traffic jams. However, driving skills also need to be improved for driving safety and fuel consumption. Researchers found fuel consumption can be improved by 10-30% if drivers drive in eco mode (1) or drive much more calmly (2). In this paper, we propose a new driving assistance system for improving driving skills.
One way to improve driving skills is to supply effective advice to low-skilled drivers. To advise low-skilled drivers effectively, we developed a statistical method to extract distinctions between high- and low-skilled drivers from a huge database obtained via telematics. Using telematics, we can organize floating car data in an information centre, and after data processing, traffic information is sent to terminal units such as a car navigator or even smartphones. The spread of such systems creates a huge database in the information centre, which the proposed method can access to extract the driving features shared by most high-skilled drivers.
Many researchers have focused on drivers’ skills in recent years (3)(4)(5)(6)(7)(8).For
Vol. 6, No. 2, 2013
Driving Feature Extraction from High and Low
Skilled Drivers in Curve Sections Based on
Machine Learning*
Shuguang LI**, Shigeyuki YAMABE**, Yoichi SATO**,
Takayuki HIRASAWA**, Yoshihiro SUDA**, Naiwala P. CHANDRASIRI***
and Kazunari NAWA***
Key words: Driver Behaviour, Machine Learning, Driving Simulator, Driving Skill
** Institute of Industrial Science, the University of Tokyo 4-6-1, Mego-ku, Tokyo, 153-8505, Japan
E-mail:[email protected]
*** Toyota Info Technology Center Co. LTD, Japan 6-6-20 Akasaka, Minato-ku, Tokyo, 107-0052, Japan
*Received 15 Mar., 2013 (No.13-0130) [DOI: 10.1299/jmtl.6.111]
and Logistics
example, Germaine L. Odenheimer et al. have focused on elderly drivers' skills (3). They proposed a method to evaluated drivers safety, reliability, and validity. Susan A. Ferguson et al. tried to find out the high-risk factors for young drivers (4). In the research of TADA, Masahiro et al. analysed steering control behavior using 3D-accelerometers (5). They found some unnecessary behaviors existed among novice drivers by comparing their driving videos with those of skilled drivers. Yamada et al. introduced their study on measurement and evaluation of novice driving ability (6).
Many important factors about drivers' skill have been discovered. Researchers have introduced jerk, which is the derivative of acceleration with respect to time, as a criterion to determine a driver’s status. Murphy et al. have shown that less fuel is consumed and safety is also improved if a vehicle moves smoothly, which means a relatively smaller jerk (2). Motivated by their research, we adopt jerk and average speed as effective means of defining a driver’s skills in our research. Zhang et al. have also tried to use driving skills to adapt vehicle control parameters to facilitate a specific driver’s needs in terms of vehicle performance and safety (7). They found out that the Discrete Fourier transform (DFT) coefficients of the steering wheel angle were very different depending on the drivers’ skill levels and then used these coefficients as discriminant features to construct a driving skill recognizer via pattern recognition algorithms. Their paper suggested that the frequency characteristics of the drivers’ operations were very different due to driving skill. However, the DFT coefficients merely reflect the average global characteristics, and the effect of the locations at which the operational features appeared was not considered. We therefore use wavelet transform in the proposed method so that we can obtain different frequency components of driving operations corresponding to locations. The extracted result can then show where and how the skilled drivers’ operation characteristics tend to appear. This is key in terms of supplying effective advice to low-skilled drivers.
In the proposed method, the strategy is to create a database, prepare candidate features, and finally extract features. To obtain the necessary data, we performed a series of experiments using a driving simulator and established a feature extraction method on the basis of the collected database. First, high- and low-skilled groups were defined as training data by using average speed and composed jerk. After that, a large number of candidate features derived from driving operations were prepared and input into an AdaBoost algorithm, (9) which is a machine learning algorithm. Finally, a small number of critical features to differentiate the two groups were automatically extracted.
A driving skill evaluation model is also built at the same time that is based on extracted features by AdaBoost. When a driver finishes a lap, we can determine whether the driver is high or low skilled by comparing the collected data with the evaluation model. Furthermore, if a driver was determined to be low skilled, we can find out the most obvious difference between him and a skilled-driver by comparison with the classify mode. In this paper, the accuracy of the model is validated using the leave-one-out cross-validation method.
Finally, we performed a series of experiments using a driving simulator, in which advice based on extracted features was supplied to low-skilled drivers and was expected to improve their driving skills. We also developed an index for evaluating driving skill change, and results show the advice was effective for improving drivers’ driving skills. The experiments and results are described in detail in the following sections.
2. CONCEPT OF NEW DRIVING ASSISTANCE SYSTEM
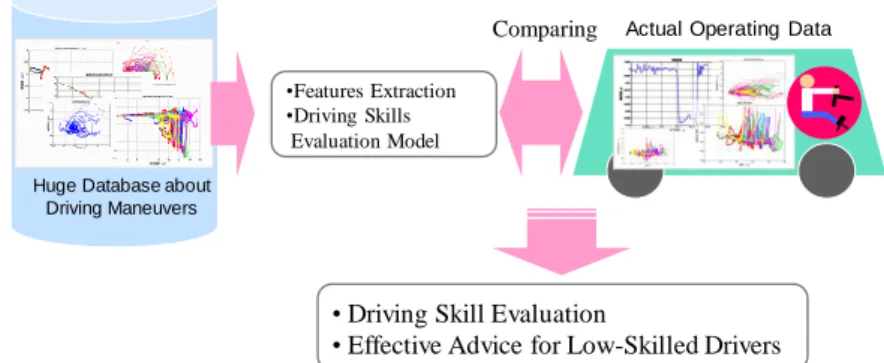
The concept of our new driving assistance system is shown in Fig. 1. First, a large number of candidate features for driving operations are prepared by a huge database obtained by a telematics service. After that, distinctions between high- and low-skilled drivers are extracted using a proposed statistical method based on AdaBoost. At the same time, a driving skill evaluation model is built by using a combination of extracted features
Journal of Mechanical Systems
for Transportation
and Logistics
and corresponding thresholds. By comparing the actual operation with the evaluation model, drivers’ skills could be determined and effective advice supplied to low-skilled drivers.
Huge Database about Driving Maneuvers
•Features Extraction •Driving Skills
Evaluation Model
Actual Operating Data
Comparing
• Driving Skill Evaluation
• Effective Advice for Low-Skilled Drivers
Fig. 1. Concept of driving assistance system
3. DRIVING FEATURE EXTRACTION
3.1 Driving Feature Extraction Algorithm
In working towards to build the new driving assistance system, Li etc. have proposed a driving feature extraction algorithm (10). The flowchart of the proposed feature extraction method is shown in Fig. 2. First, we obtained driving data by experiments using a driving simulator and as data preprocessing all laps were defined as high and low skilled groups (Fig. 2(a)). Next, we introduced wavelet transform to analyze the frequency characteristics of the driving operations. In general, high-skilled drivers drive smoothly while low-skilled ones are more wobbly. In other words, their operating frequency is different even at the same location. Therefore, to compare the operation characteristics between laps, driving operation data including steering angle, accelerator, and brake pedal position, along with the corresponding operating speed, were decomposed into different frequency components by wavelet transform (Fig. 2(b)). However, it was still difficult to compare between laps using time history data because the average speed of each lap is different. We therefore normalized all decomposed data by distance so that we could compare operation at the same location between laps (Fig. 2(c)). In the next step, a large quantity of candidate features was produced by adding a sub-windows function to the most relevant frequency components so that the candidate features could reflect variations of drivers’ operations in a short period (Fig. 2(d)). Finally, we extracted some driving operation features of high- and low-skilled drivers (Fig. 2(e)).
Vol. 6, No. 2, 2013
Time t Driving Operation Data
Low Skilled High Skilled time t … Time t … … … T rai n in g Data Grou ps (N
-laps driving data
) Time t time t … Time t … … … Wavelet Transform 10Hz 5Hz 2.5Hz ...Hz 10Hz 5Hz 2.5Hz ...Hz T rai n in g Data Gro u ps (N -laps drivi ng data )
and Logistics
Distance d distance d … Distance d … … … Feature Extraction 10Hz 5Hz 2.5Hz ...Hz 10Hz 5Hz 2.5Hz ...Hz Var. Name+ Location+Threshold T rai n in g Data Grou ps (N -laps dri ving dat a )(e) Feature extraction by AdaBoost
Fig. 2 Proposed Algorithm of Characteristics Extraction
3.2. Experiment for Feature Extraction
All experiments were performed using a driving simulator equipped with a 6-DOF motion platform (Fig. 3). The three screens and projectors offered drivers a 140 degree field-of-view.
(a) Driving simulator
300m 300m 300m S R=200 IA=45° R=50 IA=90° R=100 IA=90° R=200 IA=90° R=100 IA=45° R=50 IA=45° 300m E 300m 300m 300m
(b) Experiment scenario (c) Experiment course Fig. 3 Experiment Conditions
Distance d distance d … Distance d … … … Normalization T rai n in g Data Grou ps (N -laps dri ving dat a ) 10Hz 5Hz 2.5Hz ...Hz 10Hz 5Hz 2.5Hz ...Hz D Distance d distance d … Distance d … … … Window Function 10Hz 5Hz 2.5Hz ...Hz 10Hz 5Hz 2.5Hz ...Hz ∑L ― ∑R T rai n in g Data Grou ps (N
-laps driving data
)
Journal of Mechanical Systems
for Transportation
and Logistics
3. 3. Definition of Training Data
Because AdaBoost is a machine learning algorithm, its training data must be defined in the data pre-processing. Driving skill definition is not simple. A different definition can arise from a different viewpoint. In this study, we defined high- and low-skilled groups using a summation of the composed jerk and average speed. Here, we introduce the parameter J, which is the integrated value of the composed jerk:
N i lateral i longitude i JJ
J
1 2 2 (1)Where and function as the i-th sample of normalized lateral and longitude jerk, respectively, and N is the total number of the normalized jerk samples from the start point to the end.
The basic concept of our definition is that if two laps have an equal average speed, the lap with the smaller J is selected as the more highly skilled. As an example, a definition for curve 1 is shown in Fig. 4, where the x-axis is the average speed and the y-axis is J. We used a regression line to separate all laps into two groups: low-skilled (upper) and high-skilled (lower). We then focused on laps that scatter close to the regression line—i.e., those ambiguously between high- and low-skilled—and labeled them as “middle”. In this study, 20 percent of the total was not used in training data because they fell into this middle category.
Fig. 4 Definition of high- and low-skilled driving
3. 4. Candidate Features
As shown in Fig. 5, two types of parameters (operation and vehicle state quantity) were selected as candidate features. Operation data that include steer angle, accelerator, and brake pedal position, steering speed, and accelerator and brake operating speeds were used to determine candidate features after being decomposed into different frequency components by Wavelet Transform. Vehicle state quantities that include velocity, distance departure from centerline, longitude jerk, and lateral jerk were determined as candidate features without frequency analysis. • Steer Angle • Accelerator Pedal Position • Brake Pedal Position • Steer Operation Speed • Accelerator Operation Speed • Brake Operation Speed Operation Candidate Features • Velocity • Distance from Centerline (Dis) • Longitude Jerk • Lateral Jerk Quantity of State Decompose by Frequency Without Decomposition
Fig. 5 Variable for Creating Candidate Features
J
longitude-iJ
lateral-iand Logistics
3. 5. Results of Feature Extraction
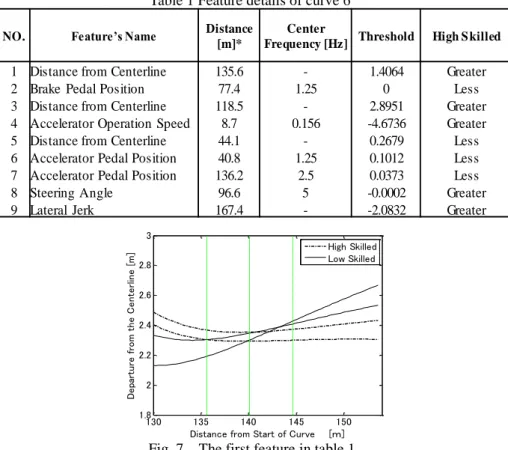
The result of the sixth curve is used as an example to introduce extracted features. Fig. 6 shows places where features appeared, and the details of features are listed in Table 1. For example, the first feature was extracted at 135.6m away from the start point of curve, and it was about distance from centerline which indicated location or trail of vehicle on the road. High skilled drivers tended to own a greater value than threshold which means high skilled drivers moved close to the centerline at the exit of curve while low-skilled drivers drove toward the roadside as shown in Fig 7. Similarly, features 1st, 3rd, and 7th appeared at the end of the curve, while features 5th and 6th are at the entrance of the curve. This suggested the difference between the high- and low-skilled groups was obvious at the end/entrance sections of curve. Specifically, distance departure centerline is extracted in both sections. High- and low-skilled drivers have very different strategies when driving through the curve.
Fig. 6 Features appeared place Table 1 Feature details of curve 6th
NO. Feature’s Name Distance
[m]*
Center
Frequency [Hz] Threshold High S killed
1 Distance from Centerline 135.6 - 1.4064 Greater
2 Brake Pedal Position 77.4 1.25 0 Less
3 Distance from Centerline 118.5 - 2.8951 Greater
4 Accelerator Operation Speed 8.7 0.156 -4.6736 Greater
5 Distance from Centerline 44.1 - 0.2679 Less
6 Accelerator Pedal Position 40.8 1.25 0.1012 Less
7 Accelerator Pedal Position 136.2 2.5 0.0373 Less
8 Steering Angle 96.6 5 -0.0002 Greater
9 Lateral Jerk 167.4 - -2.0832 Greater
130 135 140 145 150 1.8 2 2.2 2.4 2.6 2.8 3
Distance from Start of Curve [m]
D e pa rt u re f ro m th e C e n te rlin e [ m] High Skilled Low Skilled
Journal of Mechanical Systems
for Transportation
and Logistics
4. ACCURACY of DRIVING SKILL EVALUATION MODEL
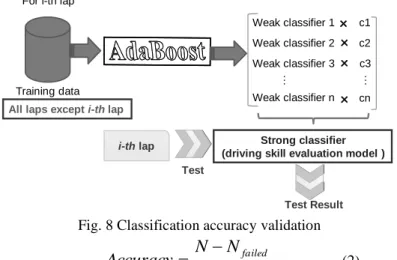
A driving skill evaluation model was also built using driving features extracted by AdaBoost. To validate the accuracy of the model, the leave-one-out cross-validation method was adopted. As shown in Fig.8, for i-th lap, data of all laps except i-th were used as training data. As soon as the evaluation model was built, i-th lap was compared with the model as test data, so we could find out whether the model determined it correctly or not. After all laps were tested, the accuracy of the model could be calculated using equation (2), where N is the total number of laps and Nfailed is the number of laps which wasn't correctly
classified.
For i-th lap
Weak classifier 1 Weak classifier 2 Weak classifier 3 … Weak classifier n × × × × c1 c2 c3 … cn Strong classifier (driving skill evaluation model )
Training data
All laps except i-th lap
i-th lap
Test
Test Result
Fig. 8 Classification accuracy validation
N
N
N
Accuracy
failed (2)The accuracy of the driving skill evaluation model is shown in Fig. 9. Almost 70~80% is achieved for each curve and it would be improved if N was increased. The lowest is the 5th curve, which is the hardest, because both high- and low-skilled drivers had difficultly navigating the curve. Therefore the difference is not very clear. This is why the accuracy is the lowest among the curves.
Fig. 9 Accuracy of driving skill evaluation model
5. ADIVCE EXPERIMENTS
5. 1. Drivers Selection
We performed a series of experiments in which advice based on extracted features was supplied to low-skilled drivers. Drivers were selected on the basis of the experiment described in 3.1. Drivers 1, 3, 5, 7, 9, 10, 11, 12, 14, and 15 were selected to participate in the advice experiments. Each driver had driven 10 laps in the previous experiment. In addition, the high and low-skilled laps were determined in accordance with the definition described in chapter 3.3. Thus, in accordance with the distribution each driver's high- and low-skilled laps, we can obtain the drivers' skill levels. For example, as shown in Fig. 10, drivers 1, 7, and 10 were defined as low-skilled drivers because most of their laps were defined as low-skilled laps. The other drivers were defined as mid-level.
A
cc
u
rac
y
Curve No.
N=127 N=128 N=126 N=128 N=128 N=127 Vol. 6, No. 2, 2013and Logistics
5. 2. Experiment Pattern
Experiments were performed on the DS in Fig. 3. All drivers were allowed to do three practice laps first to become used to DS operation, and then they did 15 laps and 1 lap of free driving as shown in Table 2. After that, drivers drove 10 laps while receiving advice. Again they did 1 lap of free driving. Since advice would have been interfered with their free diving, the free driving lap was used to evaluate the effect of advice. Next, they drove the last lap after doing one skilled lap. Ten drivers were divided into two groups: drivers 1, 5, 12, 14, and 15 in one group, and the rest in the other group. The order of experiment patterns for each group was different. The orders were (A -> B -> C ->D->E) for the former group and (A -> C -> B ->D->E) for the latter group.
In pattern B experiments, sketch map in Fig. 11 was shown to drivers first and characteristic difference between the high and low skilled drivers was also explained at each location. All advices were supplied orally before drivers drove into the curve. Considering a long conversation would bother drivers' behavior, we appointed a brief rule beforehand. Since it happened to be only two types of features (which were selected by special rules and would be described in following section), one was about distance to the centerline and the other was about steering operation, so the advices were shorted as "Take care of trail in the following curve" or "Take care of steering operation in the following curve " (for pattern C). And the detail of the advices, which was also listed in table 3, was instructed while showing the sketch maps. Pattern C was carried out similarly.
Table 2. Experiment patterns
Pattern Content laps
A Free travel 3
B Driving following advice 5
C Driving following advice 5
D Free travel 1 Driver 1 Driver 5 Driver 7 Driver 11 0 2 4 6 8 10
cur 1 cur 2 cur 3 cur 4 cur 5 cur 6
Driver 3 0 2 4 6 8 10
cur 1 cur 2 cur 3 cur 4 cur 5 cur 6
Driver 9 0 2 4 6 8 10
cur 1 cur 2 cur 3 cur 4 cur 5 cur 6
Driver 10 0 2 4 6 8
cur 1 cur 2 cur 3 cur 4 cur 5 cur 6
Driver 12 0 2 4 6 8
cur 1 cur 2 cur 3 cur 4 cur 5 cur 6
Driver 14 0 2 4 6 8
cur 1 cur 2 cur 3 cur 4 cur 5 cur 6
Driver 15 0 2 4 6 8
cur1 cur2 cur3 cur4
0 2 4 6 8
cur1 cur2 cur3 cur4
High-skilled Low-skilled No .o f la p s No . o f la p s No .o f la p s No .o f la p s No .o f la p s No .o f la p s No .o f la p s No .o f la p s No .o f la p s No .o f la p s 0 2 4 6 8
cur 1 cur 2 cur 3 cur 4 cur 5 cur 6
0 2 4 6 8
cur 1 cur 2 cur 3 cur 4 cur 5 cur 6
0 2 4 6 8 10
cur 1 cur 2 cur 3 cur 4 cur 5 cur 6
0 2 4 6 8
cur 1 cur 2 cur 3 cur 4 cur 5 cur 6
Journal of Mechanical Systems
for Transportation
and Logistics
E Driving after experience skilled lap 1
This section describes details of Pattern B. Fig. 11 shows the sketch Map for Pattern B. Three curves including curves 1, 4, and 6 were selected as target curves in which advice was supplied to drivers. Advice for Pattern B is listed in Table 3. All advice corresponds to the first features (reference Table 1) of each curve, which were taken as the most obvious differences between high- and low-skilled drivers. Advice was always the same: drivers should move close to the centerline as soon as possible at the exit of each curve,
Fig. 11 Sketch map for Pattern B Table 3 Advice for Pattern B Curve Advice
1 At the exit of curve, move close to the centerline as soon as possible 4 At the exit of curve, move close to the centerline as soon as possible 6 At the exit of curve, move close to the centerline as soon as possible
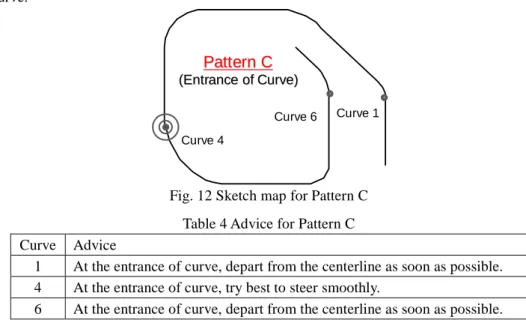
The sketch map and advice for Pattern C are shown in Fig. 12 and Table 4. Advices are corresponding to most close to the entrance of each curve. For curves 1 and 6, we suggested to drivers that they depart from the centreline as soon as possible at the entrance of the curve. For curve 4, we advised drivers to try their best to steer smoothly at the entrance of a curve.
Pattern
Pattern
C
C
(Entrance of Curve (Entrance of Curve)) Curve 1 Curve 4 Curve 6Fig. 12 Sketch map for Pattern C Table 4 Advice for Pattern C Curve Advice
1 At the entrance of curve, depart from the centerline as soon as possible. 4 At the entrance of curve, try best to steer smoothly.
6 At the entrance of curve, depart from the centerline as soon as possible.
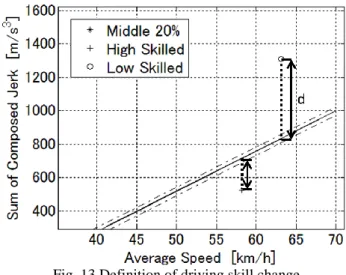
5. 3. Index for Evaluating Driving Skill Change
To evaluate the change in driving skills, we introduce parameter d as shown in Fig. 13.
and Logistics
Fig. 13 Definition of driving skill change
The regression line of average speed and sum of composed jerk in experiments described in chapter 3.3 is adopted as a criterion (reference fig. 4). The offset from the regression line was denoted as d, which was applied to represent the change in driving skills. For a high-skilled lap, d must be minus, while for a low-skilled lap, it must be a positive value. The bigger the d, the lower is the skill.
5. 4. Experiment Results
By comparing Patterns B and C, we learned where was best to supply advice. Fig. 13 shows the results of Patterns B and C. X-axis is targeted curves. Y-axis is the average of d for 10 drivers. Since each driver finished five laps for both Patterns B and C, the total number of sample laps is 50. As shown in Fig 14, for all of the three curves, the averages for Pattern C tend to be smaller, which means relative higher skills achieved in the experiments. Particularly, due to the two groups and different experiment orders, the training effect is equitable for both Patterns B and C. For this reason, the difference is caused by different advice. Therefore, it is better to supply advice at the entrance of a curve.
To confirm the change in driving level after advice, we compared the average of d between experiments in chapter 3.3 and chapter 5.2. Since all drivers finished five laps of Patterns C and B independently before the 14-th lap, the 14th lap is the sample that can best reflect the change in driving skills attributable to advice. We use the 14-th lap of all drivers as samples. Again, another important problem is to choose the proper criterion to describe drivers' driving skill before advice. The criterion must reflect a drivers' driving level as accurately as possible, particularly avoid the training effect. We use the average d of 10 laps in the experiment described in chapter 3.3 as such a criterion. It is must be emphasized that
20
40
60
80
100
A
ve
ra
ge
o
f
d
Pattern B
Pattern C
-40 -35 -30 -25 -20 -15 -10 -5 0 5 10 15curve 1 curve 4 curve 6
Pattern B (N=50) Pattern C (N=50)
Journal of Mechanical Systems
for Transportation
and Logistics
As shown in Fig. 15 most drivers' driving skills were greatly improved. Among 60 samples, in 43 pairs, the 14-th laps have a smaller value of d than the 10-laps average last year. For example, most laps last year were defined as low skilled for driver 1. However, all curves improved greatly except curve 5, which is the hardest. In the same way, the driving skills of driver 5 also improved greatly, except for at curve 1, which has the same radius as curve 5. Therefore, low-skilled drivers’ driving skills could be improved greatly, especially by supplying good advice at the entrances of curves.
We also checked the track variation for laps after advice. We take the result of curve 1 by driver 10 as an example in which driver had succeeded to improve driving skill following the result in Fig. 15. The real line in Fig.16 indicates the 10-laps average value of distance from the centerline, while dot line shows the lap after advice (14th-lap in Fig.15). It is clearly indicated that driver had departed from the centerline as soon as possible at the entrance as well as moved close to the centerline as soon as possible at the exit of curve. Therefore, driver was closing to the roadside in the middle section of the curve which means a relative bigger radius for the trait, or a trait rather flat. This is the reason why the summation of the composed jerk for 14th-lap would be smaller. Obviously, driver could return the center of road easier at the exit of the curve by such trait. Conversely, an example is curve 1 by driver 5 which failed to improve driver's skill. Fig. 17 shows the trait variation. The trait for lap after advice which is denoted by dot line shows that driver did not follow the advice very well. If he had departed from the centerline much more at the entrance of the curve, he could get a better record. In conclusion, drivers' skill could be improved if they following the advices well.
Vol. 6, No. 2, 2013
drivers were driving freely for the 10-laps in that experiment, and furthermore 10-laps were enough to reflect a drivers' skill. So it is reasonable to take the average value as drivers' driving skill before advice experiments or driving skill without advice. Fig 15 shows the results of experiments with advice.
0 20 40 60 80 100
curve 1 curve 4 curve 6
A ve ra ge o f d Pattern B Pattern C 0 20 40 60 80 100
curve 1 curve 4 curve 6
A ve ra ge o f d Pattern B Pattern C 0 20 40 60 80 100 curve 1 curve 4 A ve ra ge o f d Pattern B Pattern C 0 20 40 60 80 100 curve 1 curve 4 A ve ra ge o f d Pattern B Pattern C 0 20 40 60 80 100
curve 1 curve 4 curve 6
A ve ra ge o f d Pattern B Pattern C 0 20 40 60 80 100
curve 1 curve 4 curve 6
A ve ra ge o f d Pattern B Pattern C Driver 1 Driver 5 Driver 7 Driver 3 Driver 9 Driver 10 -150 -100 -50 0 50 100
cur 1 cur 2 cur 3 cur 4 cur 5 cur 6 10-laps last year
14th-lap -150 -100 -50 0 50 100
cur 1 cur 2 cur 3 cur 4 cur 5 cur 6 10-laps last year 14th-lap 0 100 200 300 400
cur 1 cur 2 cur 3 cur 4 cur 5 cur 6 10-laps last year
14th-lap -200 -100 0 100 200
cur 1 cur 2 cur 3 cur 4 cur 5 cur 6 10-laps last year
14th-lap -200 0 200 400 600 800
cur 1 cur 2 cur 3 cur 4 cur 5 cur 6 10-laps last year
14th-lap -200 -150 -100 -50 0 50 100
cur 1 cur 2 cur 3 cur 4 cur 5 cur 6 10-laps last year
14th-lap 0 20 40 60 80 100
curve 1 curve 4 curve 6
A ve ra ge o f Pattern B Pattern C 0 20 40 60 80 100
curve 1 curve 4 curve 6
A ve ra ge o f d Pattern B Pattern C 0 20 40 60 80 100 curve 1 curve 4 A ve ra ge o f d Pattern B Pattern C 0 20 40 60 80 100 curve 1 curve 4 A ve ra ge o f d Pattern B Pattern C 0 20 40 60 80 100
curve 1 curve 4 curve 6
A ve ra ge o f d Pattern B Pattern C 0 20 40 60 80 100
curve 1 curve 4 curve 6
Pattern B Pattern C 0 20 40 60 80 100
curve 1 curve 4 curve 6
A ve ra ge o f d Pattern B Pattern C 0 20 40 60 80 100
curve 1 curve 4 curve 6
A ve ra ge o f d Pattern B Pattern C 0 20 40 60 80 100 A ve ra ge o f d Pattern B Pattern C 0 20 40 60 80 100 A ve ra ge o f d Pattern B Pattern C Driver 1 Driver 5 Driver 7 Driver 11 Driver 3 Driver 9 Driver 10 Driver 12 Driver 14 Driver 15 -150 -100 -50 0 50 100
cur 1 cur 2 cur 3 cur 4 cur 5 cur 6 10-laps last year
14th-lap -150 -100 -50 0 50 100
cur 1 cur 2 cur 3 cur 4 cur 5 cur 6 10-laps last year 14th-lap -200 -150 -100 -50 0 50 100
cur 1 cur 2 cur 3 cur 4 cur 5 cur 6 10-laps last year
14th-lap 0 100 200 300 400
cur 1 cur 2 cur 3 cur 4 cur 5 cur 6 10-laps last year
14th-lap -200 -100 0 100 200
cur 1 cur 2 cur 3 cur 4 cur 5 cur 6 10-laps last year
14th-lap -200 0 200 400 600 800
cur 1 cur 2 cur 3 cur 4 cur 5 cur 6 10-laps last year
14th-lap -200 0 200 400 600
cur 1 cur 2 cur 3 cur 4 cur 5 cur 6
10-laps last year 14th-lap -150 -100 -50 0 50 100
cur 1 cur 2 cur 3 cur 4 cur 5 cur 6 10-laps last year
14th-lap -200 -150 -100 -50 0 50 100
cur 1 cur 2 cur 3 cur 4 cur 5 cur 6 10-laps last year
14th-lap -200 -100 0 100 200
cur 1 cur 2 cur 3 cur 4 cur 5 cur 6 10-laps last year
14th-lap
and Logistics
0 20 40 60 80 100 120 140 1 1.5 2 2.5 3Distance from the starting of curve [m]
D is ta nc e fr om t he c en te rlin e [m ]
Without advice (10-laps average) After advice 0 20 40 60 80 100 120 140 1 1.5 2 2.5 3
Distance from the starting of curve [m]
D is ta nc e fr om t he c en te rlin e [m ]
Without advice (10-laps average) After advice
Fig. 16 Track variation (Succeed) Fig. 17 Track variation (Failed)
6. CONCLUSIONS
We have proposed a new driving assistance system that can help low-skilled drivers improve their driving skills. We developed a statistical method technology to extract driving features of high- and low-skilled drivers from a huge database. Experiments on driving operations while passing through curves were performed using a driving simulator on a specially designed course. The proposed technology was used to extract features related to each curve. Results showed that most features appeared at the beginning and end of curves, which makes sense as this is where driving operations occur most frequently. We also found that low-skilled drivers tended to operate with more hesitation.
A driving skill evaluation model is built on the basis of extracted features. The accuracy of the model is validated by the leave-one-out cross-validation method. Results show that the proposed method could be used to build such a model to classify the high- and low-skilled driving.
Finally, we performed a series of experiments using a driving simulator in which advice based on extracted features was supplied to low-skilled drivers. Results show good advice at the entrances of curves is effective for improving drivers’ driving skills.
In the next stage, we will examine the more complex traffic environments that typically surround vehicles. We also intend to improve the accuracy of the driving skill evaluation model by using new technology or enlarging the training database.
References
(1) Kato, H. and Kobayashi, S., Factors Contributing to Improved Fuel Economy in Eco-Drive, Journal of Society of Automotive Engineers of Japan, (in Japanese), 62(11), (2008), pp79-84
(2) Y. L. Murphey, R. Milton, L. Kiliaris. Driver‘s style classification using jerk analysis. Computational Intelligence in Vehicles and Vehicular Systems, CIVVS '09. IEEE Workshop, (2009), pp23-28
(3) Germaine L. Odenheimer, Marie Beaudet,Alan M. Jette, Marilyn S. Albert, Laura Grande1 and Kenneth L. Minaker1 “Performance-Based Driving Evaluation of the Elderly Driver: Safety Reliability and Validity”,Journal of Gerontology MEDICAL SCIENCES, Volume 49, Issue 4, pp. 153-159,1994
(4) Susan A. Ferguson, “Other high-risk factors for young drivers”,Journal of Safety Research 2003, (34) 71-77
(5) TADA Masahiro, OHMURA Ren, NAYA Futoshi, NOMA Haruo, TORIYAMA Tomoji, Analysis of Steering Control Behavior Using 3D-Accelerometers [in Japanese. CVIM 2006(93), 233-240, 2006
(6) Mai Yamada, Yamashita Kotomi, Hatsuo Yamasaki, Mikiko Kawasumi, Muneo Yamada, Shin Yamamoto, Tomoaki Nakano, Study on measurement and evaluation of novice
Journal of Mechanical Systems
for Transportation
and Logistics
Vol. 6, No. 2, 2013
driving ability, 10-th symposium on ITS Peer-Review Proceedings, 1-D-4, 2011.
(7) Roberto Abraham TOKUNAGA, Motoki ASANO, Kazunori MUNEHIRO, Toru HAGIWARA, Kunitomo KUNUGIZA, Seiichi KAGAYA, Effects of curve designs and road conditions on driver’s curve sharpness judgment and driving behavior, Journal of the Eastern Asia Society for Transportation Studies, Vol. 6, pp. 3536 - 3550, 2005
(8) Yilu Zhang, Willianm C.Lin, Yuen-Kwok Steve Chin. A Pattern-Recognition Approach for Driving Skill Characterization. IEEE Transactions on Intelligent Transportation System, Vol.11, No.4, 905-916 (2010)
(9) P. Viola, et al.: Robust Real-time Object Detection, International Journal of Computer Vision, 2001. Vol.57, No.2: 137-154.
(10) S. Li, S. Yamabe, Y. Sato, T. Hirasawa, Y. Suda, N.P. Chandrasiri, K. Nawa, T. Matsumura, K. Taguchi. Transactions of Society of Automotive Engineers of Japan, 2012, Vol. 43, No.6: 1387-1392. (In Japanese)