愛知工業大学研究報告 第
31
号A
平成8
年加畑町
s
i
sR
e
g
a
r
d
i
n
g
恥
nG
r
o
w
t
h
悔
l
o
c
i
句
C
u
r
v
eC
l
a
s
s
i
f
i
叫
b
yM
P
V
陣
i
n
B
o
y
s
'
恥
i
出
t
加
d
C
h
e
s
t
G
i
r
t
h
男子の幡、醐におけるM
P
V
年翻附育醐韓の噺
藤 井 勝 紀 Katsunori FujiiABSTRACT The effectuality of a Wavelet Interpolation Method ( W 1 M) for local approximation was proposed by author' s previous paper. In this paper, it is to analyze and describe mean growth velocity curve classified by M P V age of that by the W 1 M to examine the characteristics of weight and chest girth growth velocity curve. The growth distance curve is interpolated to longitudinal weight and chest girth growth distance data( 6 to17years of age ), and is differentiated as the growth velocity curve. M P V age is determined from the growth velocity curve, and the statistic of the M P V age is used to describe the mean growth velocity curve in weight and chest girth. As a result,
five groups in the mean growth velocity curve classified by M P V age was set up as maturi ty types ( early, somewhat early, average, somewhat late and late maturi ty type ), and both phenomena of mid-growth spurt and after-growth spurt was shown in almost maturity types. This tendency in weight and chest girth was a little different from the case of height.
1
7
L INTRODUCTION
author!l2)3)4) proposed Wavelet function to express mathematically the growth curve fluctuated on time axis devided infinitely by expanding Togo and Kobayasi' s idea5) This
田eans the theoretical background based on that
we hypothesized W Multiresolution Phenomenaj totalized a self-similar phenomenon which same figure is regenerated even if magnified or reduced. Since wavlet bases are most effective for local approximation, author proposes the Wavelet Interpolation Method( W 1 M ) as a new approach which applied interpolation method for the multiresolution phenomena. In this method, the growth di stance curve
F
(t)
andresult, based upon time series ( longitudinal data of height growth ), the growth veloci ty curve (
t
,
f
(t) )
is described approximatelythe growth veloci ty curve
f
(t)
, as the derivative of F(t) at t, are assumed to be smooth andL2
(R)
functions. These functions can be approximated by Wavelet series. As aby finite wavelet series. For the above reasons, the peak and the peak age(M P V age) of weight and chest girth are identified by computer simulation, and the mid司growth spurt and the
after-growth spurt in the田eangrowth velocity
curve classified by M P V age are examined.
2 Subjects and Method
The data used for this study were gleaned from the Health Examination Records in Nagoya City during the period from 1972 to1983.These longitudinal growth data consisted of height,
weight, chest girth and sitting height. Author considers the longitudinal weight and chest girth data of 98 Japanese boys, measured annually from 6 to17years of age. And the
1
8
愛知工業大学研究報告,第3
1
号A
,平成8
年,Vo
.
1
3
1
-A
,Ma
r.1
9
9
6
Wavelet Interpolation Method (
W
1 M ) is appl ied as the method here. The algori thm of theW
1 M is stated as follows曹avelet Interpolation Method
Assume that a growth distance curve
F
(t)
and a growth velocity curvef (t) .
f (t)ごdF
(0/
d
t . are smooth and1
/
(
f
i
ノ
functions where
co
L2(R)={g(t):
f
-
∞ g(t)2dtく∞}Then it is shown th巴 following Wavelet
expanslOn:
F (t)
=
L
αj, t.ψ
(2!t - k)j,k
where i. k an integers
戸β)i s M巴yer Wavelet巴) that has a localised
oscillatory form
(ψ(2}
t
-
k) :
j,k
;
αn
iηt
e g er
}
are an orthogonal basis for1
2(
f
i
)
.
So. this Waveletexpansion is becoming the extension of Fouri巴r
series which had a characteristic of locali-zation7)
The algorithums to a Wavelet Interpolation Method ( W 1 M ) can be stated as follows:
1. Time series ( longitudinal ) data {(ti.y;) i =1.
.
z
・・・.n) are gi ven.2. Construct the Meyer Wav巴let
ψ
(X)
whichsatisfies the following condition.
│ψ( t
)
I
亘B for t<
0 or t>
1.3. Take n pairs of integer ( i. k) which satisfy
│ψ(2;
t,
-
k) I
ミ ε :j =1
.
.
.
z
.
.
.
.
.
fl.4. Determine胃avelet coefficients {aj,k ;i. k)
from th巴time series data and values of
a Wavelet function
ψ
(
Z
}
t
,
ーた). by solving such simultaneous linear巴quationssuch that
n
y=
工
α
_
"
k
ψ
(2;t
,
- k ) 1 j, k y=
L
Ltj.'ψ (2Jt
n - k) j,た Table 1 岡田narrl standard deviation ofpiP V e旬geIn開ight,and:rlassifications of田turitylY田 M ea.n 12. 60 early間turity ty開 ~ p v壬 10.7 S D 1. 12 '0間 四 国t田r1y司aturIty ty開 10. B孟 AP V亘 11.9 Max 1 5. 0 average type 12.0亘 AP V壬 13.1 Min 9. 4 '0園 開hat late聞aturityty~ 13.2壬珂 PV冨14.3 Range 5. 6 lale阻aturity句 碑 14.4亘 KP V Tnblc 2阿eanand s tand町ddeviation orpfP V age in chest girth, and classiricaLions of alurlty ty開 M eo.n S D Max Min ヨange Height:cl11 200.00 180.00 160.00 140.00 120凹 1 2. 8 1 car1y maturi ty lypn 1 . 58 SOIIlC胃halearlyllIal.urity lYfn 1 6. 0 a四,rage type 9. 2 somu胃hat late malllri ty tn:e 6. 8 late Miunrity lyP8 Ave.M.ht3 J /レ
J_
.
+
.
.
.
戸
戸
伊 一 一 一 一 一 一 一 一 一 一 一 f tp V 三三10.3 10.4冨MP V豆 11.9 12.0亘開 PV '" 13.6 13.7'"問pv主15.2 15.3壬 "P V 一一一一一卜一一一一 d!3.D 固iiiT.i)' 百jj.ë~ ー ト一一一二、→仁一一、
一 一 _y
..~t\_I_t=
一r.-
I--I
叩0,凹 80.00 60.00、
、
、
40.00 円一一一一ト一一一I
I
I-CCI'~
町w' 20.00 0.00 20.00~ 6凹 8.00 10.00 12.00 14.00 16.00 f'ig 1 ^n exa柵plegr昂phor distnnce and ve!ocity円
'
"
円
a[lflrO震;maled byI!'avelet lnterpol訟tionMethod Ag巴加lnalysis除garding胸lGro耐恥loci町伽鴨Classified by U P V Age . io Pilys'恥igbtand Illest Girth
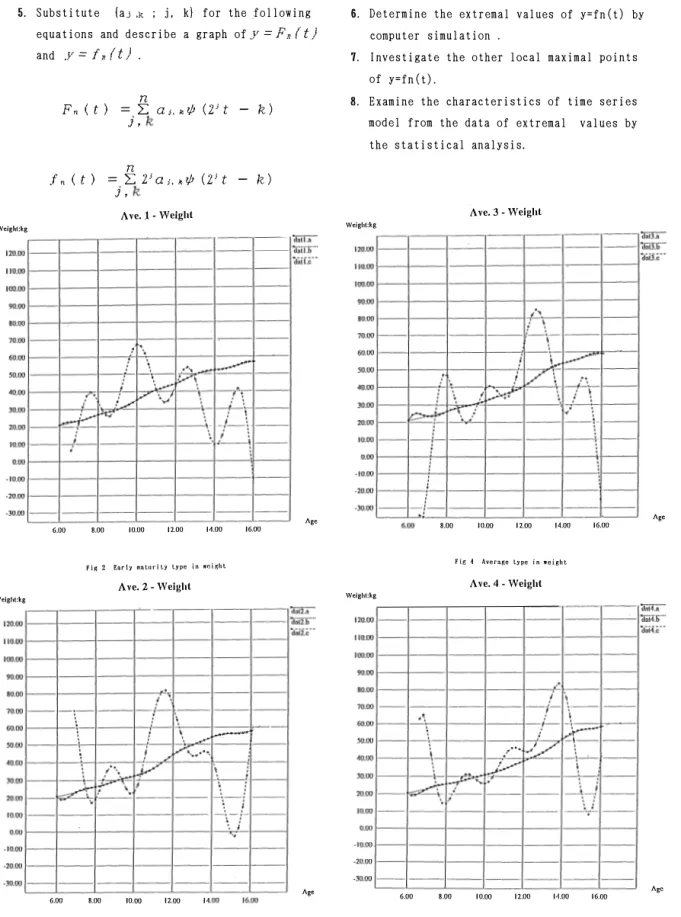
5. Substitute {aj.k ; j, k} for the following equations and describe a graph of y
=
F. (t)and .Y
=
f. ( t) . n Fn(t) =2: α.;, �ψ(2; t - k) J, IZ n f n ( t) = 2: 2; a;. •ψ(2; t - k) J, IZ Ave.l・1月Velght Welghl:kg一二
三
一一
6.00 8.00 10.00 12.00 1<1.00 16.00Fi区2 Kllrly mllluri Ly lype in lI'eight Ave.2-'市eight Weighl:kg 6.00 8. 00 10田 口凹 14 t g e w n e p y t
s
t r u t a mg
I
r a e t a h w e m o S3
Z
F 196. Determine the extremal values of y=fn (t) by co剖puter simulation .
7. Investigate the other local maximal points of y=fn (t) .
8. Examine the characteristics of time series model from the data of extremal values by the statistical analysis.
Ave.3-'市eight Welghl:kg
^ge 8.00 10.凹 12凹 14.00 16.00 ^ge
Fig 4 AveragÐ Lype in lI'eight Ave.4・1市eight Weighl:kg
凹」一二l二日ヨヨ事
^g. 6.00 8.00 10凹 12.00 14.00 16凹 ^ge
20 愛知工業大学研究報告, 第31号A, 平成8年, V 01.31-A, Mar. 1996 3 Resul ts and di,scussion
Growth distance and velocity curve were simulated with UNIX work-station as shown in Fig 1 by the W 1 M. This graph is one of 98 boys' samples in height
•
the graph describedwith solid line is the growth distance curve. the one with dotted line is the growth
Ave.5 -、市eighl Weighl:kg
剖叩i一一「一一「一一寸一一一「一一|一一一rー-1 .
,、.e
6.00 8.00 10.00 12.00 14.00 16.00
Fig 6 I..ate 聞alurity Lyp曾in 'IIeight Ave. 1-Chest
6.00 8.00 10.00 12 凹 '4加
山山
Fig 7 Enrly rnalurity type in chesl p,'Îrl.h
velocity curve. The unit of mark with degree on the vertical axis is set Up with matching for the growth distance curve of height in this graph. though regarding that in the growth veloci ty curve. i t i s set Up wi th lowering ten figures in rank than that in the growth distance curve.
The peak ( M P V ) and the figure of curve in
Ave. 2
-
Chest l油田 E一一一-1 E一一一-10叩 100.00 chesl:cm 6.00 8.00 10.冊 目凹 H凹 16.00Fig 8 So聞ewhal earJy 聞aturity type in c:hp.st girlh Ave.3・Chest
6.00 8.00 10 凹 12.凹 14.00
Fig Q herage type in chesl rdr t h
^ge
lJi lJialysis Rega吋i陀恥n Gro帥Velocity伽四Classified by目P VAge in動向, Weiゆtand IlIest Girth
this graph can be grasped clearly, therefore, M P V and M P V age in 官eight and chest girth were derived individually from wavelet func-tion which requested th巴curve approximated in the graph of 98 boys by UNIX work-station. As shown in table 1 , mean M P V age was 12. 60 ( SD
=
1. 12 ) in weight and was 12.81 ( SD=
1.58) in chest girth, and the difference A ve. 4
-
Chestchesl:cm
一一一←一一一一一一一司一一一一「一一--,一一←-,---,古前γ
21
between mean M P V age of weight and chest girth was about 0.2 years of age. A criterïon of maturity rate 官as attempted to device with judging from the mean and standard deviation of M P V age in weight and chest girth. ( Table 2 ) Mean of the growth distancies in respective group classified by a criterion of maturity rate judged from M P V ag巴was computed in weight and chest girth. Approximated curve of that for the mean of the gro官th distancies was described
120凹|
一一一
lー←ー
1-ー←ー
l一一一←
!一一一←|一一一一
|←一一一
I
:i,�:�:: respectively in five groups classified byd�i4.ë一一
maturity rate in weight and chest girth by the
W 1 M, moreover the growth velocity curve which differenciated the approximated curve was described as well as the growth distance c日rv巴
( Fig 2
--
Fig 1 1 ). -30.凹ト一一|一一 -1-←一
仁二二二 6.00 8.00 10.00 12.00 14J】リ 16.00 h t r RK s e e n阿
y t y t r a m e t a a w n m o s o i en F Ave.5・Chest chc汚t:CIl1一二二二コ二二|二二|二二仁二院F
120.00 100駅} 3附l←ー「一一一一|一一一一|一一一 6.00 8.00 10.00 12.00 1<1.00 16.00SR
C
肘
y R e a R 八,0The validity on the wavelet interpolation method ( W 1 M ) has been assurèd by author' s previous studies 1)2)3)4) especially. it was very significant that M P V is identified in the growth velocity curve and a criterion classified by maturity rate in height judged from M P V age is devised. Thus it is considered that criterions of five ranks classified by M P V age in weight and chest girth are also h日lpful to grasp as the standard growth velocity curve classified by maturi ty rate. The mid-growth spurt ( which Tanner8)labelled ) and the after growth spurt ( which Matsuura ヨ suggested and labelled) occur almost in maturity types of the growth velocity curves classified by M P V age in weight and chest girth. This tendency is a little different from the cas巴 of height Tanner10) stated that the mid growth spurt more appeared in weight than in height. however, did not discuss adequately about this spurt. Matsuura 9) 1Q) suggested the existence of the
after-growth spurt. though did not examine into detail about this spurt. As affairs now stand, number of the peak, correc t age and growth velocities in th巴peak point in the mid- and after-growth spurt are not clarrified because 冊目thods which detect these spurt in previous investigations vary. Therefore. author intends
22 愛知工業大学研究報告,第31号