鳥取大学研究成果リポジトリ
Tottori University research result repository
タイトル
Title
Renal shear wave velocity by acoustic radiation force
impulse did not reflect advanced renal impairment
著者
Auther(s)
Takata, Tomoaki; Koda, Masahiko; Sugihara, Takaaki;
Sugihara, Shinobu; Okamoto, Toshiaki; Miyoshi,
Kenichi; Matono, Tomomitsu; Hosho, Keiko; Mae,
Yukari; Iyama, Takuji; Fukui, Takeaki; Fukuda, Satoko;
Munemura, Chishio; Isomoto, Hajime
掲載誌・巻号・ページ
Citation
NEPHROLOGY , 21 (12) : 1056 - 1062
刊行日
Issue Date
2016-12
資源タイプ
Resource Type
学術雑誌論文 / Journal Article
版区分
Resource Version
著者版 / Author
権利
Rights
(C) 2015 Asian Pacific Society of Nephrology. This is
the peer reviewed version of the following article:
[NEPHROLOGY. 2016. 21(12). 1056-1062.], which has been
published in final form at [10.1111/nep.12701]. This
article may be used for non-commercial purposes in
accordance with Wiley Terms and Conditions for Use of
Self-Archived Versions.
DOI
10.1111/nep.12701
This article has been accepted for publication and undergone full peer review but has not been through the copyediting, typesetting, pagination and proofreading process which may lead to differences between this version and the Version of Record. Please cite this article as
Renal shear wave velocity by acoustic radiation force impulse did not
reflect advanced renal impairment
Tomoaki Takata, Masahiko Koda, Takaaki Sugihara, Shinobu Sugihara, Toshiaki Okamoto, Kenichi
Miyoshi, Tomomitsu Matono, Keiko Hosho, Yukari Mae, Takuji Iyama, Takeaki Fukui, Satoko Fukuda,
Chishio Munemura, Hajime Isomoto
Division of Medicine and Clinical Science, Tottori University Faculty of Medicine, Tottori, Japan.
All correspondence concerning this paper should be addressed to:
Tomoaki Takata, MD, PhD
Division of Medicine and Clinical Science
Department of Multidisciplinary Internal Medicine, Faculty of Medicine
Tottori University, 36-1 Nishimachi, Yonago, Tottori 683-8504, Japan
E-mail address: [email protected]
Tel: +81-859-38-6527; Fax: +81-859-38-6529
Abstract
Aim: Acoustic radiation force impulse is a noninvasive method for evaluating tissue elasticity on
ultrasound. Renal shear wave velocity measured by this technique has not been fully investigated in
patients with renal disease. The aim of the present study was to compare renal shear wave velocity in
end-stage renal disease patients and that in patients without chronic kidney disease and to investigate
influencing factors.
Methods: Renal shear wave velocities were measured in 59 healthy young subjects (control group), 31
subjects without chronic kidney disease (non-CKD group), and 39 end-stage renal disease patients (ESRD
group). Each measurement was performed ten times at both kidneys, and the mean value of eight of ten
measurements, excluding the maximum and minimum values, was compared.
Results: Renal shear wave velocity could be measured in all subjects. Renal shear wave velocity in the
control group was higher than in the non-CKD group and in the ESRD group, and no difference was found
between the non-CKD group and the ESRD group. Age and depth were negatively correlated to the renal
shear wave velocity. In multiple regression analysis, age and depth were independent factors for renal
shear wave velocity, while renal impairment was not. There was no difference between the non-CKD
Conclusion: Renal shear wave velocity was not associated with advanced renal impairment. However, it
reflected alteration of renal aging, and this technique may be useful to detect renal impairment in the
earlier stages.
Introduction
Patients with chronic kidney disease (CKD) show a progressive decline in renal function with
time, which leads to end-stage renal disease (ESRD). Glomerular sclerosis and interstitial fibrosis are the
principal processes underlying the progression of CKD. However, they are elucidated only by renal biopsy.
These pathological findings may be related to tissue elasticity.
A new non-invasive method for the evaluation of tissue elasticity has received a great deal of
attention as an alternative to needle biopsy. Acoustic radiation force impulse (ARFI) imaging is a recently
developed non-invasive method for evaluating tissue elasticity using B-mode ultrasound.1,2
In ARFI imaging, a mechanical excitation of tissue by short-duration acoustic pulses produces
shear waves that spread away from the tissue. By recording the shear wave front and measuring the elapsed
time, the shear wave velocity (SWV) can be quantified.3 Generally, the stiffer the tissue is, the faster the
SWV will be.2
In recent studies, hepatic SWV using ARFI has shown good correlation with the stage of hepatic
fibrosis.3,4 There were only a few reports using this technique for renal tissues in CKD patients, and its
feasibility in the diagnosis of renal fibrosis has yet to be elucidated. The aim of the present study was to
compare the renal SWVs assessed by ARFI elastography in ESRD patients with those in non-CKD
Patients and Methods
Study population
Between April 2013 and November 2014, we enrolled the following three groups: 59 healthy
young volunteers (control group; 59 men; median age, 23.0 years; range, 20-35 years) without any medical
history or present illness; 31 non-CKD subjects (non-CKD group; 24 men and 7 women; median age, 59.0
years; range, 17-94 years) without past history of renal disease or renal dysfunction, whose estimated
glomerular filtration rate was more than 60 mL/min/1.73m2; and 39 ESRD patients (ESRD group; 25 men
and 14 women; median age, 72.0 years; range, 38-86 years) who were admitted to our hospital and
underwent maintenance hemodialysis or peritoneal dialysis. This study was conducted in accordance with
the Declaration of Helsinki and with approval from the ethics committee of our hospital (approval number;
2316).
Measurement of SWVs by ARFI elastography
All examinations were performed using a Siemens Acuson S2000 ultrasound system (Siemens,
Erlangen, Germany), with convex probes (4C1, frequency range: 1-4 MHz) and a mechanical index of 1.7.
Measurement was performed with the preliminary identification of a target region of interest
(ROI; box with fixed dimension of 1 × 0.5 cm) on a conventional ultrasound image. The ROI was placed
from the surface to the ROI was limited to less than 8 cm (Fig. 1). The applied transducer pressure was
minimized as much as possible during imaging to avoid mechanical compression on the kidney. Then, with
the patients holding their breath, an acoustic push pulse was transmitted immediately on the right side of
the ROI, where the SWVs were calculated and expressed with a numerical value (m/s) as a result of
multiple measurements made for the same spatial location.
Measurements were performed ten times for each kidney. Excluding the maximum and minimum
values, the mean of the remaining 8 measurements was used. In the event of a non-valid measurement
(expressed as X.XX m/s), a repeat measurement was carried out. All measurements were performed by one
experienced ultrasound physician (T.T).
Statistical analysis
For statistical data analysis, Statflex Version 6.0 for Windows (Artec, Osaka, Japan) was used.
All descriptive results are presented as median vales with the range. A statistical comparison of all data
was performed using the Mann-Whitney U test with Bonferroni correction. The relationship between
variables was investigated using Spearman’s correlation coefficient (r). A two-tailed p value of less than 0.05 was considered statistically significant. Multiple linear regression analysis, in which age, depth of
ROI and presence or absence of CKD were included, was performed to investigate factors influencing
Results
Patient characteristics
Table 1 summarizes the major demographic and clinical characteristics. The most common
etiology of ESRD was diabetic nephropathy (16/39, 41.0%) followed by nephrosclerosis (8/39, 20.5%).
Both kidneys were significantly more atrophic in the ESRD group compared to the control group (p <
0.001 at the right kidney, p < 0.001 at the left kidney, respectively).
Renal SWV
The coefficient of variance of five sets of measurement repeated in the same healthy subject was
8.2%. SWV for all subjects could be measured by ARFI elastography.
The SWVs in the control group were 2.87 (m/s) (range, 1.63 – 3.81) at the left kidney, 3.01 (m/s)
(range, 1.99 – 4.05) at the right kidney. There was no significant difference between the left and right
kidneys. The SWVs in the non-CKD group were 2.26 (m/s) (range, 0.76 – 3.58) at the left kidney, 2.23
(m/s) (range, 1.08 – 3.89) at the right kidney. There was no significant difference between both kidneys.
The SWVs in the ESRD group were 1.87 (m/s) (range, 1.01 – 3.44) at the left kidney, 2.19 (m/s) (range,
0.96 – 3.60) at the right kidney. Similarly, no significant difference in SWVs was observed between both
kidneys in the ESRD group. The SWV in the control group was significantly higher than in the non-CKD
group (p < 0.001 at bilateral kidneys) and in the ESRD group (p < 0.001 at bilateral kidneys). However,
kidneys (Fig. 2).
Association between renal SWV and clinical parameters
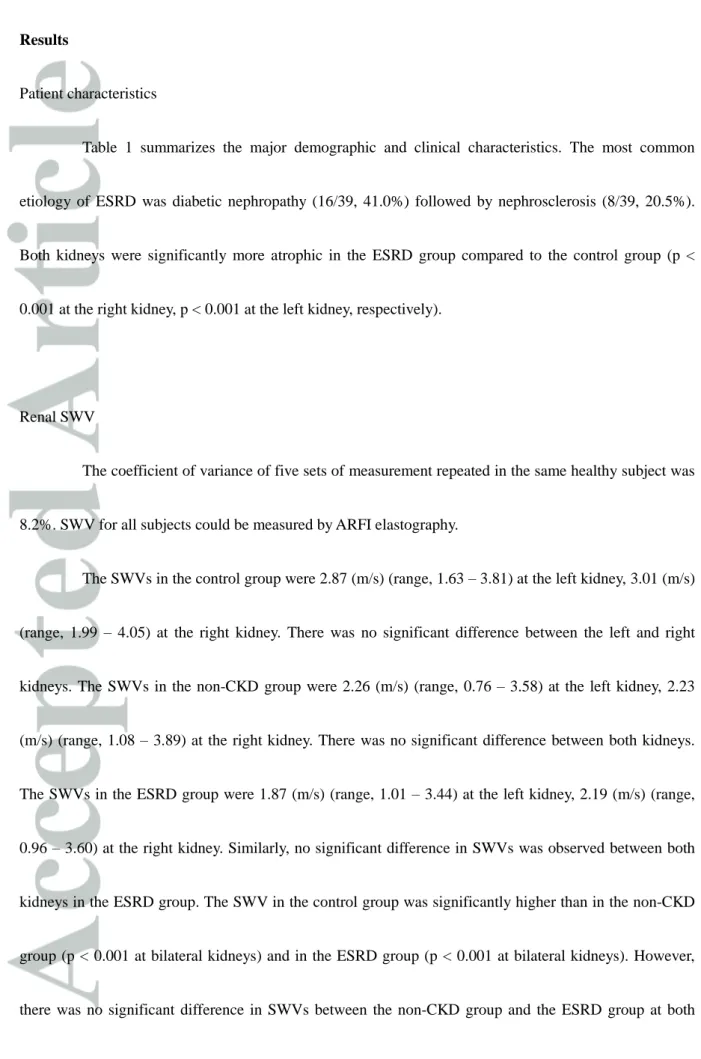
In the control group and the non-CKD group, age was negatively correlated with the SWV (r =
-0.44, p < 0.001 at the left and r = -0.38, p < 0.001 at the right kidney) (Fig. 3). In the control group, the
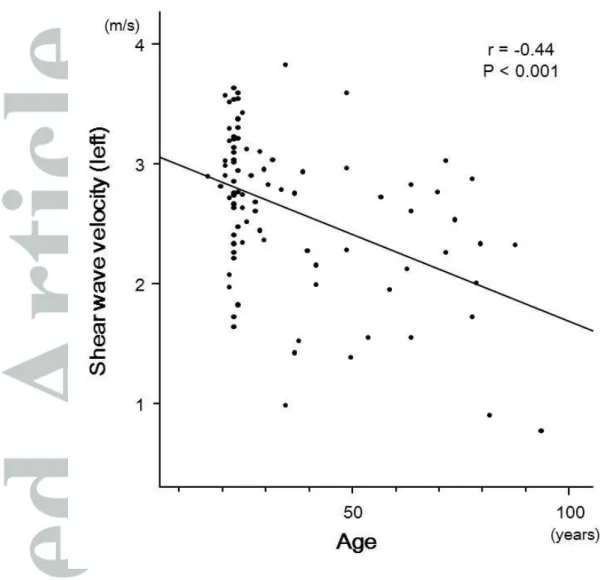
SWV and the depth set for SWV measurement showed a negative correlation (r = -0.35, p < 0.01 at the left
and r = -0.34, p < 0.05 at the right kidney). There were similar correlations between the SWV and the
depth in the non-CKD group (r = -0.49, p < 0.01 at the left and r = -0.63, p < 0.001 at the right kidney) and
ESRD group (r = -0.39, p < 0.05 at the left and r = -0.39, p < 0.05 at the right kidney) (Fig. 4).
In order to investigate the factors influencing SWV, we performed multiple linear regression
analysis applying the SWV as a dependent variable and the depth, age, and the presence or absence of
CKD as independent variables. The depth and age were independent factors affecting the SWV (p < 0.001
at both kidneys); however, renal impairment was not. Because the depth greatly affected SWV
measurement, we compared SWVs among the three groups (37 subjects in the control group, 21 in the
non-CKD group and 21 in the ESRD group for the left kidney, 43 in the control group, 17 in the non-CKD
group and 23 in the ESRD group for the right kidney) in subjects in whom depth could be measured from
2.0 cm to 4.0 cm. The SWVs in the ESRD group and in the non-CKD group were significantly lower than
those in the control group (p < 0.01, p < 0.001 at the left kidney and p < 0.01, p < 0.001 at the right kidney,
ESRD group and those in the non-CKD group.
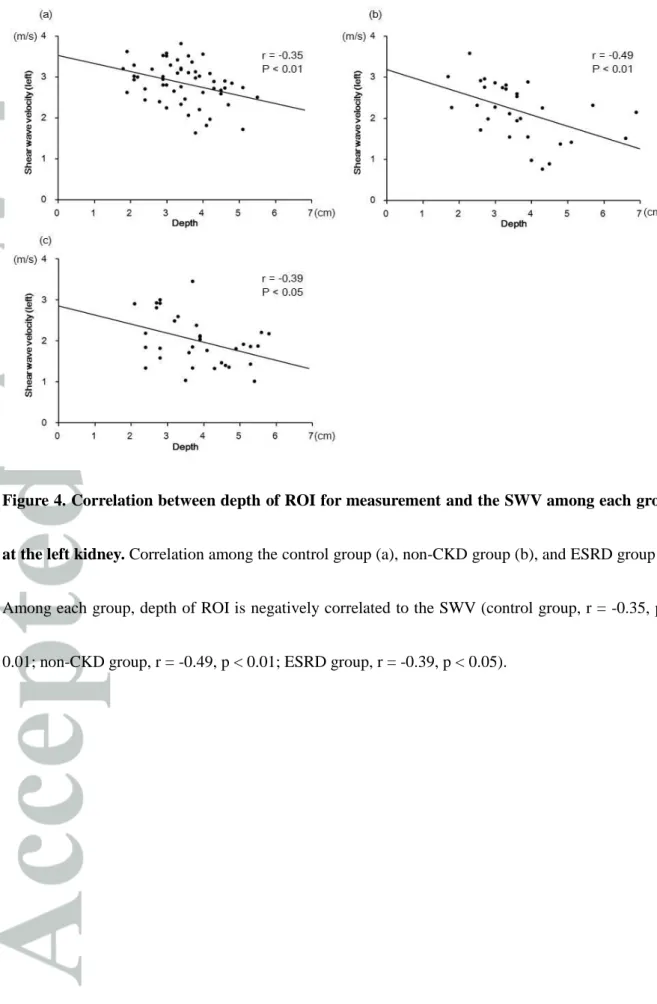
To exclude the effects of age and depth on the measurement of SWV, we chose age-matched
patients over 40 years of age from both the non-CKD group and the ESRD group and compared SWVs
(Table 2). The SWV was adjusted for the depth using a regression formula obtained from the control
group:
Adjusted SWV (left) = 3.52857 - 0.197 × depth
Adjusted SWV (right) = 3.64024 - 0.1925 × depth
As a result, there was also no difference in adjusted SWV between the non-CKD group and the ESRD
group at both kidneys (Fig. 6).
Discussion
In the present study, we obtained three important findings. First, renal SWV with ARFI could be
measured, even in atrophied kidneys in ESRD patients. Second, renal SWV depended on age and the depth
of ROI. Third, renal SWV was not associated with renal impairment in the advanced stage; however, it is
useful for detection of renal impairment in earlier stages.
Renal SWV using ARFI has been investigated in healthy subjects5-7 and in transplanted
kidneys,8,9 but it has not been fully investigated in CKD patients and has rarely been applied to ESRD
kidneys in ESRD patients. Furthermore, because the coefficient variance of SWV measurements was low,
the measurement of SWV had enough reproducibility.
Second, the present study revealed that SWV was inversely correlated with age in subjects
without renal disease. This result is consistent with previous reports,7,10 while Goertz6 reported no
significant correlation was observed between age and the SWV in healthy adults. Structural changes with
aging include glomerular sclerosis, interstitial fibrosis, and cyst formation.11 The ischemic changes seen in
aging kidneys first cause cortical glomerular sclerosis and consequent juxtamedullary hypertrophy,
followed by juxtamedullary glomerular sclerosis.11 These changes increase renal SWV. However, the aging
kidney also shows the dilatation of afferent arteries and glomerular capillary lumens.11 In addition,
according to the decreased number of glomeruli in the superficial cortex, shift perfusion of the blood
supply of the superficial cortex promotes enlargement of the remaining glomeruli.11 These changes
decrease renal SWV. In our study, SWVs decreased with age and may have been influenced more by the
glomerular enlargement and dilated arteries than by interstitial fibrosis.
The depth of ROI strongly affected the SWV value. In fact, the depth was inversely correlated
with the renal SWV and was an independent factor for renal SWV. Although ROI in the SWV
measurement should be set at the constant depth, it is difficult to measure SWV at a constant depth due to
body size or obesity. Because the regression lines between the depth and renal SWV in each group were
similar as shown in Figure 4, SWV may be adjusted by the measurement depth with a regression formula.
Third, renal SWV was not associated with renal impairment in the advanced stage; however, it is
useful to detect renal impairment in earlier stages. Although we compared renal SWVs in between the
non-CKD group and the ESRD group, which were measured at a depth of ROI of 2 to 4 cm, no significant
difference was found. Furthermore, no difference was found in age-matched and depth-adjusted renal
SWVs between both groups.
Wang12 revealed that renal elasticity was not related to either CKD stage or pathological fibrosis.
In CKD patients who underwent renal biopsy, another report found no difference in renal elasticity among
different stages of CKD except for stage 5.7 Asano13 found a positive correlation between the SWV and
estimated glomerular filtration rate, and reported that the hemodynamics of the kidney have an influence
on renal elasticity with ARFI, but the report did not indicated the extent of the influence of the
hemodynamics. In principle, however, blood flow through the ROI could be ignored because the acoustic
pulse from the transducer takes a very short time to reach the target.14 Renal elasticity has been reported to
increase with the progression of renal fibrosis in patients with nephropathy.15 The alteration of renal
elasticity in ESRD remains controversial.
The histologic changes with the progression of CKD include not only glomerular sclerosis,
tubular atrophy, and interstitial fibrosis, but also tubular dilatation and cyst formation. Acquired cystic
kidney disease, which is characterized by small cysts distributed throughout the renal cortex and medulla,16
is often found in patients with CKD with or without hemodialysis.17 The origin of the cysts is considered to
cysts are frequently seen in ESRD patients.18 In an autopsy case series of hemodialysis patients, several
subjects had multiple small cysts that had not been diagnosed clinically by imaging modalities.19 Because
ESRD patients had both fibrosis as a factor increasing the risk for renal SWV and undetectable small cysts
as a factor decreasing their risk, their SWVs may have been counterbalanced by both effects.
There are several limitations in our study. First, only male subjects were included in the control
group. Our study did not take gender into consideration because there was no difference due to gender in
the non-CKD and the ESRD groups. Second, pathological validation was investigated in neither aging
kidneys nor end-stage kidneys. Further study is required in order to confirm the relationship between renal
SWV and pathological findings.
In conclusion, renal SWV was not associated with renal impairment in the advanced stage.
However, it reflected alteration of renal aging, and this technique may be useful in the detection of renal
impairment in earlier stages.
References
1. Sarvazyan AP, Urban MW, Greenleaf JF. Acoustic waves in medical imaging and diagnosis.
Ultrasound Med. Bio. 2013; 39: 1133-46.
2. Doherty JR, Trahey GE, Nightingale KR, Palmeri ML. Acoustic radiation force elasticity imaging in
diagnostic ultrasound. IEEE Trans. Ultrason. Ferroelectr. Freq. Control. 2013; 60: 685-701.
3. Lupsor M, Badea R, Stefanescu H, et al. Performance of a new elastographic method (ARFI
technology) compared to unidimensional transient elastography in the noninvasive assessment of
chronic hepatitis C. preliminary results. J. Gastrointestin. Liver Dis. 2009; 18: 303-10.
4. Takahashi H, Ono N, Eguchi Y, et al. Evaluation of acoustic radiation force impulse elastography for
fibrosis staging of chronic liver disease: a pilot study. Liver Int. 2010; 30: 538-45.
5. Gallotti A, D’Onofrio M, Pozzi Mucelli R. Acoustic radiation force impulse (ARFI) technique in
ultrasound with virtual touch tissue quantification of the upper abdomen. Radiol. Med. 2010; 115:
889-97.
6. Goertz RS, Amann K, Heide R, Bernatik T, Neurath MF, Strobel D. An abdominal and thyroid status
with acoustic radiation force impulse elastometry — a feasibility study: acoustic radiation force
impulse elastometry of human organs. Eur. J. Radiol. 2011; 80: e226-30.
7. Guo LH, Xu HX, Fu HJ, Peng A, Zhang YF, Liu LN. Acoustic radiation force impulse imaging for
noninvasive evaluation of renal parenchyma elasticity: preliminary findings. PLoS One. 2013; 11:
8. Stock KF, Klein BS, Cong MT, et al. ARFI-based tissue elasticity quantification and kidney graft
dysfunction: first clinical experiences. Clin. Hemorheol. Microcirc. 2011; 49: 527-35.
9. Grenier N, Poulain S, Lepreux S, et al. Quantitative elastography of renal transplants using supersonic
shear imaging: a pilot study. Eur. Radiol. 2012; 22: 2138-46.
10. Lee MJ, Kim MJ, Han KH, Yoon CS. Age-related changes in liver, kidney, and spleen stiffness in
healthy children measured with acoustic radiation force impulse imaging. Eur. J. Radiol. 2013; 82:
e290-4.
11. Zhou XJ, Fenves AZ, Vaziri ND, Saxena R. Renal changes with aging and end-stage renal disease. In:
Jennette JC, Olson JL, Silva FG, D’Agati VD (ed). Heptinstall’s Pathology of the Kidney, Vol 2, 7th
edn. Philadelphia: Wolters Kluwer, 2015; 1294-309.
12. Wang L, Xia P, Lv K, et al. Assessment of renal tissue elasticity by acoustic radiation force impulse
quantification with histopathological correlation: preliminary experience in chronic kidney disease.
Eur. Radiol. 2014; 24: 1694-9.
13. Asano K, Ogata A, Tanaka K, et al. Acoustic radiation force impulse elastography of the kidneys: is
shear wave velocity affected by tissue fibrosis or renal blood flow? J. Ultrasound Med. 2014; 33:
793-801.
14. Amador C, Urban MW, Chen S, Greenleaf JF. Shear wave dispersion ultrasound vibrometry (SDUV)
on swine kidney. IEEE Trans Ultrason. Ferroelectr. Freq. Control. 2011; 58: 2608-19.
clinicopathological typing of renal fibrosis. Exp. Ther. Med. 2014; 7: 233-5.
16. Torres VE, Grantham JJ. Cystic diseases of the kidney. In: Taal MW, Chertow GM, Marsden PA,
Skorecki K, Yu ASL, Brenner BM (ed). Brenner and Rector’s The Kidney, Vol 2, 9th edn.
Philadelphia: Saunders, 2012; 1657-8.
17. Al-Said J, Brumback MA, Moghazi S, Baumgarten DA, O’Neill WC. Reduced renal function in
patients with simple renal cysts. Kidney Int. 2004; 65: 2303-8.
18. Ogata K. Clinicopathological study of kidneys from patients on chronic dialysis. Kidney Int. 1990; 37:
1333-40.
19. Krempien B, Ritz E. Acquired cystic transformation of the kidneys of haemodialysed patients.
Figure 1. Measurement of SWVs. The region of interest was placed perpendicular to a renal
Figure 2. SWV at the left kidney among three groups. The SWV in the control group was
significantly higher than in the non-CKD group and in the ESRD group (p < 0.001, p < 0.001,
respectively); however, there was no significant difference between the non-CKD group and the
ESRD group. The top of the bottom of the boxes are the first and third quartile, respectively. The
length of the box represents therefore the interquartile range including 50% of the values. The line
through the middle of each box represents the median. The error bar shows the minimum and
Figure 3. Correlation between age and the SWV at the left kidney among control and non-CKD
groups. Renal SWV was negatively correlated to age among the control and the non-CKD groups (r =
Figure 4. Correlation between depth of ROI for measurement and the SWV among each group
at the left kidney. Correlation among the control group (a), non-CKD group (b), and ESRD group (c).
Among each group, depth of ROI is negatively correlated to the SWV (control group, r = -0.35, p <
Figure 5. SWVs at the left kidney measured at a depth between 2 to 4 cm. The SWV in the
control group was significantly higher than in the non-CKD group and in the ESRD group (p < 0.01, p
< 0.001 respectively); however, there was no significant difference between the non-CKD group and
Figure 6. Comparison of renal SWV between age-matched non-CKD group and ESRD group.
There was no significant difference in renal SWVs between the non-CKD group and the ESRD group.
The SWV was adjusted for the depth as follows; adjusted SWV (left) = 3.52857 - 0.197 × depth,
Table 1. Patient’s characteristics
Control Non-CKD ESRD
Number 59 31 39
Male/Female 59/0 24/7 25/14
Age, median (range) 23.0 (20-35) 59.0 (17-94) 72.0 (38-86) Kidney length (cm) Right 10.2 (9.3-11.5) 10.3 (8.5-11.9) 8.3 (7.0-9.0) Left 10.3 (9.1-11.4) 10.2 (8.3-12.2) 8.0 (6.3-9.3) Cause of ESRD Diabetic nephropathy 16 Nephrosclerosis 8
Chronic glomerular nephritis 2
Other 3
Unknown 10
CKD, chronic kidney disease; ESRD, end-stage renal disease
Table 2. Age-matched patients over 40 years of age
Age-matched non-CKD group Age-matched ESRD group P-value
Number 19 19
Male/Female 15/4 12/7 0.28
Age, median (range) 70.0 (40-88) 70.0 (41-86) 0.90 SWV parameters Right kidney Measured SWV (m/s) 2.28 (1.48-3.31) 2.22 (1.57-3.49) 0.98 Depth (cm) 4.0 (1.8-5.3) 3.2 (1.7-5.5) 0.20 Adjusted SWV (m/s) 2.87 (2.62-3.29) 3.02 (2.58-3.31) 0.20 Left kidney Measured SWV (m/s) 2.26 (0.89-3.01) 1.85 (1.03-3.00) 0.13 Depth (cm) 3.4 (1.7-5.7) 3.8 (2.4-5.8) 0.20 Adjusted SWV (m/s) 2.86 (2.41-3.19) 2.78 (2.39-3.06) 0.20