結核年報 2012(4)治療・治療成績
結核研究所疫学情報センター
キーワーズ:結核,治療歴,受療状況,治療期間,治療成績
は じ め に
結核登録者情報システムでは,登録患者の結核治療
歴・治療開始時の抗結核薬内容・治療開始時の受療状況・
入院治療者の入退院日・登録年の次年末時における治療
終了状況の情報が入力・集計されている。
ある一定期間内に新規に登録された結核患者集団を
「コホート」と呼び,そのコホートについて治療終了あ
るいは治療中の死亡や転出の状況を観察し,判定基準に
基づいてその状況を分類した結果を「コホート法による
治療成績」と呼ぶ。結核登録者情報システム年報では,
前年に新規に登録された全結核患者集団をコホートとし
て分析対象とし,そのうち肺結核患者について治療成績
を自動算出している。一方,前年に登録された全結核患
者の,その次の年末時における登録除外状況および除外
理由については,保健所で入力された情報から集計して
いる。
本報告は 2012 年の結核登録者情報システム年報情報
から,わが国の結核患者の治療歴・受療状況・治療期間
等についてと,2011 年に新規に登録された結核患者のコ
ホート法による治療成績および登録除外状況からの死亡
状況等について概観する。
治 療 歴
( 1 )治療歴(表 1 )
2012 年に新規登録された活動性結核患者 21,283 人の
治療歴を表 1 に示す。再治療は「化学療法による治療歴
あり」を意味し,外科療法のみ等の場合にはこれに含め
ていない。再治療患者は 1,336 人(前年 1,687 人)で,治
療歴不明患者(371 人)を除く全活動性結核患者の 6.4%
となり,前年 7.6% よりも低下している。また上記再治療
者のうち 95 人で潜在性結核感染症治療歴があり,前年
57 人の 2 倍弱になっている。表には掲載していないが,
日本生まれの人で,多剤耐性結核として 2012 年に結核
患者登録システムに登録された培養陽性肺結核患者 42
人のうちの再治療者は 16 人で,初回多剤耐性結核患者
のほうが多かった。
( 2 )再治療患者の前回治療開始年(表 2 )
2012 年に再治療となった結核患者 1,336 人の,前回治
療開始年についての集計を表 2 に示す。昨年度のデータ
と傾向は同じであり,比較的最近(2000 年以降)の治療
歴とかなり以前(1950 年代前後)の治療歴の二峰性の分
布を示しているが,前者のほうが大きなピークを形成し
ている。
治療開始時の治療内容
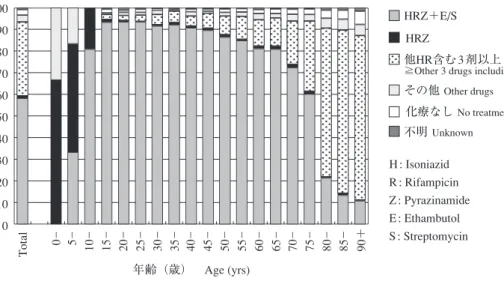
( 3 )治療開始時治療内容(図 1 ・表 3 )
2012 年に新規登録された全活動性結核患者 21,283 人
の年齢 5 歳階層別治療開始時化学療法内容を図 1 に示
す。化療なしの患者には,診断前死亡や,全身状態不良
で化学療法不可能だった者,治療拒否者などが含まれる
ものと推察される。イソニアジド(INH)・リファンピ
シン(RFP)
・ピラジナミド(PZA)
〔HRZ〕を用いる標準
法による治療開始割合は,15 歳から 49 歳まではおよそ
90% 前後であるが,これ以上の年齢で少しずつ減少し,
80 歳を境に特に著明に低下している。この傾向は以前
と同じで,75 歳以上や 80 歳以上の年齢層における PZA
使用率も前年とほとんど変化はなく,高齢者に対する
PZA 使用方針は全国的にみて大きな変化はないようで
ある。
公益財団法人結核予防会結核研究所
連絡先 : 疫学情報センター,公益財団法人結核予防会結核研究
所,〒 204 _ 8533 東京都清瀬市松山 3 _ 1 _ 24
(E-mail : tbsur@jata.or.jp)
表 2 再治療患者の年齢階層別・前回治療開始年別患者数,2012 年
Table 2 Number of retreatment tuberculosis patients by previous treatment year and age group, 2012
年
Year
総計
Total年齢(歳)
Age group (yrs)(再掲)前回
治療内容不明
(Re-count)* 0 _ 19 20 _ 29 30 _ 39 40 _ 49 50 _ 59 60 _ 69 70 _ 79 80+総数
Total_ 1949
1950 _ 59
1960 _ 69
1970 _ 79
1980 _ 89
1990 _ 99
2000 _ 09
2010 _ 12
不明
Unknown1,336
97
190
99
52
54
92
407
342
3
17
0
0
0
0
0
1
8
8
0
66
0
0
0
0
0
2
25
39
0
79
0
0
0
1
2
6
36
33
1
106
0
0
1
1
5
18
44
37
0
117
0
1
4
5
14
14
50
29
0
199
4
7
22
8
12
18
71
57
0
327
12
72
37
20
11
22
84
69
0
425
81
110
35
17
10
11
89
70
2
165
10
11
8
5
2
14
46
68
1
(再掲)2000∼2012 年
(Re-count) 2000 _ 20122000
2001
2002
2003
2004
2005
2006
2007
2008
2009
2010
2011
2012
11
19
26
21
34
29
47
47
82
91
138
167
37
0
0
2
0
0
0
0
1
0
5
1
4
3
0
1
1
2
2
3
3
1
5
7
13
19
7
0
3
1
0
5
2
9
7
4
5
11
19
3
2
2
4
2
4
3
3
4
10
10
13
18
6
2
1
2
3
7
4
3
7
11
10
12
15
2
2
4
2
1
6
7
9
10
16
14
25
28
4
3
4
11
9
6
5
7
7
13
19
30
32
7
2
4
3
4
4
5
13
10
23
21
33
32
5
0
3
4
3
5
3
5
2
9
12
16
26
26
*(Re-count) : Unknown of previous treatment regimen
表 1 新登録結核患者の年齢階層別・治療歴別患者数,2012 年
Table 1 Number of tuberculosis patients by treatment history and age group, 2012
再治療率 (%):治療歴不明を除く
Proportion of re-treatment tuberculosis patients: those of unknown treatment history excluded LTBI: Latent Tuberculosis Infection
年齢階層
Age group新登録結核
患者
Newly notifi ed tuberculosis patients治療歴
Treatment history再治療率 (%)
Proportion of re-treatment tuberculosis patients (%)初回治療
New 再治療 Re-treatment全再治療
Re-treatment, allLTBI 治療歴有り
(再掲)
Re-treatment, past history of LTBI treatment (re-count)不明
Unknown総数
Total0 _ 4
5 _ 9
10 _ 14
15 _ 19
20 _ 24
25 _ 29
30 _ 34
35 _ 39
40 _ 44
45 _ 49
50 _ 54
55 _ 59
60 _ 64
65 _ 69
70 _ 74
75 _ 79
80 _ 84
85 _ 89
90+
21,283
30
12
21
165
568
720
712
816
850
750
789
1,006
1,537
1,475
1,984
2,611
3,100
2,653
1,484
19,576
30
10
20
151
535
677
675
764
803
686
749
923
1,425
1,355
1,802
2,378
2,813
2,401
1,379
1,336
0
2
1
14
27
39
32
47
45
61
36
81
91
108
140
187
211
162
52
95
0
1
1
12
8
11
9
5
9
10
3
9
5
4
2
4
1
1
0
371
0
0
0
0
6
4
5
5
2
3
4
2
21
12
42
46
76
90
53
6.4
0.0
16.7
4.8
8.5
4.8
5.4
4.5
5.8
5.3
8.2
4.6
8.1
6.0
7.4
7.2
7.3
7.0
6.3
3.6
図 1 新登録結核患者の年齢階層別治療開始時化学療法内容,2012 年
Fig. 1 Initial treatment regimen of newly notifi ed tuberculosis patients by age group, 2012
0
_
5
_
10
_
15
_
20
_
25
_
30
_
35
_
40
_
45
_
50
_
55
_
60
_
65
_
70
_
75
_
80
_
85
_
90+
年齢(歳) Age (yrs)
100
90
80
70
60
50
40
30
20
10
0
%
HRZ+E/S
他HR含む 3 剤以上
≧Other 3 drugs including HR
不明
Unknownその他
Other drugs化療なし
No treatmentHRZ
H : Isoniazid
R : Rifampicin
Z : Pyrazinamide
E : Ethambutol
S : Streptomycin
Total
表 3 治療開始時 PZA 使用者について,治療完遂者の PZA 使用継続状況,2011 年新登録患者
Table 3 Treatment with PZA in initial phase among newly notifi ed tuberculosis patients in 2011
and completed standard treatment
総計
Total Completed (%)治療完遂者
総計
Total2 カ月
2 months1 カ月以上 2 カ月未満
≧ 1 month and < 2 months1 カ月未満
< 1 month不明
Unknown13,650
8,609
607
601
3,833
11,225
8,252 (89.5)
503 (5.5)
463 (5.0)
2,007 ( − )
(%):不明を除く割合 Proportions: unknown cases excluded
PZA: Pyrazinamide
100
90
80
70
60
50
40
30
20
10
0
Total
0
_
5
_
10
_
15
_
20
_
25
_
30
_
35
_
40
_
45
_
50
_
55
_
60
_
65
_
70
_
75
_
80
_
85
_
90
+%
治療なし・不明
Not treated / Unknown
外来
Outpatients
他疾患入院
Hospitalized due mainly
to other diseases
入院
Hospitalized for
tuberculosis treatment
年齢(歳) Age (yrs)
図 2 新登録肺結核患者の治療開始時受療状況別割合,年齢階層別,2012 年
120
140
160
0
20
40
60
80
100
0 _
20 _ 30 _ 40 _ 50 _ 60 _ 70 _ 80 _ 90+
年齢 Age
男 80%ile
Male
女 80%ile
Female
男 50%ile
Male
女 50%ile
Female
日数 Days
図 3 治療開始時結核を主たる理由に入院かつ退院時期情報があった者について,性・年齢階層別入院期間
(中央値および 80% 値),2011 年新登録肺結核喀痰塗抹陽性初回治療者
Fig. 3 Median (50%ile) and 80%ile of duration of hospitalization among those hospitalized with tuberculosis and with known
discharged day, new sputum-smear positive pulmonary tuberculosis patients in 2011 by sex
表 4 治療開始時入院治療者の入院期間,総合患者分類別,2011 年新登録結核患者
Table 4 Duration of hospitalization among newly notifi ed tuberculosis patients receiving initial treatment
at hospital in 2011 by patient classifi cation
新登録活動性結核 Newly notifi ed tuberculosis patients
総数
Total
肺結核 Pulmonary tuberculosis patients
肺外結核 Extra-pulmonary tuberculosis patients 計 Total 喀痰塗抹陽性 Sputum-smear positive その他の 結核菌陽性 Other bacteriologically positive 菌陰性・ その他 Bacteriologically negative and others 初回治療 New Re-treatment再治療
総数
Total入院
Hospitalized with tuberculosis退院日入力
Known date of discharge22,508
10,922
8,690
17,449
9,510
7,743
7,736
7,046
5,872
747
641
532
6,049
1,475
1,108
2,917
348
231
5,059
1,412
947
入院患者で退院日が入力された者の入院期間 (*)
Duration of hospitalization among those hospitalized with tuberculosis and with known date of discharge (*)
中央値(日)
Median (days)80% 値(日)
80%ile (days)64
114
66
116
70
118
72
122
44
95
39
107
43
99
*退院理由は問わず *Irrespective of the reason for discharge from hospital
に従って入院治療が直線的に増加する傾向も,前年と同
様であった。
( 5 )入院期間(表 4 ・図 3 )
2011 年新登録結核患者で結核治療を主たる理由に入
院治療が実施された者のうち,退院日(死亡退院を含
む)が入力された者について,入院期間を総合患者分類
別に集計したものを表 4 に示す。入院期間は中央値と
80% 値を代表値として示した。これらの数値は前年とほ
ぼ同様で,入院期間の変動はみられず,各結核病棟での
退院基準が既に固定しており,結核病床数が一定してい
る地域では,患者数の減少から結核病床の空床率が増加
し続けていることを推測させる。表 4 の対象者中肺結核
喀痰塗抹陽性初回治療の入院期間代表値を,性・年齢階
層別に集計したものを図 3 に示す。前年同様,女性では
2011 年の新登録活動性結核患者で治療開始時に PZA
を含む治療を開始した 13,650 人について,PZA の服薬期
間に関する集計を表 3 に示す。前年とほぼ同様に,治療
完遂者のうち約 10% で PZA 投与期間が 2 カ月に及ばず,
標準治療どおりに治療を行えない状況である。
受 療 状 況
( 4 )受療状況(図 2 )
2012 年の新登録肺結核患者 16,432 人の治療開始時受
療状況について,年齢 5 歳階層別にみたものを図 2 に示
す。ここでの「入院」とは入院勧告の有無にかかわらず,
結核の治療を主たる理由とする入院の意味である。新登
録肺結核患者の治療開始時受療状況の各割合(%)は前
年とほとんど変化はなく,30 歳以降年齢階層が高くなる
表 5 前年(2010 年,2011 年)新登録治療開始者の各次年末時(2011 年,2012 年)治療終了状況および治療期間,総合患者分類別
Table 5 Treatment status and duration of treatment at the end of the following years (2011/2012) among those newly notifi ed and started
tuberculosis treatment in the previous years (2010/2011) by patient classifi cation
*2011 年年報データによる Based on the annual report database in 2011
**2012 年年報データによる Based on the annual report database in 2012
#
対象者数:年末時点 (2011 年,2012 年)で治療完遂者と登録中かつ治療終了が未入力で治療継続中の者
Subjects : Those who completed tuberculosis treatment or those who were still receiving treatment at the end of the years (2011/2012) LTBI : Latent tuberculosis infection
新登録活動性結核 Newly notifi ed tuberculosis patients
(別掲) 潜在性結核 感染症 (Not included in the total) LTBI 総数 Total
肺結核 Pulmonary tuberculosis patients
肺外結核 Extra-pulmonary tuberculosis patients 計 Total 喀痰塗抹陽性 Sputum-smear positive 結核菌陽性その他の Other bacteriologically positive 菌陰性・ その他 Bacteriologically negative and others 初回治療 New Re-treatment再治療 2010 年新登録者数* New cases in 2010* 治療開始時入院 ⁄外来
Known treatment status
治療終了 Stopped treatment 治療終了(完遂) Completed 治療中止(指示) Others 自己中止 Defaulted 不明 Unknown 23,155 22,612 (100%) 18,010 (79.6) 16,072 (71.1) 1,732 ( 7.7) 197 ( 0.9) 9 ( 0.0) 18,277 17,819 (100%) 14,207 (79.7) 12,704 (71.3) 1,336 ( 7.5) 160 ( 0.9) 7 ( 0.0) 8,242 8,068 (100%) 6,106 (75.7) 5,294 (65.6) 735 (9.1) 72 (0.9) 5 (0.1) 794 780 (100%) 566 (72.6) 475 (60.9) 82 (10.5) 9 ( 1.2) 0 ( 0.0) 6,358 6,138 (100%) 5,098 (83.1) 4,694 (76.5) 361 ( 5.9) 41 ( 0.7) 2 ( 0.0) 2,883 2,833 (100%) 2,437 (86.0) 2,241 (79.1) 158 ( 5.6) 38 ( 1.3) 0 ( 0.0) 4,878 4,793 (100%) 3,803 (79.3) 3,368 (70.3) 396 ( 8.3) 37 ( 0.8) 2 ( 0.0) 4,902 4,826 (100%) 4,461 (92.4) 4,018 (83.3) 337 ( 7.0) 99 ( 2.1) 7 ( 0.1) 2011 年末治療完遂あるいは治療継続中の治療期間
Median of duration of treatment among those completed treatment and still receiving treatment
対象者数# Subjects# 17,435 13,698 5,740 547 5,002 2,409 3,737 4,225 中央値(日) Median (days) 272 272 276 290 244 197 272 183 2011 年新登録者数** New cases in 2011** 治療開始時入院 ⁄外来
Known treatment status
治療終了 Stopped treatment
治療終了(完遂) Completed
治療中止(指示) Others
自己中止 Defaulted
行方不明 ⁄帰国 ⁄死亡 Missing/Moved out of Japan/Dead
不明 Unknown 22,508 21,984 (100%) 18,525 (84.3) 16,099 (73.2) 1,398 ( 6.4) 178 ( 0.8) 838 ( 3.8) 12 ( 0.1) 17,449 17,001 (100%) 14,318 (84.2) 12,493 (73.5) 1,009 ( 5.9) 147 ( 0.9) 658 ( 3.9) 11 ( 0.1) 7,736 7,587 (100%) 6,126 (80.7) 5,118 (67.5) 546 ( 7.2) 60 ( 0.8) 399 ( 5.3) 3 ( 0.0) 747 734 (100%) 574 (78.2) 461 (62.8) 62 ( 8.4) 8 ( 1.1) 42 ( 5.7) 1 ( 0.1) 6,049 5,825 (100%) 5,058 (86.8) 4,570 (78.5) 271 ( 4.7) 49 ( 0.8) 166 ( 2.8) 2 ( 0.0) 2,917 2,855 (100%) 2,560 (89.7) 2,344 (82.1) 130 ( 4.6) 30 ( 1.1) 51 ( 1.8) 5 ( 0.2) 5,059 4,983 (100%) 4,207 (84.4) 3,606 (72.4) 389 ( 7.8) 31 ( 0.6) 180 ( 3.6) 1 ( 0.0) 10,096 10,015 (100%) 9,318 (93.0) 8,232 (82.2) 899 ( 9.0) 170 ( 1.7) 11 ( 0.1) 6 ( 0.1) 2012 年末治療完遂あるいは治療継続中の治療期間
Median of duration of treatment among those completed treatment and still receiving treatment
対象者数# Subjects# 16,742 12,930 5,299 491 4,718 2,422 3,812 8,609 中央値(日) Median (days) 273 272 276 288 269 196 274 184
年齢と共に入院期間が増加する傾向にあるが,男性では
50∼60 歳代のピーク以降入院期間は減少しており,その
理由は不明である。
( 6 )治療期間(表 5 )
表 5 は,2011 年と 2012 年の年報情報を用いて,それ
ぞれの前年に新規に登録された全結核患者と潜在性結核
感染症治療対象者について,2011 年および 2012 年年末
までの治療終了状況をみたものである。治療完遂者と治
療継続中の者を対象に,総合患者分類別に治療期間(中
央値)を算出して表示した。治療期間の中央値は前年同
様で,全結核患者 273 日・肺結核喀痰塗抹陽性初回治療
患者 276 日でほとんど変化はなく,大半の例で PZA を使
用した化学療法が開始されているにもかかわらず,平均
的な治療期間は約 9 カ月となっている。
治 療 成 績
( 7 )肺結核患者分類別治療成績(表 6 ・表 7 )
2011 年新登録肺結核患者をコホートとする治療成績
は,菌培養検査結果,受療状況,治療終了理由ならびに
登録除外理由等から 17 の区分にコンピュータにより自
動的に分類されるが(2010 年までは 15 区分,表 7 ),結
核年報での治療成績においては,
「治療成功」から「判
定不能」までの 7 区分にまとめたものが用いられている
(表 6 )。「治療成功」割合は,総合患者分類別でみると,
「喀痰塗抹陽性」でやや低い傾向が続いており
1),
「初回
治療」で 50.6%,「再治療」で 41.2%,「他結核菌陽性」
で 58.0%,「結核菌陰性・その他」で 62.5% であった(表
6 )。「死亡」は,理由は問わず結核治療中に死亡した場
合で,その割合は「喀痰塗抹陽性」で高く,
「初回治療」
で 21.6%,
「再治療」で 21.3% であったが,
「結核菌陰性・
その他」では 6.3% と低かった。「脱落・中断」の割合は,
「喀痰塗抹陽性」より「結核菌陰性・その他」で高い傾
向があり,これは,治療期間が標準治療期間に満たない
「脱落 2 」の割合が高い(8.1%)ことによる。「12 カ月を
表 6 2011 年新登録肺結核患者の総合患者分類別によるコホート治療成績
Table 6 Treatment outcome of newly notifi ed pulmonary tuberculosis patients by patient classifi cation, 2011 year cohort
肺結核 Pulmonary tuberculosis patients
総数 Total 喀痰塗抹陽性 Sputum-smear positive 他結核菌陽性 Other bacteriologically positive 結核菌陰性・ その他 Bacteriologically negative and others 初回治療 New Re-treatment再治療
新登録肺結核患者数
New pulmonary tuberculosis patients
17,449 (100%)
7,736 (100%)
747 (100%)
6,049 (100%)
2,917 (100%)
治療成績
Treatment outcomes (*)1. 治療成功
Treatment success治癒
Cure治療完了
Treatment completed治療完了 1
Treatment completed 1治療完了 2
Treatment completed 22. 死亡
Died3. 治療失敗
Treatment failure4. 脱落・中断
Lost to follow up脱落 1
Lost to follow up 1脱落 2
Lost to follow up 25. 転出
Transfer out6. 12 カ月超治療
Still on treatment12 カ月超 1
Still on treatment 112 カ月超 2
Still on treatment 212 カ月超 3
Still on treatment 312 カ月超 4
Still on treatment 47. 判定不能
Unclassifi ed判定不能 1
Unclassifi ed 1判定不能 2
Unclassifi ed 2判定不能 3
Unclassifi ed 3判定不能 4
Unclassifi ed 4判定不能 5
Unclassifi ed 59,550
2,764
6,786
4,535
2,251
2,754
173
1,004
262
742
513
1,671
272
203
569
627
1,784
149
142
766
105
622
54.7
15.8
38.9
26.0
12.9
15.8
1.0
5.8
1.5
4.3
2.9
9.6
1.6
1.2
3.3
3.6
10.2
0.9
0.8
4.4
0.6
3.6
3,911
1,544
2,367
1,600
767
1,673
56
255
82
173
250
867
140
104
318
305
724
58
80
319
31
236
50.6
20.0
30.6
20.7
9.9
21.6
0.7
3.3
1.1
2.2
3.2
11.2
1.8
1.3
4.1
3.9
9.4
0.7
1.0
4.1
0.4
3.1
308
136
172
117
55
159
10
25
13
12
32
114
22
9
34
49
99
5
8
56
3
27
41.2
18.2
23.0
15.7
7.4
21.3
1.3
3.3
1.7
1.6
4.3
15.3
2.9
1.2
4.6
6.6
13.3
0.7
1.1
7.5
0.4
3.6
3,508
779
2,729
1,301
1,428
739
100
406
85
321
136
515
88
64
173
190
645
66
37
278
53
211
58.0
12.9
45.1
21.5
23.6
12.2
1.7
6.7
1.4
5.3
2.2
8.5
1.5
1.1
2.9
3.1
10.7
1.1
0.6
4.6
0.9
3.5
1,823
305
1,518
1,517
1
183
7
318
82
236
95
175
22
26
44
83
316
20
17
113
18
148
62.5
10.5
52.0
52.0
0.0
6.3
0.2
10.9
2.8
8.1
3.3
6.0
0.8
0.9
1.5
2.8
10.8
0.7
0.6
3.9
0.6
5.1
* 治療成績:表 7 参照。治療開始せず(主に早期に死亡),化療内容不明,非標準治療で開始,途中から最後まで INH あるいは RFP 使用 中止,その他情報不足を含む。*Treatment outcomes: See Table 7. It includes those who did not start tuberculosis treatment (mostly caused by early death), those whose initial treatment regimen is unknown, those whose treatment is other than standard treatment, those who stopped INH and/or RFP before treatment completion, and those whose information is insuffi cient for classifying treatment outcomes.
INH: Isoniazid, RFP: Rifampicin
超える治療」の割合は,
「喀痰塗抹陽性再治療」では
15.3% と高く,
「結核菌陰性・その他」(6.0%)の約 2.5 倍
であった。結核治療を開始しなかった「判定不能 1 」は
2010 年登録患者での数(446 人,2.4%)よりも大幅に減
少し
1),149 人(0.9%)であった。一方,非標準治療によ
り治療を開始した「判定不能 3 」は 766 人(4.4%),治療
成績判定のための情報が不足していた「判定不能 5 」は
622 人(3.6%)であった(表 6 )。
表 7 にコホート法による治療成績 17 区分の各定義と,
喀痰塗抹陽性初回治療肺結核患者の過去 5 年間の治療成
績推移を示した。「脱落 1 」と「脱落 2 」とを合わせた
「脱落・中断」は,過去 5 年間で 5.0%,3.8%,3.7%,2.9
%,3.3% と,5.0% 以下を維持しているが,
「治癒」・「治
療完了 1 」・「治療完了 2 」を合わせた「治療成功」は
45.5%,47.7%,51.7%,52.0%,50.6% と横ばい傾向であ
った。治療開始時の化療内容が未入力だった「判定不能
2 」は 減 少 傾 向 に あ る が(2009 年 1.4%,2010 年 1.2%,
2011 年 1.0%),
「判定不能 5 」は横ばいであった(2009 年
2.9%,2010 年 3.5%,2011 年 3.1%)。
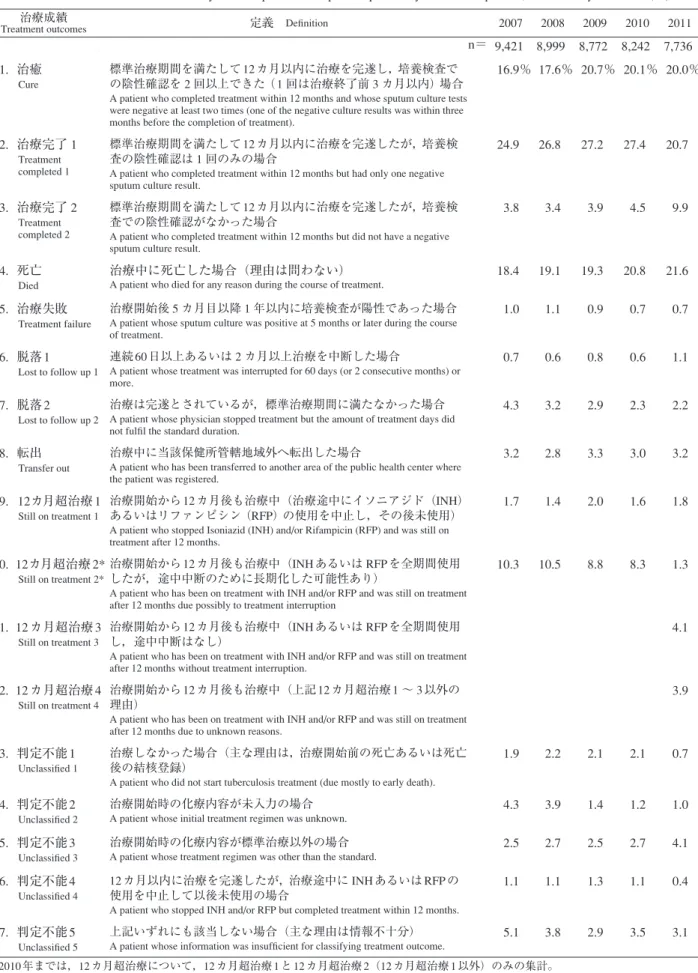
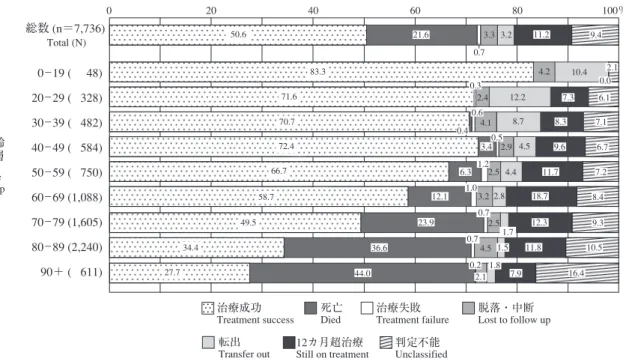
( 8 )年齢階層別治療成績(図 4 )
図 4 は,2011 年に登録された喀痰塗抹陽性初回治療者
7,736 人について,年齢階層別に治療成績を比較したも
のである。わが国の治療成績では「死亡」割合が高く,
全体で 21.6% を占めている。年齢階層別の「死亡」割合
では,30 歳代で 0.4%,40 歳代で 3.4% であるが,70 歳代,
80 歳代,90 歳以上ではそれぞれ 23.9%,36.6%,44.0% と
非常に高い傾向は,例年どおりであった。「12 カ月を超
える治療」の割合は 50 歳代から 80 歳代で高く,治療中
の他保健所への「転出」は 20 歳代で最も高く 12.2% で
あった。
転帰と死亡
( 9 )転帰(表 8 )
表 8 は,2011 年と 2012 年の結核登録者情報システム
年報情報を用いて,2010 年と 2011 年に新規登録された
全結核患者と潜在性結核感染症治療対象者について,そ
れぞれ 2011 年末と 2012 年末までの登録除外状況をみた
ものである。喀痰塗抹陽性肺結核患者では「死亡」で除
表 7 治療成績区分と定義および新登録喀痰塗抹陽性初回治療肺結核患者の治療成績(率),2007∼2011 年コホート
Table 7 Treatment outcomes of newly notifi ed sputum-smear positive pulmonary tuberculosis patients, 2007_2011 year cohorts (%)
治療成績
Treatment outcomes
定義
Defi nition2007
2008
2009
2010
2011
n= 9,421 8,999 8,772 8,242 7,736
1. 治癒
Cure
標準治療期間を満たして 12 カ月以内に治療を完遂し,培養検査で
の陰性確認を 2 回以上できた( 1 回は治療終了前 3 カ月以内)場合
A patient who completed treatment within 12 months and whose sputum culture tests were negative at least two times (one of the negative culture results was within three months before the completion of treatment).
16.9% 17.6% 20.7% 20.1% 20.0%
2. 治療完了 1
Treatment
completed 1
標準治療期間を満たして 12 カ月以内に治療を完遂したが,培養検
査の陰性確認は 1 回のみの場合
A patient who completed treatment within 12 months but had only one negative sputum culture result.
24.9 26.8 27.2 27.4 20.7
3. 治療完了 2
Treatment
completed 2
標準治療期間を満たして 12 カ月以内に治療を完遂したが,培養検
査での陰性確認がなかった場合
A patient who completed treatment within 12 months but did not have a negative sputum culture result.
3.8 3.4
3.9
4.5
9.9
4. 死亡
Died
治療中に死亡した場合(理由は問わない)
A patient who died for any reason during the course of treatment.
18.4 19.1 19.3 20.8 21.6
5. 治療失敗
Treatment failure
治療開始後 5 カ月目以降 1 年以内に培養検査が陽性であった場合
A patient whose sputum culture was positive at 5 months or later during the course of treatment.
1.0 1.1
0.9
0.7
0.7
6. 脱落 1
Lost to follow up 1
連続 60 日以上あるいは 2 カ月以上治療を中断した場合
A patient whose treatment was interrupted for 60 days (or 2 consecutive months) or more.
0.7 0.6
0.8
0.6
1.1
7. 脱落 2
Lost to follow up 2
治療は完遂とされているが,標準治療期間に満たなかった場合
A patient whose physician stopped treatment but the amount of treatment days did not fulfi l the standard duration.
4.3 3.2
2.9
2.3
2.2
8. 転出
Transfer out
治療中に当該保健所管轄地域外へ転出した場合
A patient who has been transferred to another area of the public health center where the patient was registered.
3.2 2.8
3.3
3.0
3.2
9. 12カ月超治療 1
Still on treatment 1
治療開始から 12 カ月後も治療中(治療途中にイソニアジド(INH)
あるいはリファンピシン(RFP)の使用を中止し,その後未使用)
A patient who stopped Isoniazid (INH) and/or Rifampicin (RFP) and was still on treatment after 12 months.
1.7 1.4
2.0
1.6
1.8
10. 12カ月超治療 2*
Still on treatment 2*
治療開始から 12 カ月後も治療中(INH あるいは RFP を全期間使用
したが,途中中断のために長期化した可能性あり)
A patient who has been on treatment with INH and/or RFP and was still on treatment after 12 months due possibly to treatment interruption
10.3 10.5
8.8
8.3
1.3
11. 12 カ月超治療 3
Still on treatment 3
治療開始から 12 カ月後も治療中(INH あるいは RFP を全期間使用
し,途中中断はなし)
A patient who has been on treatment with INH and/or RFP and was still on treatment after 12 months without treatment interruption.
4.1
12. 12 カ月超治療 4
Still on treatment 4
治療開始から 12 カ月後も治療中(上記 12 カ月超治療 1 ∼ 3 以外の
理由)
A patient who has been on treatment with INH and/or RFP and was still on treatment after 12 months due to unknown reasons.
3.9
13. 判定不能 1
Unclassifi ed 1
治療しなかった場合(主な理由は,治療開始前の死亡あるいは死亡
後の結核登録)
A patient who did not start tuberculosis treatment (due mostly to early death).
1.9 2.2
2.1
2.1
0.7
14. 判定不能 2
Unclassifi ed 2
治療開始時の化療内容が未入力の場合
A patient whose initial treatment regimen was unknown.
4.3 3.9
1.4
1.2
1.0
15. 判定不能 3
Unclassifi ed 3
治療開始時の化療内容が標準治療以外の場合
A patient whose treatment regimen was other than the standard.
2.5 2.7
2.5
2.7
4.1
16. 判定不能 4
Unclassifi ed 4
12 カ月以内に治療を完遂したが,治療途中に INH あるいは RFP の
使用を中止して以後未使用の場合
A patient who stopped INH and/or RFP but completed treatment within 12 months.
1.1 1.1
1.3
1.1
0.4
17. 判定不能 5
Unclassifi ed 5
上記いずれにも該当しない場合(主な理由は情報不十分)
A patient whose information was insuffi cient for classifying treatment outcome.
5.1 3.8
2.9
3.5
3.1
*2010 年までは,12 カ月超治療について,12 カ月超治療 1 と 12 カ月超治療 2(12 カ月超治療 1 以外)のみの集計。 2011 年は,2010 年までの 12 カ月超治療 2 を細分化して 12 カ月超治療 1 ∼ 4 で集計している。
表 8 前年(2010 年,2011 年)新登録者の年末時(2011 年末,2012 年末)登録除外状況および除外理由,総合患者分類別
Table 8 Number (proportion) of patients excluded from tuberculosis registration by the end of years (in 2011 and in 2012) among those
newly notifi ed tuberculosis patients and LTBI patients in the previous years (in 2010, in 2011) by patient classifi cation
新登録活動性結核 Newly notifi ed tuberculosis patients
(別掲) 潜在性結核 感染症 LTBI patients (Not included in the total) 肺結核 Pulmonary tuberculosis 肺外結核 Extra-pulmonary 総数 Total 肺結核計 Sub-total (Pulmonary tuberculosis) 喀痰塗抹陽性
Sputum-smear positive 他結核菌陽性Other bacteriologically positive 菌陰性結核 Bacteriologically negative 初回治療 New Re-treatment再治療 2010 年新登録者数 *
New tuberculosis cases in 2010* 23,155 (100%) 18,277 (100%) 8,242 (100%) 794 (100%) 6,358 (100%) 2,883 (100%) 4,878 (100%) 4,902 (100%)
2011 年末時までの除外者計
Total number of patients excluded from tuberculosis registration by the end of 2011
観察不要 No need for follow-up
死亡 Died
結核死 Tuberculosis death
結核外死 Other death
転出 Transfer out
登録中の再登録
Re-treatment during registration
その他の理由 Other reasons 6,372 (27.5) 239 ( 1.0) 4,935 (21.3) 1,484 ( 6.4) 3,451 (14.9) 934 ( 4.0) 149 ( 0.6) 115 ( 0.5) 5,086 (27.8) 111 ( 0.6) 3,964 (21.7) 1,266 ( 6.9) 2,698 (14.8) 793 ( 4.3) 127 ( 0.7) 91 ( 0.5) 2,744 (33.3) 10 ( 0.1) 2,293 (27.8) 957 (11.6) 1,336 (16.2) 358 ( 4.3) 55 ( 0.7) 28 ( 0.3) 272 (34.3) 0 ( 0.0) 234 (29.5) 77 ( 9.7) 157 (19.8) 24 ( 3.0) 9 ( 1.1) 5 ( 0.6) 1,547 (24.3) 43 ( 0.7) 1,160 (18.2) 188 ( 3.0) 972 (15.3) 263 ( 4.1) 44 ( 0.7) 37 ( 0.6) 523 (18.1) 58 ( 2.0) 277 ( 9.6) 44 ( 1.5) 233 ( 8.1) 148 ( 5.1) 19 ( 0.7) 21 ( 0.7) 1,286 (26.4) 128 ( 2.6) 971 (19.9) 218 ( 4.5) 753 (15.4) 141 ( 2.9) 22 ( 0.5) 24 ( 0.5) 843 (17.2) 431 ( 8.8) 41 ( 0.8) 1 ( 0.0) 40 ( 0.8) 263 ( 5.4) 28 ( 0.6) 80 ( 1.6) 2011 年新登録者数 **
New tuberculosis cases in 2011** 22,508 (100%) 17,449 (100%) 7,736 (100%) 747 (100%) 6,049 (100%) 2,917 (100%) 5,059 (100%)10,096 (100%)
2012 年末時までの除外者計
Total number of patients excluded from tuberculosis registration by the end of 2012
観察不要 No need for follow-up
死亡 Died
結核死 Tuberculosis death
結核外死 Other death
転出 Transfer out
登録中の再登録
Re-treatment during registration
その他の理由 Other reasons 6,385 (28.4) 136 ( 0.6) 5,050 (22.4) 1,502 ( 6.7) 3,548 (15.8) 983 ( 4.4) 138 ( 0.6) 78 ( 0.3) 5,045 (28.9) 48 ( 0.3) 3,994 (22.9) 1,258 ( 7.2) 2,736 (15.7) 828 ( 4.7) 118 ( 0.7) 57 ( 0.3) 2,710 (35.0) 5 ( 0.1) 2,267 (29.3) 932 (12.0) 1,335 (17.3) 354 ( 4.6) 65 ( 0.8) 19 ( 0.2) 279 (37.3) 1 ( 0.1) 227 (30.4) 80 (10.7) 147 (19.7) 47 ( 6.3) 4 ( 0.5) 0 ( 0.0) 1,532 (25.3) 16 ( 0.3) 1,206 (19.9) 184 ( 3.0) 1,022 (16.9) 255 ( 4.2) 34 ( 0.6) 21 ( 0.3) 524 (18.0) 26 ( 0.9) 294 (10.1) 62 ( 2.1) 232 ( 8.0) 172 ( 5.9) 15 ( 0.5) 17 ( 0.6) 1,340 (26.5) 88 ( 1.7) 1,056 (20.9) 244 ( 4.8) 812 (16.1) 155 ( 3.1) 20 ( 0.4) 21 ( 0.4) 1,240 (12.3) 465 ( 4.6) 65 ( 0.6) 0 ( 0.0) 65 ( 0.6) 592 ( 5.9) 51 ( 0.5) 67 ( 0.7)
*2011 年結核年報データによる Based on the annual report database in 2011.
**2012 年結核年報データによる Based on the annual report database in 2012.
LTBI : Latent Tuberculosis Infection
図 4 2011 年新登録肺結核喀痰塗抹陽性初回治療者の年齢階層別コホート法による治療成績(%)
Fig. 4 Treatment outcomes of newly notifi ed sputum-smear positive pulmonary tuberculosis patients by age group,
2011 year cohort (%)
...
..
...
総数 (n=7,736)
0 _ 19 ( 48)
20 _ 29 ( 328)
30 _ 39 ( 482)
40 _ 49 ( 584)
50 _ 59 ( 750)
60 _ 69 (1,088)
70 _ 79 (1,605)
80 _ 89 (2,240)
90+ ( 611)
年齢
階層
0 20 40 60 80 100% 治療成功Treatment success 死亡Died 治療失敗Treatment failure
転出
Transfer out 12カ月超治療Still on treatment 判定不能Unclassified
脱落・中断 Lost to follow up Age group Total (N) 50.6 83.3 71.6 70.7 72.4 66.7 58.7 21.6 11.2 9.4 7.3 10.4 4.2 2.4 4.1 2.9 12.2 2.1 6.1 8.3 8.7 7.1 3.4 4.5 9.6 6.7 0.0 0.3 0.6 0.4 0.5 2.5 6.3 1.2 4.4 11.7 7.2 1.7 1.5 3.2 12.1 2.8 2.5 4.5 8.4 18.7 23.9 36.6 44.0 9.3 12.3 10.5 11.8 7.9 16.4 1.0 0.7 0.7 0.2 1.8 2.1 3.2 3.3 0.7 49.5 34.4 27.7
図 5 2011 年新登録結核患者中治療開始後 1 年以内死亡者の時期別累積死亡割合(%)
Fig. 5 Cumulative proportion of deaths among newly notifi ed tuberculosis patients in 2011, by period from the
beginning of treatment through one year
_30*: 死亡後登録・治療前死亡を含む _30*: Includes cases who died before the commencement of treatment.
TB: tuberculosis
日数
Days(%)
30
25
20
15
10
5
0
_ 30* _
60 _ 90
_ 120 _ 150 _ 180 _ 210 _ 240 _ 270 _ 300 _ 330 _ 365
日数
Days(%)
30
25
20
15
10
5
0
_ 30* _
60 _ 90
_ 120 _ 150 _ 180 _ 210 _ 240 _ 270 _ 300 _ 330 _ 365
日数
Days(%)
30
25
20
15
10
5
0
_ 30* _
60 _ 90
_ 120 _ 150 _ 180 _ 210 _ 240 _ 270 _ 300 _ 330 _ 365
他死亡
Other death結核死亡
TB death全結核患者
All forms of tuberculosis patients喀痰塗抹陽性肺結核
初回治療
New sputum smear positive pulmonary tuberculosis patients
喀痰塗抹陽性肺結核
再治療
Re-treatment sputum smear positive pulmonary tuberculosis patients