A06
Flash Flooding Simulation Using Hydrological Modeling of Wadi Basins at Nile River Based on
Satellite Remote Sensing Data
〇Mohamed SABER, Toshio HAMAGUCHI, Toshiharu KOJIRI, Kenji TANAKA
In arid regions, the flash flood is characterized as flood leading to damage caused by heavy rainfall for short duration, steep slope and impervious layer as well as climate change which make it more sever and devastating. Due to the scarcity of high quality observations, a trial is made to use Global Satellite Mapping of Precipitation (GSMaP) for flash flooding simulation in wadi basins. It has been compared with the monitored data of Global Precipitation Climatology Centre (GPCC); gauge-based gridded monthly precipitation data sets. Monthly and 1.0° x 1.0° spatial resolutions data is used. Statistics analysis has been done to calculate the bias of these data for different arid areas such as, N. Africa, Arabian Peninsula, S. Africa, South-West USA, Australia, China. The results of comparative show an acceptable agreement between GSMaP and GPCC in some regions such as china, Australia and S. Africa as shown in Fig. 1 but GSMaP data has a seasonal small bias as overestimated or underestimated in other regions such as in Egypt. HydroBEAM as a physical-based hydrological model is used to simulate various flash flooding events at wadi outlets of Nile River using GSMaP data (Fig. 2). The simulation has been done to the flood event which hit Egypt on Jan. 18-20, 2010; it was devastating where some people died with a big demolition of their infrastructure. The simulated results present remarkable characteristics of flash flood hydrograph as reaching to maximum peak flow more than (200 m3/s) throughout short time at the selected outlets 1 and 2 as depicted in (Fig. 3). It can be concluded that GSMaP can be used with or
without bias correction based on the selected regions as well as the proposed model of HydroBEAM using such Satellite Remote Sensing data can be applied effectively for flash flood forecasting at different wadi basins in arid and semi-arid regions.
0 20 40 60 80 100 120 140 1 13 25 37 G S M aP a nd G P C C ( m m /month) Month 2003-2006 GPCC GSMaP
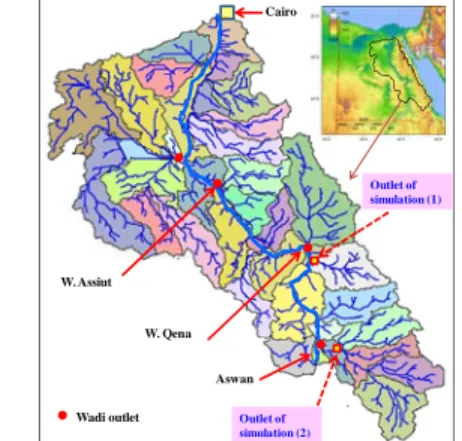
Fig.1 A comparative between GSMaP and GPCC Data in South Africa. Wadi outlet W. Assiut W. Qena Aswan Cairo Outlet of simulation (1) Outlet of simulation (2)
Fig. 2 Wadi catchments of Nile River Basin in Egypt
0 0.5 1 1.5 2 2.5 3 3.5 4 4.5 5 0 50 100 150 200 250 300 1 24 47 70 93 116 139 162 Di c h a r g e (m 3 /s ) Time (hour) Rainfall Discharge (outlet 1) Discharge (outlet 2) R a in fa ll( m m )