Title Studies on the Role of Oxidative Stress in Mutagenesis by UsingNrf2-deficient Mice( 本文(Fulltext) ) Author(s) 土屋, 卓磨 Report No.(Doctoral Degree) 博士(獣医学) 甲第509号 Issue Date 2018-09-21 Type 博士論文 Version ETD URL http://hdl.handle.net/20.500.12099/77270 ※この資料の著作権は、各資料の著者・学協会・出版社等に帰属します。
Studies on the Role of Oxidative Stress in
Mutagenesis by Using Nrf2-deficient Mice
㸦
Nrf2 Ḟᦆ࣐࢘ࢫࢆ⏝࠸ࡓኚ␗ཎᛶ࠾ࡅࡿ
㓟ࢫࢺࣞࢫࡢᙺ㛵ࡍࡿ◊✲㸧
2018
The United Graduate School of Veterinary Sciences, Gifu University
(Gifu University)
Studies on the Role of Oxidative Stress in
Mutagenesis by Using Nrf2-deficient Mice
㸦
Nrf2 Ḟᦆ࣐࢘ࢫࢆ⏝࠸ࡓኚ␗ཎᛶ࠾ࡅࡿ
㓟ࢫࢺࣞࢫࡢᙺ㛵ࡍࡿ◊✲㸧
Contents
Abbreviations
General Introduction ... 1
Chapter 1 Role of oxidative stress in the chemical structure-related genotoxicity of nitrofurantoin in Nrf2-deficient gpt delta mice ... 5
Introduction ... 6
Materials and Methods ... 8
Results ... 13
Discussion ... 15
Abstract ... 18
Figures and Tables ... 19
Chapter 2 Mechanisms of oxidative stress-induced in vivo mutagenicity by potassium bromate and nitrofurantoin ... 29
Introduction ... 30
Materials and Methods ... 33
Results ... 38
Discussion ... 41
Abstract ... 44
Figures and Tables ... 45
General Discussion ... 60
Acknowledgement ... 65 References ... 66
Abbreviations
6-TG: 6-thioguanine
6-TGR: 6-thioguanine resistant
8-OHdG: 8-hydroxydeoxyguanosine ARE: antioxidant response element
BER: base excision repair
BW: body weight
bp: base pair
CmR: chloramphenicol resistant
DSBs: double-strand breaks
E. coli: Escherichia coli
GST: glutathione S-transferase
HO1: heme oxygenase 1
KBrO3: potassium bromate
KEAP1: Kelch-like ECH-associated protein 1
MFs: mutant frequencies
MW: molecular weight
NFA: 5-nitro-2-furaldehyde
NFT: nitrofurantoin
NRF2: nuclear factor erythroid 2-related factor 2
Nrf2+/+: Nrf2-proficient
NQO1: NAD(P)H:quinone oxidoreductase 1
PCR: polymerase chain reaction
ppm: parts per million
ROS: reactive oxygen species
SD: standard deviation
SDS-PAGE: SDS-polyacrylamide gel electrophoresi TBARS: thiobarbituric acid-reactive substances
- 1 -
General Introduction
Since there are many carcinogenic substances in the environment: medicines, industrial products, mold poisons, air pollutants, and food additives, we are always in danger of them. The assessment of carcinogenesis risk in chemical substances such as food additives and residual pesticides which are ingested by humans through the diet is one of the most important issues for the public health. Carcinogenic substances are classified by their mechanisms into two types: one is genotoxic carcinogens and another is non-genotoxic carcinogens. Genotoxic carcinogens have no threshold because of the direct action to DNA. The risk of these carcinogens is thought to be very severe (10, 41). On the other hand, non-genotoxic carcinogens exert their carcinogenic potential through the effects to the proliferation, enzymes, oxidative stress, and so on, and they are thought to have each threshold (11). For these reasons, clarifying the mechanisms of non-genotoxic carcinogens is necessary for their risk assessment.
Recently, oxidative stress is well known as a key factor of chemical carcinogenesis. A lot of types of the role of oxidative stress in chemical carcinogenesis have been demonstrated in many studies. Oxidative stress involves in chemical carcinogenesis as a promoter in so-called two-step carcinogenesis model by stimulating the proliferation of initiated cells (29, 37, 44). On the other hand, oxidative stress might act as an initiator (37, 42, 45, 57). While repairing the oxidative DNA damages which is formed by the chemical-induced reactive oxygen species (ROS), the error of repair of these lesions can lead to gene mutations (38, 39). The renal tubule in the kidney is a main target of oxidative stress. The kidney is exposed to many chemical substances
- 2 -
during excretion and reabsorption, and redox cycles act vigorously accompanied with the production of ROS in the process (47, 60). Therefore, oxidative stress is considered to take a crucial role in renal carcinogenesis.
Gpt delta rats and mice are the transgenic animal models which can detect in vivo mutagenicity in the target organs. In the animals, lambda EG10 DNA derived from Escherichia. coli is transfected, and the chemical-induced mutations in the DNA in each target organ are evaluated. In vivo mutation assay is consists of 6-thioguanine (6-TG) and Spi– selection, which can detect point mutation and deletion mutation, respectively
(34, 40). This animal model can play an important role in the investigation about the mechanism and risk of chemical-induced carcinogenesis in rodents. Actually, our previous studies have clarified in vivo mutagenicity in environmental carcinogenic substances (27, 34, 55).
The redox-sensitive transcription factor nuclear factor erythroid 2-related factor 2 (NRF2) regulates cellular responses to oxidative stress in cooperation with Kelch-like ECH-associated protein 1 (KEAP1). Oxidative stress causes translocation of NRF2 from cytoplasm into the nucleus, where it can bind to the antioxidant response element (ARE) and consequently transactivate ARE-bearing genes encoding anti-oxidant-related enzymes (23, 32). In this way, NRF2-ARE pathway protects cells from oxidative stress. Thus, Nrf2-deficient (Nrf2-/-) mice show high-sensitivity to oxidative stress, and they
play a role in the investigation of involvement of oxidative stress in chemical-induced toxicity. In addition, Nrf2-/- gpt delta mice created from Nrf2-/- mice and gpt delta mice
- 3 -
are new useful tools in the research for the role of oxidative stress in chemical-induced mutagenesis.
Nitrofurantoin (NFT), an antimicrobial compound, and potassium bromate (KBrO3), a food additive developed as a flour treatment agent, are chemical substances
potentially ingested by humans through food. However, they both induce renal tumor in rats, and are prohibited or restricted in use currently for the concern about carcinogenesis risk in humans (9, 13, 18, 20, 21). At the same time, the oxidative stress-inducing potential is suspected from their chemical structure. NFT and KBrO3
have a nitro group and bromate ion, respectively. Reduction of nitro group might induce oxidative stress, and bromate ion has a potential as an oxidant agent. For these reasons, the involvement of oxidative stress is suspected in their renal carcinogenesis (1, 2, 3, 4, 26, 56, 59).
8-hydroxydeoxyguanosine (8-OHdG) is the fairly stable and the most abundant oxidized DNA lesion induced by ROS (25), and is frequently used as a biomarker of oxidative stress in humans and experimental animals (5, 19, 27, 50, 58, 62). In humans and animals, repair of 8-OHdG is performed by the base excision repair (BER) enzymes such as OGG1, MUTYH and MTH1 (35). Mispairing of the remained 8-OHdG through BER process with adenine base results in G:C–T:A transversion mutations (38, 39). The error during the repair of 8-OHdG also causes deletion mutations (55). These actions concerning 8-OHdG suggest the important role of 8-OHdG in the chemical-induced mutagenicity. In fact, our previous studies showed the elevation of mutation frequency
- 4 -
accompanied with the increase of 8-OHdG level in the kidney of NFT or KBrO3-treated gpt delta rats (27, 55).
The aim of the present study is the investigation about the involvement of oxidative stress in NFT or KBrO3-induced in vivo mutagenicity. To attain the objective,
I used Nrf2-/- gpt delta mice which lack the defense mechanisms against oxidative stress
and can detect in vivo mutagenicity, and performed the reporter gene mutation assays and measurements of 8-OHdG levels in their kidney. In chapter 1, I elucidated the relationship between oxidative stress-related mutagenicity induced by NFT and the chemical structure. NFT is synthesized by the condensation of 5-nitro-2-furaldehyde (NFA), a basic skeleton containing a nitro group, and 1-aminohydantoin, a side chain. Because the relationship between NFT-induced oxidative stress and its chemical structure remains unclear in our previous study about NFT and its moieties using gpt delta rats (27), I performed the additional consideration using Nrf2-/- gpt delta mice. In
chapter 2, I investigated the relationship between the formation of 8-OHdG and subsequent several types of gene mutations. Even though NFT and KBrO3 induce the
elevation of mutation frequency accompanied with the increase of 8-OHdG level in the kidney as previously mentioned (27, 55), the characteristic mutation pattern is different for each. NFT induces guanine base transversion mutations (27), and KBrO3 induces
deletion mutations (55). Thus, I used Nrf2-/- gpt delta mice for the investigation about
- 5 -
Chapter 1
Role of oxidative stress in the chemical structure-related genotoxicity
of nitrofurantoin in Nrf2-deficient gpt delta mice
- 6 -
Introduction
Nitrofurans are antimicrobial compounds that contain a nitro group at the 5-position of the furan ring and an amine or hydrazide side chain derivative (Fig. 1). Some nitrofurans are prohibited from use in veterinary medicine in Japan owing to their genotoxic and carcinogenic potential (15, 16, 17, 18). However, new nitrofurans with various hydrazide derivatives on the side chain are being developed, given their easy synthesis and high antimicrobial activity (8, 63). Therefore, it is necessary to clarify the chemical structure-related genotoxicity of nitrofurans to facilitate risk assessments for human applications.
One nitrofuran group, nitrofurantoin (NFT), is synthesized by the condensation of 5-nitro-2-furaldehyde (NFA) (Fig. 1) and 1-aminohydantoin and is a renal carcinogen in rats (9). The formation of reactive oxygen species (ROS) or intermediates resulting from the reduction of the nitro group of NFT is thought to exert antibacterial activity (2, 3, 4). Accordingly, we hypothesized that oxidative stress is involved in NFT-induced renal carcinogenesis. We recently demonstrated significant increases in the levels of 8-hydroxydeoxyguanosine (8-OHdG), an oxidized DNA lesion, and gpt mutant frequencies (MFs) with substitutions at guanine bases in the kidneys of gpt delta rats treated with NFT (27). However, the 1-aminohydantoin side-chain did not increase 8-OHdG levels or gpt MFs (27). NFA containing a nitro group, similar to NFT, did not increase 8-OHdG levels, but increased gpt MFs in the kidneys of gpt delta rats with different mutation spectra from those for NFT (27). Accordingly, the relationship between NFT-induced oxidative stress and its chemical structure remains unclear (27).
- 7 -
The redox-sensitive transcription factor nuclear factor erythroid 2-related factor 2 (NRF2) regulates cellular responses to oxidative stress. NRF2 is anchored in the cytoplasm by Kelch-like ECH-associated protein 1 (KEAP1), which also mediates the proteasomal degradation of NRF2. Oxidative stress causes the dissociation of NRF2 from KEAP1 and leads to NRF2 translocation into the nucleus, where it can bind to the antioxidant response element (ARE) and consequently transactivate ARE-bearing genes encoding anti-oxidant-related enzymes, such as NAD(P)H:quinone oxidoreductase 1 (NQO1), heme oxygenase 1 (HO1), and glutathione S-transferase (GST) (23, 32). Thus, the NRF2-ARE pathway has broad protective effects against oxidative stress. Nrf2-deficient mice clearly show greater sensitivity to various toxicants, as evidenced by the induction of the oxidative stress response following exposure to acetaminophen,
4-vinylcyclohexene diepoxide, pentachlorophenol,
2-amino-3-methylimidazo[4,5-f]quinoline, ferric nitrilotriacetate, and piperonylbutoxide (7, 14, 24, 28, 50, 58, 62).
In the present study, the role of oxidative stress in the chemical structure-related genotoxicity of NFT was determined using Nrf2-proficient and -deficient mice exposed to NFT or NFA for 13 weeks, followed by reporter gene mutation assays (34, 40) and measurements of 8-OHdG levels in the kidney.
- 8 -
Materials and Methods
Chemicals
NFT (C8H6N4O5, MW 238.2, CAS No. 67-20-9) and NFA (C5H3NO4, MW
141.08, CAS No. 698-63-5) were purchased from Sigma-Aldrich Co. (St. Louis, MO, USA) and were suspended in 0.5 w/v% methyl cellulose 400 cP solution (Wako Pure Chemical Industries, Ltd., Osaka, Japan). Suspensions of the test chemicals were used at a volume of 10 mL/kg body weight (BW), based on BW on the day of chemical administration to Nrf2+/+ or Nrf2-/- gpt delta mice.
Animals, diet, and housing conditions
The study protocol was approved by the Animal Care and Utilization Committee of the National Institute of Health Sciences. Nrf2-deficient mice with the C57BL/6J background established by Itoh et al. (22), were crossed with gpt delta mice with the C57BL/6J background (Japan SLC, Shizuoka, Japan). Nrf2-/- gpt delta mice and Nrf2+/+ gpt delta mice were then obtained from the F1 generation and genotyped by
polymerase chain reaction (PCR) with DNA collected from the tail of each mouse. All mice were housed in polycarbonate cages (5 mice per cage) with hard wood chips for bedding in a conventional animal facility maintained at a controlled temperature (23 ± 2°C) and humidity (55 ± 5%), with 12 air changes per hour, and a 12-h light/dark cycle. Mice were given free access to the CRF-1 basal diet (Charles River Japan, Kanagawa, Japan) and tap water.
- 9 - Experimental design
Experimental design is described in Fig. 2. Eight-week-old male mice of each genotype were divided into five groups (four or five mice per group), i.e., two groups each administered NFT and NFA by gavage for five consecutive days and a control group administered vehicle alone. For daily doses, 70 and 35 mg/kg NFT were used. NFT at 70 mg/kg was the maximum tolerated dose in a preliminary dose selection study. NFA was set to 41 and 21 mg/kg, the same molar doses used for NFT. BW was measured every week. At necropsy, animals were killed by exsanguination under isoflurane (Mylan Inc., Tokyo, Japan) anesthesia, and the bilateral kidneys were collected and weighed. A portion of the kidney tissues was frozen with liquid nitrogen and stored at -80°C for the in vivo mutation assay, 8-OHdG measurements, and western blotting. A part of collected kidney was homogenized in ISOGEN (Nippon Gene, Tokyo, Japan) and stored at -80°C until use for the isolation of total RNA.
RNA isolation and quantitative real-time PCR for mRNA expression
Total RNA was extracted using ISOGEN according to the manufacturer’s instruction. cDNA copies of total RNA were obtained using a High Capacity cDNA Reverse Transcription Kit (Life Technologies).
All PCRs were performed using the Applied Biosystems 7900HT FAST Real-Time PCR System with primers for mouse Nqo1 obtained from TaqMan® Gene Expression Assays and TaqMan® Rodent GAPDH Control Reagents. Expression levels were calculated by the relative standard curve method and were determined relative to
- 10 -
Gapdh levels. Data are presented as fold-change values of treated samples relative to controls.
Protein extraction, SDS-PAGE, and western blotting
The kidneys from all animals were homogenized using a Teflon homogenizer with ice-cold RIPA lysis buffer (Wako Pure Chemical Co.) containing mammalian protease inhibitor cocktail. Samples were homogenized and centrifuged at 15,000 × g for 30 min, and the resulting supernatants were used. Protein concentrations were determined using the Advanced Protein Assay (Cytoskeleton, Denver, CO, USA) with bovine serum albumin as a standard. Samples were separated by SDS-polyacrylamide gel electrophoresis (SDS-PAGE) and transferred to 0.45-μm PVDF membranes (Millipore, Billerica, MA, USA). For the detection of target proteins, membranes were incubated with an anti-NQO1 polyclonal antibody (1:1000; Abcam, Cambridge, UK) and anti-β-actin monoclonal antibody (1:3000; Abcam) at 4°C overnight. Secondary antibody incubation was performed using horseradish peroxidase-conjugated secondary anti-rabbit or anti-mouse antibody at room temperature. Protein detection was facilitated by chemiluminescence using ECL Plus (GE Healthcare Japan Ltd., Tokyo, Japan).
Measurement of 8-OHdG
Renal DNA of Nrf2-/- gpt delta mice and Nrf2+/+ gpt delta mice was extracted
and digested as described previously (54). Briefly, nuclear DNA was extracted using a DNA Extractor WB Kit (Wako Pure Chemical Co.). To prevent artefactual oxidation in
- 11 -
the cell lysis step, deferoxamine mesylate (Sigma Chemical) was added to the lysis buffer. DNA was digested to deoxynucleotides by treatment with nuclease P1 and alkaline phosphatase using the 8-OHdG Assay Preparation Reagent Kit (Wako Pure Chemical Co.). The levels of 8-OHdG (8-OHdG/105 dG) were measured by
high-performance liquid chromatography using an electrochemical detection system (Coulochem II; ESA, Bedford, MA, USA) as previously reported (55).
In vivo mutation assays
6-Thioguanine (6-TG) and Spi– selection were performed using the methods
described by Nohmi et al. (40). Briefly, genomic DNA was extracted from the kidneys of animals in each group using the RecoverEase DNA Isolation Kit (Agilent Technologies, Santa Clara, CA, USA), and lambda EG10 DNA (48 kb) was rescued as phages by in vitro packaging using Transpack Packaging Extract (Agilent Technologies). For 6-TG selection, packaged phages were incubated with Escherichia coli YG6020, which expresses Cre recombinase, and converted to plasmids carrying gpt and chloramphenicol acetyltransferase genes. Infected cells were mixed with molten soft agar and poured onto agar plates containing chloramphenicol and 6-TG. To determine the total number of rescued plasmids, infected cells were also poured on plates containing chloramphenicol without 6-TG. The plates were then incubated at 37°C for selection of 6-TG-resistant colonies, and the gpt MF was calculated by dividing the number of gpt mutants after clonal correction by the number of rescued phages. The gpt mutations were characterized by the amplification of a 739-bp DNA fragment
- 12 -
containing the 456-bp coding region of the gpt gene (40) and sequencing the PCR products using an Applied Biosystems 3730xl DNA Analyzer (Life Technologies Corporation, Carlsbad, CA, USA). For Spi– selection, packaged phages were incubated
with E. coli XL-1 Blue MRA for survival titration and E. coli XL-1 Blue MRA P2 for mutant selection. Infected cells were mixed with molten lambda-trypticase agar plates. The next day, plaques (Spi– candidates) were punched out with sterilized glass pipettes
and the agar plugs were suspended in SM buffer. The Spi– phenotype was confirmed by
spotting the suspensions on three types of plates where the XL-1 Blue MRA, XL-1 Blue MRA P2, or WL95 P2 strain was spread on soft agar. Spi– mutants forming clear
plaques on every plate were counted.
Statistical analysis
Data are presented as mean ± standard deviation (SD). Statistical analyses of differences in BW, kidney weights, 8-OHdG levels, mRNA expression levels, gpt and Spi– MFs, and gpt-mutation spectra between values of the control group from mice of
the same genotype were analyzed by Dunnett’s multiple comparison test. Comparison between mRNA expression levels of each control group of Nrf2-proficient and -deficient mice were made using the Student’s t-test. P < 0.05 was considered significant.
- 13 -
Results
Body and kidney weights
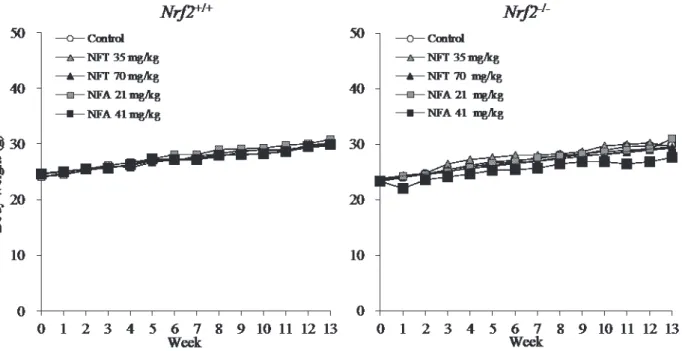
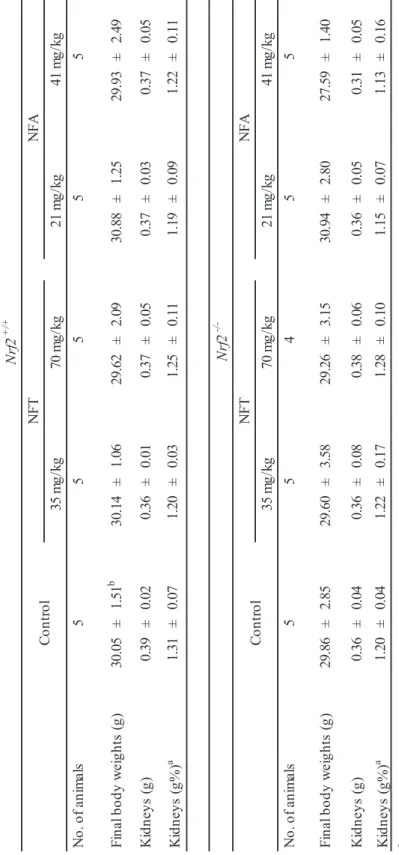
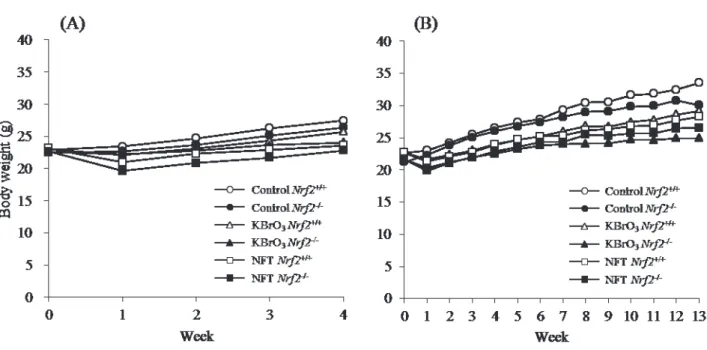
Body and kidney weights of Nrf2-proficient and -deficient mice treated with NFT or NFA for 13 weeks are summarized in Fig. 3 and Table 1. For both genotypes, there were no significant differences in body and kidney weights between treated and untreated mice.
Quantitative real-Time PCR and western blotting analyses of Nqo1
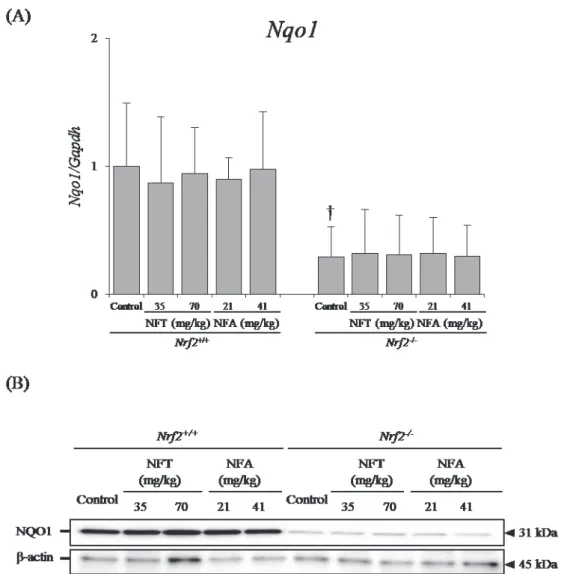
For both genotypes, the mRNA expression level of Nqo1 was not significantly influenced by NFT or NFA treatment. In Nrf2-deficient mice, however, the Nqo1 mRNA expression level was significantly lower than that in Nrf2-proficient mice (Fig. 4A).
Furthermore, at the protein expression level, NQO1 was not affected by NFT or NFA treatment. In Nrf2-deficient mice, however, the NQO1 protein expression level was lower than that in Nrf2-proficient mice (Fig. 4B).
8-OHdG levels in kidney DNA
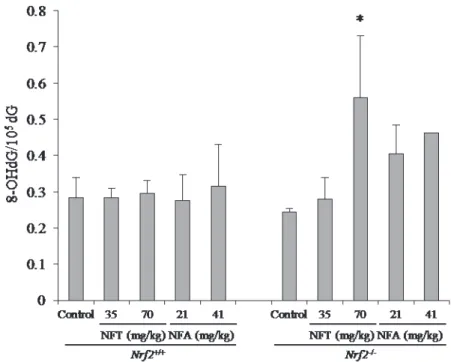
8-OHdG levels in Nrf2-deficient mice treated with 70 mg/kg NFT were significantly higher than those in control mice. 8-OHdG levels in Nrf2-deficient mice treated with NFA showed the tendencies of increase in a dose-dependent manner although they were not statistically significant because of insufficiency of samples in 41 mg/kg NFA group. No increase was observed in Nrf2-proficient mice treated with NFT
- 14 - or NFA at all doses (Fig. 5).
In vivo mutation assay
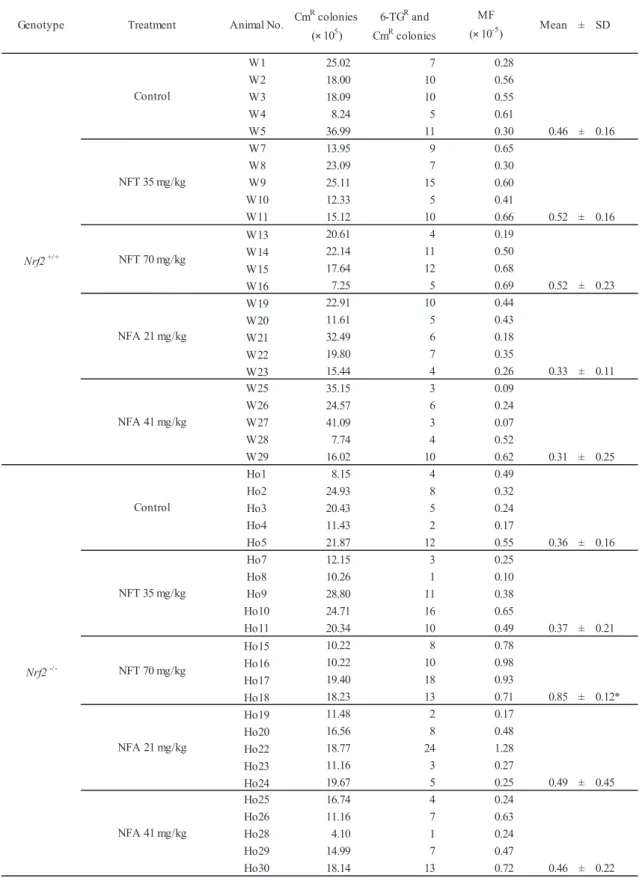
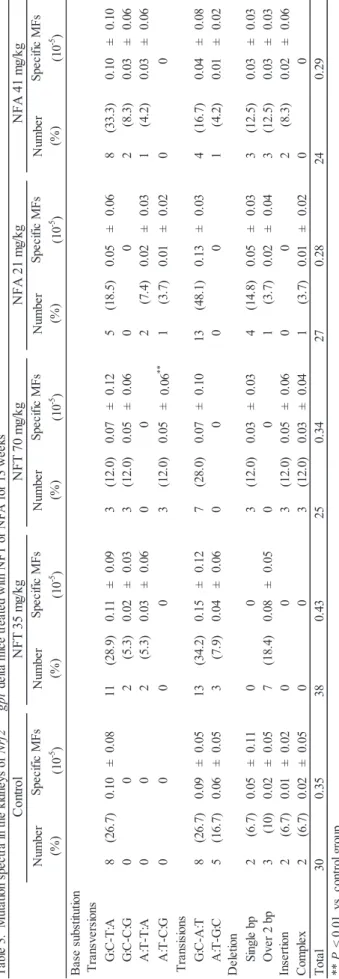
Results of the gpt assay for the kidneys of Nrf2-proficient and -deficient mice treated with NFT or NFA are shown in Tables 2, 3 and 4. The gpt MFs in Nrf2-deficient mice treated with NFT at 70 mg/kg were significantly greater than those in the control group (Table 2). Increases in guanine base substitutions including G:C–T:A or G:C–C:G transversions, were observed in Nrf2-deficient mice treated with NFT although there were no statistically significant differences (Table 4). The results of the Spi– assay are
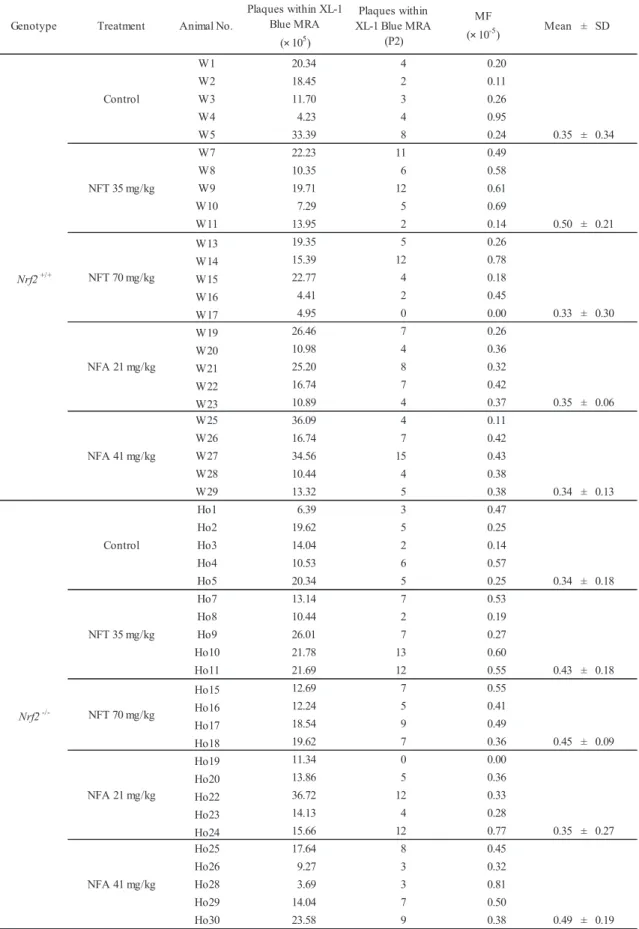
summarized in Table 5. There were no significant changes in the Spi– MF in Nrf2-proficient and -deficient mice treated with NFT or NFA at any dose.
- 15 -
Discussion
Nrf2 plays a crucial role in protection against oxidative stress by transcriptionally upregulating various antioxidant enzymes, including NQO1 (23, 32). Previous studies have shown that Nrf2-/- mice show high sensitivity to various toxicants,
including the induction of the oxidative stress response following exposure to acetaminophen, 4-vinylcyclohexene diepoxide, pentachlorophenol, 2-amino-3-methylimidazo[4,5-f]quinoline, ferric nitrilotriacetate, and piperonylbutoxide (7, 14, 24, 28, 50, 58, 62). Although there were no dose-dependent effects in either genotype, the mRNA expression level of Nqo1 in the kidneys of vehicle-treated Nrf2
-/-mice was significantly lower than that of vehicle-treated Nrf2+/+ mice, consistent with
the results observed for the protein expression of NQO1. Thus, our results confirmed that Nrf2-/- mice are susceptible to oxidative stress. NFT administration for 13 weeks
resulted in a significant increase in 8-OHdG in a dose-dependent manner, only in the kidneys of Nrf2-/- mice. The administration of NFA also tended to result in a
dose-dependent increase in 8-OHdG in Nrf2-/- mice. These results in the present study
suggested that NFT and NFA induced oxidative stress in the kidneys of mice and NFT might induce severer oxidative stress than NFA.
Gpt MFs increased significantly in the kidneys of NFT-treated Nrf2-/- mice, but
not in Nrf2+/+ mice. In NFT-treated Nrf2-/- mice, the frequencies of specific mutations
and, in particular, the rates of G:C–T:A and G:C–C:G transversions increased in a dose-dependent manner. These changes in spectra of gpt mutations were consistent with those observed in NFT-treated gpt delta rats (27). Since guanine bases are susceptible to
- 16 -
oxidative modification, the characteristics of the mutation spectra suggest that oxidative stress is involved in NFT-induced genotoxicity. Moreover, 8-OHdG causes G:C–T:A transversions via mispairing with adenine in the course of DNA replication (38, 39); accordingly, the formation of 8-OHdG may contribute to the G:C–T:A transversions observed in Nrf2-/- mice treated with NFT. Furthermore, NFT failed to induce increases
in 8-OHdG in Nrf2+/+ mice, unlike in rats (27), indicating that the sensitivity to
oxidative stress is greater in rats than in mice. Considering that NFT shows carcinogenicity in rats, but not in mice (9), this may explain the difference in NFT carcinogenicity between rats and mice.
Nitro-reduction causes oxidative stress in most nitro compounds, including nitrofurans (2, 3, 4). Nitro-reductase induces a one-electron reduction of the nitro group, yielding nitro anion radicals, and the chemical instability increases various ROS, such as superoxide anions and hydroxyl radicals, via its electron-donating ability (61). ROS generation by nitro-reductase is involved in NFT-induced DNA damage or cytotoxicity in rodent livers and lungs (43, 49). However, our recent report showed that NFA, a constituent compound of NFT with a nitro group, induced a significant increase in the gpt MF, without an elevation in 8-OHdG, in gpt delta rats (27). In the present study, NFA did not increase MFs of the reporter genes in the kidneys of both genotypes, despite the tendencies of increase in 8-OHdG in NFA-treated Nrf2-/- mice. These results
about NFA in rats and nice indicated that it is unlikely that oxidative stress is involved in the genotoxicity of NFA; other factors, such as the direct formation of DNA adducts, as observed for other nitrofurans (48, 51), by NFA are likely to contribute to its
- 17 - genotoxicity.
These results imply that nitro reduction plays a key role in the genotoxicity of NFT. However, our findings indicate the involvement of oxidative DNA damage in genotoxicity in the kidneys of NFT-treated Nrf2-/- mice, but not in the kidneys of
NFA-treated Nrf2-/- mice. Side chain interactions may affect the generation of oxidative
stress by nitro-reduction of the nitro group.
The results of the present study demonstrated that oxidative stress is involved in NFT-induced genotoxicity in mouse kidneys, consistent with previous results in rats, and oxidative stress was not involved in the genotoxic mechanism of NFA, a constituent compound of NFT with a nitro group. This might be due to the influence by side chains on the generation of oxidative stress by the nitro-reduction of the nitro group. The oxidative stress induced by side chain binding should be considered in the development of new nitrofuran compounds.
- 18 -
Abstract
Despite its antimicrobial activity, nitrofurantoin (NFT) is a renal carcinogen in rats. Oxidative stress induced by the reduction of the nitro group of NFT may contribute to its genotoxicity. This is supported by our recent results indicating that the structure of the nitrofuran plays a key role in NFT-induced genotoxicity, and oxidative DNA damage is involved in renal carcinogenesis. Nuclear factor erythroid 2-related factor 2 (NRF2) regulates cellular responses to oxidative stress. To clarify the role of oxidative stress in the chemical structure-related genotoxic mechanism of NFT, I performed reporter gene mutation assays for NFT and 5-nitro-2-furaldehyde (NFA) using Nrf2-proficient and -deficient gpt delta mice. NFT administration for 13 weeks resulted in a significant increase in 8-hydroxydeoxyguanosine (8-OHdG; a marker of oxidative stress) and in the
gpt mutant frequency, only in the kidneys of Nrf2-/- mice. The mutation spectrum,
characterized by increased substitutions at guanine bases, suggested that oxidative stress is involved in NFT-induced genotoxicity. However, NFA did not increase the mutation frequency in the kidneys, despite the increased 8-OHdG in NFA-treated Nrf2-/- mice.
Thus, it is unlikely that oxidative stress is involved in the genotoxic mechanism of NFA. These results imply that nitro reduction plays a key role in the genotoxicity of NFT, but the lack of a role of oxidative stress in the genotoxicity of NFA indicates a potential role of side chain interactions in oxidative stress by nitro-reduction. These findings provide a basis for the development of safe nitrofurans.
- 19 -
- 20 -
- 21 -
Fig. 3. Growth curves for Nrf2+/+ (left panel) and Nrf2-/- (right panel) mice treated with
NFT or NFA for 13 weeks. n=5/group. For both genotypes, there were no significant differences in body weight between treated and untreated mice.
- 22 -
Fig. 4. Changes in the Nrf2-target gene Nqo1 at the mRNA (A) and protein levels (B). (A) Data are presented as means ± SD. n=5/group. †: mRNA expression levels in Nrf2-/- control group were significantly different (P < 0.05) from levels in Nrf2+/+
control group by Student’s t-test. (B) Representative image of western blotting about NQO1 and β-actin as an internal control. Homogenized kidneys of 5 mice were used. The expression levels of NQO1 in Nrf2-/- mice are lower than those of Nrf2+/+ mice.
- 23 -
Fig. 5. 8-OHdG levels in the kidneys of Nrf2+/+ or Nrf2-/- gpt delta mice treated with
NFT or NFA for 13 weeks. Data are presented as means ± SD for 3 mice in the group other than 41 mg/kg NFA. In 41 mg/kg NFA group, the data obtained from one mouse were presented. *: Significantly different (P < 0.05) from levels in respective control group by Dunnett’s test.
24 -T ab le 1 . Fi na l body and ki dne y w ei ght s of m al e Nr f2 +/ + o r Nr f2 -/ - gpt d el ta m ic e tr ea te d w ith N FT o r N FA fo r 1 3 w ee ks N o. o f an im al s 5 5 5 5 5 Fi na l body w ei ght s (g ) 30 .0 5 ± 1. 51 b 30. 14 ± 1. 06 29. 62 ± 2. 09 30. 88 ± 1. 25 29. 93 ± 2. 49 K id ne ys (g ) 0. 39 ± 0. 02 0. 36 ± 0. 01 0. 37 ± 0. 05 0. 37 ± 0. 03 0. 37 ± 0. 05 K idne ys (g% ) a 1. 31 ± 0. 07 1. 20 ± 0. 03 1. 25 ± 0. 11 1. 19 ± 0. 09 1. 22 ± 0. 11 N o. o f an im al s 5 5 4 5 5 Fi na l body w ei ght s (g ) 29 .8 6 ± 2. 85 29 .6 0 ± 3. 58 29 .2 6 ± 3. 15 30 .9 4 ± 2. 80 27. 59 ± 1. 40 K id ne ys (g ) 0. 36 ± 0. 04 0. 36 ± 0. 08 0. 38 ± 0. 06 0. 36 ± 0. 05 0. 31 ± 0. 05 K idne ys (g% ) a 1. 20 ± 0. 04 1. 22 ± 0. 17 1. 28 ± 0. 10 1. 15 ± 0. 07 1. 13 ± 0. 16 a K idne ys -t o-body w ei ght ra tio s (r el at ive w ei ght s) a re g iv en a s g or ga n w ei ght /g body w ei ght . b M ea ns ± SD . Nr f2 +/ + C ont ro l NF T NF A 35 m g/ kg 70 m g/ kg 21 m g/ kg 41 m g/ kg Nr f2 -/ -C ont ro l NF T NF A 35 m g/ kg 70 m g/ kg 21 m g/ kg 41 m g/ kg
- 25 -
Genotype Treatment Animal No. Mean ± SD
W1 25.02 7 0.28 W2 18.00 10 0.56 W3 18.09 10 0.55 W4 8.24 5 0.61 W5 36.99 11 0.30 0.46 ± 0.16 W7 13.95 9 0.65 W8 23.09 7 0.30 W9 25.11 15 0.60 W10 12.33 5 0.41 W11 15.12 10 0.66 0.52 ± 0.16 W13 20.61 4 0.19 W14 22.14 11 0.50 W15 17.64 12 0.68 W16 7.25 5 0.69 0.52 ± 0.23 W19 22.91 10 0.44 W20 11.61 5 0.43 W21 32.49 6 0.18 W22 19.80 7 0.35 W23 15.44 4 0.26 0.33 ± 0.11 W25 35.15 3 0.09 W26 24.57 6 0.24 W27 41.09 3 0.07 W28 7.74 4 0.52 W29 16.02 10 0.62 0.31 ± 0.25 Ho1 8.15 4 0.49 Ho2 24.93 8 0.32 Ho3 20.43 5 0.24 Ho4 11.43 2 0.17 Ho5 21.87 12 0.55 0.36 ± 0.16 Ho7 12.15 3 0.25 Ho8 10.26 1 0.10 Ho9 28.80 11 0.38 Ho10 24.71 16 0.65 Ho11 20.34 10 0.49 0.37 ± 0.21 Ho15 10.22 8 0.78 Ho16 10.22 10 0.98 Ho17 19.40 18 0.93 Ho18 18.23 13 0.71 0.85 ± 0.12* Ho19 11.48 2 0.17 Ho20 16.56 8 0.48 Ho22 18.77 24 1.28 Ho23 11.16 3 0.27 Ho24 19.67 5 0.25 0.49 ± 0.45 Ho25 16.74 4 0.24 Ho26 11.16 7 0.63 Ho28 4.10 1 0.24 Ho29 14.99 7 0.47 Ho30 18.14 13 0.72 0.46 ± 0.22 6-TGR and CmR colonies MF (× 10-5) Nrf2+/+ Control NFT 35 mg/kg NFT 70 mg/kg NFA 21 mg/kg NFA 41 mg/kg
Table 2. Gpt mutation frequencies in kidneys of Nrf2+/+ or Nrf2-/- gpt delta mice treated with NFT or NFA for 13 weeks
CmR, chloramphenicol resistant; 6-TGR, 6-thioguanine resistant; MF, mutant frequensy * P < 0.05 vs. respective control group
NFA 41 mg/kg CmR colonies (× 105) Nrf2 -/-Control NFT 35 mg/kg NFT 70 mg/kg NFA 21 mg/kg
26 -B as e su bs titu tio n G :C -T :A 8 (26. 7) 0. 10 ± 0. 08 11 (2 8. 9) 0. 11 ± 0. 09 3 (1 2. 0) 0. 07 ± 0. 12 5 (1 8. 5) 0. 05 ± 0. 06 8 (3 3. 3) 0. 10 ± 0. 10 G :C -C :G 0 0 2 (5. 3) 0. 02 ± 0. 03 3 (1 2. 0) 0. 05 ± 0. 06 0 0 2 (8 .3 ) 0. 03 ± 0. 06 A :T -T :A 0 0 2 (5 .3 ) 0. 03 ± 0. 06 0 0 2 (7. 4) 0. 02 ± 0. 03 1 (4 .2 ) 0. 03 ± 0. 06 A :T -C :G 0 0 0 0 3 (1 2. 0) 0. 05 ± 0. 06 ** 1 (3. 7) 0. 01 ± 0. 02 0 0 G :C -A :T 8 (26. 7) 0. 09 ± 0. 05 13 (3 4. 2) 0. 15 ± 0. 12 7 (2 8. 0) 0. 07 ± 0. 10 13 (48. 1) 0. 13 ± 0. 03 4 (16. 7) 0. 04 ± 0. 08 A :T -G :C 5 (1 6. 7) 0. 06 ± 0. 05 3 (7 .9 ) 0. 04 ± 0. 06 0 0 0 0 1 (4. 2) 0. 01 ± 0. 02 Si ngl e bp 2 (6. 7) 0. 05 ± 0. 11 0 0 3 (1 2. 0) 0. 03 ± 0. 03 4 (1 4. 8) 0. 05 ± 0. 03 3 (1 2. 5) 0. 03 ± 0. 03 O ve r 2 bp 3 (1 0) 0. 02 ± 0. 05 7 (1 8. 4) 0. 08 ± 0. 05 0 0 1 (3 .7 ) 0. 02 ± 0. 04 3 (12. 5) 0. 03 ± 0. 03 2 (6. 7) 0. 01 ± 0. 02 0 0 3 (1 2. 0) 0. 05 ± 0. 06 0 0 2 (8 .3 ) 0. 02 ± 0. 06 2 (6. 7) 0. 02 ± 0. 05 0 0 3 (1 2. 0) 0. 03 ± 0. 04 1 (3 .7 ) 0. 01 ± 0. 02 0 0 T ot al 30 0.3 5 38 0.4 3 25 0.3 4 27 0.2 8 24 0.2 9 Co m pl ex Sp ec ifi c MFs (1 0 -5 ) T ra ns ve rs ions Nu m be r (% ) Sp eci fic M Fs ( 10 -5 ) Nu m be r (% ) Sp ec ifi c MFs (1 0 -5 ) Sp ec ifi c M Fs (1 0 -5 ) Nu m be r (% ) Sp eci fic M Fs (1 0 -5 ) T ra ns is ions De le tio n In se rt io n ** P < 0 .0 1, v s. c on tr ol g ro up M F, m ut an t f re que nc y T ab le 3 . M ut at io n sp ec tr a i n th e ki dn ey s o f Nr f2 +/ + gpt d el ta m ic e tr ea te d w ith N FT o r N FA f or 1 3 w ee ks Co nt ro l Nu m be r (% ) N F T 35 m g/ kg N F T 70 m g/ kg N F A 21 m g/ kg N F A 41 m g/ kg Nu m be r (% )
27 -B as e su bs titu tio n G :C -T :A 4 (1 3.8 ) 0.0 6 ± 0. 06 8 (2 2.2 ) 0.0 8 ± 0. 06 9 (2 1.4 ) 0.1 5 ± 0. 13 7 (3 1.8 ) 0. 08 ± 0. 05 3 (9. 4) 0. 05 ± 0. 08 G :C -C :G 2 (6. 9) 0. 02 ± 0. 03 3 (8 .3 ) 0. 02 ± 0. 04 7 (16. 7) 0. 13 ± 0. 13 2 (9. 1) 0. 03 ± 0. 04 4 (1 2. 5) 0. 06 ± 0. 07 A :T -T :A 0 0 0 0 1 (2 .4 ) 0. 02 ± 0. 05 1 (4. 5) 0. 01 ± 0. 03 2 (6 .3 ) 0. 02 ± 0. 05 A :T -C :G 2 (6 .9 ) 0. 02 ± 0. 04 1 (2. 8) 0. 01 ± 0. 02 0 0 0 0 0 0 G :C -A :T 14 (4 8. 3) 0. 15 ± 0. 08 15 (41. 7) 0. 14 ± 0. 06 13 (3 1. 0) 0. 22 ± 0. 09 6 (2 7. 3) 0. 07 ± 0. 05 12 (37. 5) 0. 14 ± 0. 17 A :T -G :C 0 0 2 (5 .6 ) 0. 02 ± 0. 02 1 (2. 4) 0. 02 ± 0. 05 1 (4 .5 ) 0. 01 ± 0. 02 1 (3. 1) 0. 02 ± 0. 04 Si ngl e bp 6 (20. 7) 0. 07 ± 0. 05 3 (8. 3) 0. 02 ± 0. 03 5 (1 1. 9) 0. 09 ± 0. 07 2 (9 .1 ) 0. 03 ± 0. 04 1 (3. 1) 0. 01 ± 0. 03 O ve r 2 bp 1 (3 ) 0. 01 ± 0. 02 2 (5. 6) 0. 02 ± 0. 02 2 (4 .8 ) 0. 03 ± 0. 05 0 0 4 (12. 5) 0. 05 ± 0. 05 0 0 1 (2. 8) 0. 01 ± 0. 02 1 (2 .4 ) 0. 02 ± 0. 05 1 (4. 5) 0. 02 ± 0. 04 2 (6 .3 ) 0. 06 ± 0. 11 0 0 1 (2. 8) 0. 01 ± 0. 02 3 (7 .1 ) 0. 06 ± 0. 09 2 (9. 1) 0. 02 ± 0. 05 3 (9 .4 ) 0. 05 ± 0. 08 T ot al 29 0.3 2 36 0.3 3 42 0.7 5 22 0.2 8 32 0.4 6 N F T 35 m g/ kg N F T 70 m g/ kg N F A 41 m g/ kg Nu m be r (% ) Sp eci fic M Fs ( 10 -5 ) Nu m be r (% ) Sp ec ifi c MFs (1 0 -5 ) Nu m be r (% ) Nu m be r (% ) T ra ns ve rs ions T ra ns is ions Sp ec ifi c M Fs (1 0 -5 ) M F, m ut ant f re que nc y T ab le 4 . M ut at io n sp ec tr a i n th e ki dn ey s o f Nr f2 -/- gpt d el ta m ic e tr ea te d w ith N FT o r N FA f or 1 3 w ee ks De le tio n In se rt io n Co m pl ex N F A 21 m g/ kg Co nt ro l Sp ec ifi c MFs (1 0 -5 ) Nu m be r (% ) Sp ec ifi c M Fs (1 0 -5 )
- 28 -
Genotype Treatment Animal No. Mean ± SD
W1 20.34 4 0.20 W2 18.45 2 0.11 W3 11.70 3 0.26 W4 4.23 4 0.95 W5 33.39 8 0.24 0.35 ± 0.34 W7 22.23 11 0.49 W8 10.35 6 0.58 W9 19.71 12 0.61 W10 7.29 5 0.69 W11 13.95 2 0.14 0.50 ± 0.21 W13 19.35 5 0.26 W14 15.39 12 0.78 W15 22.77 4 0.18 W16 4.41 2 0.45 W17 4.95 0 0.00 0.33 ± 0.30 W19 26.46 7 0.26 W20 10.98 4 0.36 W21 25.20 8 0.32 W22 16.74 7 0.42 W23 10.89 4 0.37 0.35 ± 0.06 W25 36.09 4 0.11 W26 16.74 7 0.42 W27 34.56 15 0.43 W28 10.44 4 0.38 W29 13.32 5 0.38 0.34 ± 0.13 Ho1 6.39 3 0.47 Ho2 19.62 5 0.25 Ho3 14.04 2 0.14 Ho4 10.53 6 0.57 Ho5 20.34 5 0.25 0.34 ± 0.18 Ho7 13.14 7 0.53 Ho8 10.44 2 0.19 Ho9 26.01 7 0.27 Ho10 21.78 13 0.60 Ho11 21.69 12 0.55 0.43 ± 0.18 Ho15 12.69 7 0.55 Ho16 12.24 5 0.41 Ho17 18.54 9 0.49 Ho18 19.62 7 0.36 0.45 ± 0.09 Ho19 11.34 0 0.00 Ho20 13.86 5 0.36 Ho22 36.72 12 0.33 Ho23 14.13 4 0.28 Ho24 15.66 12 0.77 0.35 ± 0.27 Ho25 17.64 8 0.45 Ho26 9.27 3 0.32 Ho28 3.69 3 0.81 Ho29 14.04 7 0.50 Ho30 23.58 9 0.38 0.49 ± 0.19 MF, mutant frequency NFA 41 mg/kg Nrf2 -/-Nrf2+/+ Control NFT 35 mg/kg NFT 70 mg/kg NFA 21 mg/kg
Table 5. Spi– mutant frequencies in kidneys of Nrf2+/+ or Nrf2-/- gpt delta mice treated with NFT or NFA for 13 weeks
NFA 41 mg/kg Control NFT 35 mg/kg NFT 70 mg/kg NFA 21 mg/kg Plaques within XL-1 Blue MRA (× 105) Plaques within XL-1 Blue MRA (P2) MF (× 10-5)
- 29 -
Chapter 2
Mechanisms of oxidative stress-induced in vivo mutagenicity by
potassium bromate and nitrofurantoin
- 30 -
Introduction
The formation of reactive oxygen species (ROS) is considered one of the key factors in chemical carcinogenesis. However, the actual role of oxidative stress remains unclear. Some reports suggest that ROS play an important role in the promotion of chemical carcinogenesis by stimulating the proliferation of initiated cells (29, 37, 44), while others demonstrate that ROS might be an initiator by forming oxidized DNA lesions (37, 42, 45, 57). 8-hydroxydeoxyguanosine (8-OHdG) is the most abundant oxidized DNA lesion among the many oxidized nucleosides known and is fairly stable (25). The repair of 8-OHdG is carried out by the base excision repair enzymes. In humans, OGG1, MUTYH, and MTH1 repair 8-OHdG and contribute to the protection of genomic DNA from oxidative stress (35). The remaining 8-OHdG is considered to cause G:C–T:A transversions by mispairing with adenine and 8-OHdG (38, 39).
Potassium bromate (KBrO3) induces renal cell tumor formation in F344 rats
and has been classified as a genotoxic carcinogen because of positive mutagenicity in the Ames (21), chromosome aberration (20), and micronucleus tests (13). The studies demonstrating the induction of 8-OHdG by KBrO3 in vitro and in vivo suggest that
8-OHdG plays a key role in KBrO3 mutagenesis and carcinogenesis (1, 26, 56, 59). It
was reported that KBrO3 produces bromine radicals, which oxidize guanine bases (36).
Additionally, our previous study using the two-stage rat renal carcinogenesis model clarified the in vivo mutagenicity and initiation following oxidized DNA lesion in the kidneys of rats administered KBrO3 (55) and showed that high amounts of 8-OHdG
- 31 -
G:C–T:A transversions (55). The antimicrobial compound nitrofurantoin (NFT) is also known as a renal carcinogen in rats and is prohibited for veterinary use in Japan (18). The reduction of the nitro group of NFT induces oxidative stress, which exerts antibacterial activity (2, 3, 4). Moreover, the involvement of oxidative stress is suspected in NFT-induced carcinogenesis. In fact, our recent study showed increased levels of 8-OHdG and gpt mutant frequencies (MFs) with guanine base substitution mutations, including G:C–T:A transversions, in the kidneys of gpt delta rats treated with NFT (27). Nonetheless, the relationship between the formation of 8-OHdG and several types of mutations, including deletion mutations and G:C–T:A transversions, remains unclear.
One of the redox-sensitive transcription factors, nuclear factor erythroid 2-related factor 2 (NRF2), regulates cellular responses to oxidative stress by transactivation of antioxidant response element (ARE)-bearing genes encoding antioxidant related enzymes, such as NAD(P)H:quinone oxidoreductase 1 (NQO1), heme oxygenase 1 (HO1), and glutathione S-transferase (GST) (23, 32). Because of the function of NRF2, Nrf2-deficient mice show higher sensitivity to various toxicants that induce oxidative stress (7, 14, 24, 28, 50, 58, 62); therefore, these mice are quite suitable for investigation of the involvement of oxidative stress in chemical-induced genotoxicity and carcinogenesis.
In the present study, 4- and 13-week exposure of Nrf2-proficient and -deficient mice to KBrO3 in drinking water or NFT in diet followed by reporter gene mutation
- 32 -
to clarify the relationship between the formation of 8-OHdG and several types of mutations. In addition, this study aimed to elucidate the detailed mechanism of oxidative stress involvement in KBrO3- or NFT-induced renal carcinogenesis.
- 33 -
Materials and Methods
Chemicals
Potassium bromate (KBrO3, MW 167, CAS No. 7758-01-2) and NFT
(C8H6N4O5, MW 238.2, CAS No. 67-20-9) were purchased from Wako Pure Chemical
Industries (Osaka, Japan) and Sigma-Aldrich (St. Louis, MO, USA), respectively.
Animals, diet, and housing conditions
The study protocol was approved by the Animal Care and Utilization Committee of the National Institute of Health Sciences. Nrf2-deficient mice with C57BL/6J background established by Itoh et al. (22) were crossed with gpt delta mice with C57BL/6J background (Japan SLC, Shizuoka, Japan). Nrf2-/- gpt delta mice and Nrf2+/+ gpt delta mice were then obtained from the F1 generation and genotyped by
polymerase chain reaction (PCR) with DNA taken from the tail of each mouse. All mice were housed in polycarbonate cages (3 to 5 mice per cage) with hardwood chips for bedding in a conventional animal facility maintained at a controlled temperature (23±2°C) and humidity (55%±5%), with 12 air changes per hour and a 12-h light/dark cycle. Mice were given free access to CRF-1 basal diet (Charles River Japan, Kanagawa, Japan) and tap water.
Experimental design
Experimental design is described in Fig. 6. Six-week-old male mice of each genotype were divided into six groups (four to eight mice per group). KBrO3 was
- 34 -
dissolved in distilled water at concentration of 1,500 ppm, and the prepared water was given to the animals ad libitum for 4 or 13 weeks. NFT was mixed in CRF-1 basal diet at concentration of 2,500 ppm, and the prepared diet was given to the animals ad libitum for 4 or 13 weeks. Mice of the control group were given distilled water and CRF-1 basal diet. Dose levels of KBrO3 and NFT were selected as each maximum dose that could be
administrated to mice for 13 weeks based on the report of intestinal carcinogenesis in Nrf2-/- mice (62), a subacute toxicity study of KBrO
3 (30), and toxicology and
carcinogenesis study of NFT conducted by the National Toxicology Program (9). In the present study, the groups of 4- and 13-week administration were set for the objective of detection of early changes and subsequent changes in 8-OHdG levels and in vivo mutagenicity induced by KBrO3 or NFT, respectively. Body weights were measured
every week. The kidneys-to-body weight ratios (relative weights) were calculated as g organ weight/g body weight. Animals were killed by exsanguination under isoflurane (Mylan Inc., Tokyo, Japan) anesthesia, and at necropsy, the bilateral kidneys were collected, and their weights were measured. A portion of the kidney tissues was frozen with liquid nitrogen and stored at -80°C for use in the in vivo mutation assay and 8-OHdG measurement. Another portion was homogenized in ISOGEN (Nippon Gene, Tokyo, Japan) and stored at -80°C until used for isolation of total RNA.
RNA isolation and quantitative real-time PCR for evaluation of mRNA expression Total RNA was extracted using ISOGEN according to the manufacturer’s instructions. cDNA of total RNA was obtained using a High-Capacity cDNA Reverse
- 35 - Transcription Kit (Life Technologies).
All PCR reactions were performed with the Applied Biosystems 7900HT FAST Real-Time PCR System with primers for mouse Nqo1 (coding NAD(P)H:quinone oxidoreductase 1) obtained from TaqMan® Gene Expression Assays and TaqMan® Rodent GAPDH Control Reagents. The expression levels of the target gene were calculated by the relative standard curve method and were determined as ratios to Gapdh levels. Data are presented as fold-change values of treated samples relative to controls.
Measurement of 8-OHdG
Three animals in each group were selected randomly, and kidneys of those animals were used for the measurement of 8-OHdG. Renal DNA of Nrf2-/- gpt delta
mice and Nrf2+/+ gpt delta mice was extracted and digested as described previously (54).
Briefly, nuclear DNA was extracted with a DNA Extractor WB Kit (Wako Pure Chemical Co.). For further prevention of artifactual oxidation in the cell lysis step, deferoxamine mesylate (Sigma-Aldrich) was added to the lysis buffer. The DNA was digested to deoxynucleotides by treatment with nuclease P1 and alkaline phosphatase, using the 8-OHdG Assay Preparation Reagent Set (Wako Pure Chemical Co.). The levels of 8-OHdG (8-OHdG/105 dG) were measured by high-performance liquid
chromatography with an electrochemical detection system (Coulochem II; ESA, Bedford, MA, USA) as previously reported (55).
- 36 - In vivo mutation assays
6-Thioguanine (6-TG) and Spi– selections were performed using the methods
described by Nohmi et al. (40). Briefly, genomic DNA was extracted from the kidneys of animals in each group using the RecoverEase DNA isolation kit (Agilent Technologies, Santa Clara, CA, USA), and lambda EG10 DNA (48 kb) was rescued as phages by in vitro packaging using Transpack packaging extract (Agilent Technologies). For 6-TG selection, packaged phages were incubated with Escherichia coli YG6020, which expresses Cre recombinase, and converted to plasmids carrying genes encoding glutamic–pyruvate transaminase and chloramphenicol acetyltransferase. Infected cells were mixed with molten soft agar and poured onto agar plates containing chloramphenicol and 6-TG. In order to determine the total number of rescued plasmids, infected cells were also poured on plates containing chloramphenicol without 6-TG. The plates were then incubated at 37°C for selection of 6-TG-resistant colonies, and gpt MF was calculated by dividing the number of gpt mutants after clonal correction by the number of rescued phages. Gpt mutations were characterized by amplifying a 739-bp DNA fragment containing the 456-bp coding region of the gpt gene (40) and sequencing the PCR products with an Applied Biosystems 3730xl DNA Analyzer (Life Technologies, Carlsbad, CA, USA). For Spi– selection, packaged phages were incubated
with E. coli XL-1 Blue MRA for survival titration and E. coli XL-1 Blue MRA P2 for mutant selection. Infected cells were mixed with molten lambda-trypticase agar and poured onto lambda-trypticase agar plates. The next day, plaques (Spi– candidates) were
- 37 -
buffer. The Spi– phenotype was confirmed by spotting the suspensions on three types of
plates on which XL-1 Blue MRA, XL-1 Blue MRA P2, or WL95 P2 strain was spread with soft agar. Spi– mutants, which manifested as clear plaques, were counted on every
plate.
Statistical analysis
The significance of differences in the results for body weight, kidney weight, mRNA expression levels, 8-OHdG levels, gpt and Spi– MFs, and gpt- and Spi–-mutation
spectra were analyzed by Student’s t-test depending on the homogeneity. P values < 0.05 were considered significant.
- 38 -
Results
Body and kidney weights
Body and kidney weights of Nrf2-proficient and -deficient mice treated with KBrO3 or NFT for 4 or 13 weeks are summarized in Fig. 7 and Table 6. For both
genotypes and time points, no significant change was observed in body and kidney weights of treated and respective control animals.
Quantitative real-time PCR for evaluation of Nqo1 mRNA expression
Expression levels of Nqo1 in the kidneys are shown in Fig. 8. In Nrf2+/+ mice,
the expression level of Nqo1 was significantly increased by 4- or 13-week exposure to KBrO3 (P < 0.01) and 13-week exposure to NFT (P < 0.05) when compared with the
control group. Four-week exposure to NFT resulted in the tendencies of increased expression of Nqo1 in Nrf2+/+ mice. In Nrf2-/- mice, increased Nqo1 expression was not
induced by KBrO3 or NFT treatment at either time point. The Nqo1 expression levels of
control, KBrO3-treated, and NFT-treated Nrf2-/- mice were significantly lower (P < 0.01)
than those of the corresponding Nrf2+/+ mice at both time points.
Measurement of 8-OHdG in kidney DNA
The results of 8-OHdG measurement in the kidneys are shown in Fig. 9. At both time points, KBrO3 treatment significantly increased the level of 8-OHdG in the
kidneys of both genotypes, and the degree of 8-OHdG increase was as follows: 4-week Nrf2+/+, × 2.8; 4-week Nrf2-/-, × 3.6; 13-week Nrf2+/+, × 2.1; 13-week Nrf2-/-, × 3.3, vs.
- 39 -
respective control). On the other hand, NFT treatment did not increase the level of 8-OHdG in the kidneys of either genotype at either time point. Between the Nrf2-proficient and -deficient mice of each treatment group, the 8-OHdG level was not significantly changed.
In vivo mutation assay of kidneys
The results of the gpt assay of the kidneys of Nrf2-proficient and -deficient mice treated with KBrO3 or NFT are shown in Tables 7 to 12. At both of 4- and 13-week,
KBrO3-treated mice showed significant increase or tendencies of increase of gpt MFs
compared with those in the respective control groups (Tables 7 and 8). The degree of increase of gpt MFs by 13-week treatment with KBrO3 was as follows: Nrf2+/+, × 2.2; Nrf2-/-, × 4.4, vs. respective control (Table 8). Specific MFs of deletion mutations were
increased in the spectrum analysis of gpt mutants in KBrO3-treated mice (Tables 10 and
11). The frequencies of deletion mutations of more than two base pairs were increased by 13-week treatment with KBrO3 in both genotypes (Table 11).
Furthermore, in both genotypes, gpt MFs were increased by 13-week treatment with NFT, despite no change at 4 weeks (Tables 7 and 9). The degree of increase of gpt MFs by 13-week treatment with NFT was as follows: Nrf2+/+, × 2.1; Nrf2-/-, × 3.3, vs.
respective control (Table 9). In both genotypes, guanine base substitution mutations, including G:C–T:A or G:C–C:G transversion mutations, were increased by 13-week treatment with NFT (Table 12).
- 40 -
mice treated with KBrO3 or NFT are shown in Tables 13 to 16. At both time points,
KBrO3-treated mice showed significant increase or the tendencies of increase of Spi–
MFs compared with those in the respective control groups (Tables 13 and 14). The degree of increase of Spi– MFs by 13-week treatment with KBrO
3 was as follows: Nrf2+/+, × 3.0; Nrf2-/-, × 4.1; vs. respective control (Table 14). In the spectrum analysis
of Spi– mutants in KBrO
3-treated mice, specific MFs of deletion mutations were
increased (Tables 15 and 16), consistent with that of gpt mutants. In both genotypes and at both time points, NFT treatment did not change Spi– MFs (Tables 13 and 14).
- 41 -
Discussion
It is well known that transcriptional upregulation of various antioxidant enzymes, including NQO1 and HO1, is regulated by NRF2, which protect cells from oxidative stress (23, 32). In several studies, Nrf2-/- mice showed higher sensitivity to
various toxicants that induced oxidative stress (7, 14, 24, 28, 50, 58, 62). In fact, the mRNA expression level of Nqo1 in the kidneys of vehicle-treated Nrf2-/- mice was
significantly lower than that of vehicle-treated Nrf2+/+ mice, and there was no elevation
of the level in KBrO3- or NFT-treated Nrf2-/- mice despite the elevation in Nrf2+/+ mice.
Thus, in the present study, Nrf2-/- mice were confirmed to be susceptible to oxidative
stress. As previously reported, using this highly oxidative stress-sensitive animal gives us important knowledge about the involvement of oxidative stress in chemical-induced genotoxicity and carcinogenesis (7, 14, 24, 28, 50, 58, 62).
Four or thirteen-week administration of 1,500 ppm KBrO3 in drinking water
significantly increased the level of 8-OHdG in the kidneys of both genotypes. At both time points, the degree of 8-OHdG increase was higher in Nrf2-/- mice than in Nrf2+/+
mice. Meanwhile, increases of gpt and Spi– MFs were detected, and the tendencies of
the degree of increase of gpt and Spi– MFs at 13-week exposure were the same as those
of 8-OHdG. In the spectrum analysis of gpt and Spi– mutants in KBrO
3-treated Nrf2
-/-mice, specific MFs of deletion mutations were increased, consistent with a previous study of rats (27), accompanied with the increase of the frequencies of deletion mutations of more than two base pairs. An in vitro report demonstrated that error in the repair process of 8-OHdG induced by KBrO3 treatment caused double-strand breaks
- 42 -
(DSBs) in human cells, and DSBs resulted in a large deletion (33). Considering these mechanisms, the increase in size of deletion mutations might reflect the accumulation of high amounts of 8-OHdG in the nuclei due to KBrO3. These results suggested that the
formation of 8-OHdG induced by oxidative stress was directly involved in the increase of deletion mutations in KBrO3-treated animals. It was suspected that the formation of
high amounts of 8-OHdG owing to the strong potential of KBrO3 as an oxidizing agent
might exceed the repairing capacity of base excision repair enzymes.
Four or thirteen-week administration of 2,500 ppm NFT in diet did not increase the level of 8-OHdG in the kidneys of either genotype. In the previous study, the level of 8-OHdG was increased in the kidneys of Nrf2-/- mice by oral administration of NFT
at 70 mg/kg (52). Lower exposure levels of NFT in the present study compared with those of the previous study did not induce the elevation of 8-OHdG levels. On the other hand, 13-week administration of 2,500 ppm NFT in diet significantly increased gpt MFs with guanine base substitution mutations in the kidneys of both genotypes. The degree of increase of gpt MFs was higher in Nrf2-/- mice than in Nrf2+/+ mice. These results
implied that the vulnerability to oxidative stress caused by the deficiency of Nrf2 leads to more mutations in NFT-treated mice. Thus, in the genotoxic mechanism of NFT, the formation of 8-OHdG induced by oxidative stress might not be involved in the increase of guanine base substitution mutations. Considering our previous studies, which suggested the involvement of oxidative stress in the chemical structure-related genotoxic mechanism of NFT in rodents (27, 52), further studies are requested to identify oxidative stress markers other than 8-OHdG which might be crucial to the
- 43 -
genotoxicity of NFT, though the present study did not identify them.
In recent years, the level of 8-OHdG has been frequently used as a marker of oxidative stress in human diseases (5, 19). In addition, some reports demonstrated the involvement of oxidative stress in chemical-induced genotoxicity and carcinogenesis using the increase of 8-OHdG level as a parameter of oxidative stress in experimental animals (7, 14, 24, 28, 50, 58, 62). However, the relationship between the formation of 8-OHdG and subsequent mutations, including deletion mutations and G:C–T:A transversions, had not been clarified. The revelation of the relationship between 8-OHdG and several types of mutations induced by KBrO3 or NFT provides new insight
into oxidative stress-related in vivo mutagenicity.
The present study demonstrated that the formation of 8-OHdG, which resulted from the oxidizing potential of KBrO3, was directly involved in the increase of deletion
mutations; however, oxidative stress-related factors other than 8-OHdG might play a critical role in NFT-induced guanine base substitution mutations. This was the first study to investigate the relationship between 8-OHdG and several types of mutations caused by oxidative stress-inducing chemicals. The accumulation of these detailed examinations such as further research on 8-OHdG about individual chemical substance leads to accurate risk assessment of oxidative stress in carcinogenicity.
- 44 -
Abstract
Oxidative stress is well known as a key factor of chemical carcinogenesis. However, the actual role of oxidative stress in carcinogenesis such as oxidative stress-related in vivo mutagenicity remains unclear. It has been reported that 8-hydroxydeoxyguanosine (8-OHdG), an oxidized DNA lesion, might contribute to chemical carcinogenesis. Potassium bromate (KBrO3) and nitrofurantoin (NFT) are
known as renal carcinogens in rats. Our previous studies showed an increase of mutant frequencies accompanied with an increased level of 8-OHdG in the kidneys of rodents following KBrO3 or NFT exposure. Furthermore, KBrO3 and NFT induced different
types of gene mutations. Thus, in the present study, I performed reporter gene mutation assays and 8-OHdG measurements following KBrO3 or NFT exposure using
Nrf2-proficient and -deficient mice to clarify the relationship between KBrO3- or
NFT-induced oxidative stress and subsequent genotoxicity. The administration of 1,500 ppm of KBrO3 in drinking water resulted in the increase of deletion mutations
accompanied with the increase of 8-OHdG level, and the administration of 2,500 ppm of NFT in diet induced the increase of guanine base substitution mutations without elevation of 8-OHdG level in Nrf2-deficient mice. These results demonstrated that the formation of 8-OHdG, which resulted from the oxidizing potential of KBrO3, was
directly involved in the increase of deletion mutations, although factors concerning oxidative stress other than 8-OHdG might be crucial for NFT-induced guanine base substitution mutations. The present study provides new insight into oxidative stress-related in vivo mutagenicity.
- 45 -
- 46 -
Fig. 7. Growth curves for Nrf2+/+ or Nrf2-/- mice treated with KBrO
3 or NFT for 4
weeks (A) or 13 weeks (B). 4 to 8 mice are used in each group. For both genotypes, there were no significant differences in body weight between treated and untreated mice in either time point.
- 47 -
Fig. 8. Changes in mRNA levels of Nrf2-target gene Nqo1 in the kidneys of Nrf2+/+ or Nrf2-/- mice treated with KBrO
3 or NFT for 4 weeks (A) or 13 weeks (B). Data are
presented as means ± SD. n=4 or 5/group. **,*: Significantly different (P < 0.01, 0.05) from respective control group. ##: Significantly different (P < 0.01) from respective Nrf2+/+ animals.
- 48 -
Fig. 9. 8-OHdG levels in the kidneys of Nrf2+/+ or Nrf2-/- mice treated with KBrO 3 or
NFT for 4 weeks (A) or 13 weeks (B). Data are presented as means ± SD. n=3 to 5/group. **, ††: Significantly different (P < 0.01) from respective control group.
49 -27. 43 ± 2. 59 b 25. 70 ± 2. 35 23. 56 ± 2. 15 26. 40 ± 2. 18 24. 05 ± 1. 26 22. 80 ± 1. 46 K id ne ys (g ) 0. 33 ± 0. 03 0. 32 ± 0. 04 0. 33 ± 0. 04 0. 32 ± 0. 03 0. 32 ± 0. 04 0. 32 ± 0. 04 K idne ys (g% ) a 1. 22 ± 0. 11 1. 26 ± 0. 09 1. 38 ± 0. 06 1. 20 ± 0. 10 1. 32 ± 0. 16 1. 38 ± 0. 13 33. 53 ± 3. 45 29. 18 ± 2. 45 28. 28 ± 1. 67 30. 05 ± 2. 38 24. 91 ± 1. 80 26. 55 ± 1. 39 K id ne ys (g ) 0. 35 ± 0. 03 0. 34 ± 0. 03 0. 38 ± 0. 05 0. 35 ± 0. 05 0. 34 ± 0. 06 0. 33 ± 0. 04 K idne ys (g% ) a 1. 06 ± 0. 08 1. 16 ± 0. 08 1. 35 ± 0. 12 1. 18 ± 0. 15 1. 38 ± 0. 30 1. 24 ± 0. 14 a K idne ys -t o-body w ei ght ra tio s (r el at ive w ei ght s) a re g iv en a s g or ga n w ei ght /g body w ei ght . b M ean s ± SD . T ab le 6 . Fi na l body and ki dne y w ei ght s of m al e Nr f2 +/ + o r Nr f2 -/ - gpt d el ta m ic e tr ea te d w ith K B rO3 o r N FT fo r 4 o r 1 3 w ee ks 8 Fi na l body w ei ght s (g ) 4 w ee ks 13 w ee ks N o. o f an im al s 8 8 8 6 8 C ont ro l 1, 500 pp m KB rO3 2, 500 pp m NF T C ont ro l 1, 500 pp m KB rO3 2, 500 pp m NF T 5 Fi na l body w ei ght s (g ) Nr f2 +/ + Nr f2 -/ -N o. o f an im al s 4 5 5 4 4 Nr f2 +/ + Nr f2 -/ -C ont ro l 1, 500 pp m KB rO3 2, 500 pp m NF T C ont ro l 1, 500 pp m KB rO3 2, 500 pp m NF T
50 -G enot ype T re at m ent A ni m al N o. M ea n ± SD 101 14. 4 6 0. 42 102 41. 2 10 0. 24 103 20. 0 9 0. 45 104 41. 0 13 0. 32 0. 36 ± 0. 09 201 32. 1 30 0. 93 202 24. 2 17 0. 70 203 23. 7 18 0. 76 204 21. 5 9 0. 42 205 17. 6 12 0. 68 0. 70 ± 0. 19 * 301 34. 4 11 0. 32 302 51. 4 15 0. 29 303 38. 4 18 0. 47 304 18. 2 16 0. 88 305 18. 1 14 0. 77 0. 55 ± 0. 27 401 40. 7 14 0. 34 402 34. 0 13 0. 38 403 35. 4 13 0. 37 404 18. 7 4 0. 21 0. 33 ± 0. 08 501 24. 5 17 0. 69 502 31. 1 22 0. 71 503 15. 3 9 0. 59 504 29. 1 11 0. 38 0. 59 ± 0. 15 601 23. 9 14 0. 59 602 27. 7 17 0. 61 603 29. 7 17 0. 57 604 28. 8 15 0. 52 605 24. 3 11 0. 45 0. 55 ± 0. 06 T ab le 7 . Gp t M Fs in th e ki dne ys o f Nr f2 +/ + o r Nr f2 -/ - gpt d el ta m ice tr eat ed w ith K B rO3 o r N FT fo r 4 w ee ks * P < 0. 05 vs . r es pe ct iv e cont ro l gr oup Cm R , c hl or am phe ni co l r es is ta nt ; 6 -T G R , 6 -t hi ogua ni ne re si st ant ; M F, m ut an t f re que nc y Cm R c ol oni es (× 1 0 5 ) 6-T G R a nd Cm R c ol oni es MF (× 1 0 -5 ) C ont ro l 1, 500 pp m K B rO3 2, 500 pp m N FT C ont ro l 2, 500 pp m N FT Nr f2 +/ + Nr f2 -/ -1, 500 pp m K B rO3
51 -G enot ype T re at m ent A ni m al N o. M ea n ± SD 701 8. 9 3 0. 34 702 13. 1 9 0. 69 703 7. 4 11 1. 48 704 7. 4 9 1. 22 705 9. 5 4 0. 42 706 16. 6 9 0. 54 707 15. 0 6 0. 40 708 17. 5 7 0. 40 0. 69 ± 0. 43 801 12. 8 22 1. 72 802 17. 1 20 1. 17 803 17. 8 26 1. 46 804 11. 3 22 1. 95 805 13. 6 41 3. 01 806 10. 3 9 0. 87 807 21. 8 25 1. 15 808 17. 4 22 1. 27 1. 57 ± 0. 67* * 1001 15. 2 9 0. 59 1002 16. 3 8 0. 49 1003 27. 3 8 0. 29 1004 24. 0 7 0. 29 1005 18. 4 13 0. 71 0. 48 ± 0. 18 1101 9. 9 22 2. 23 1102 23. 8 41 1. 72 1103 6. 6 21 3. 17 1104 10. 2 26 2. 56 1105 13. 3 24 1. 81 1106 18. 0 23 1. 28 1107 14. 0 19 1. 36 1108 8. 4 6 0. 71 1. 86 ± 0. 78†† 1, 500 pp m K B rO3 C ont ro l 1, 500 pp m K B rO3 Nr f2 +/ + ** P < 0 .0 1 vs . r es pe ct iv e cont ro l gr oup, † † P < 0 .0 1 vs . r es pe ct iv e cont ro l gr oup Cm R, c hl or am phe ni co l r es is ta nt ; 6 -T G R, 6 -t hi ogua ni ne re si st ant ; M F, m ut an t f re que nc y T ab le 8 . Gp t M Fs in th e ki dne ys o f Nr f2 +/ + o r Nr f2 -/ - gpt d el ta m ice tr eat ed w ith K B rO3 fo r 1 3 w ee ks Cm R c ol oni es (× 1 0 5 ) 6-T G R a nd Cm R c ol oni es MF (× 1 0 -5 ) Nr f2 -/ -C ont ro l
52 -G enot ype T re at m ent A ni m al N o. M ea n ± SD 701 8. 4 6 0. 72 702 9. 2 5 0. 54 703 11. 0 3 0. 27 704 13. 6 4 0. 29 705 10. 6 4 0. 38 706 21. 3 6 0. 28 707 19. 6 4 0. 20 708 24. 5 9 0. 37 0. 38 ± 0. 17 901 15. 3 21 1. 37 902 13. 5 10 0. 74 903 16. 2 12 0. 74 904 12. 0 13 1. 09 905 11. 0 14 1. 27 906 24. 3 24 0. 99 907 14. 3 16 1. 12 1. 04 ± 0. 24* * 1001 15. 2 5 0. 33 1002 13. 3 8 0. 60 1003 28. 3 11 0. 39 1004 24. 2 9 0. 37 1005 22. 9 6 0. 26 0. 39 ± 0. 13 1201 13. 1 21 1. 60 1202 18. 8 22 1. 17 1203 21. 6 22 1. 02 1204 13. 2 15 1. 13 1205 12. 3 15 1. 22 1206 7. 6 12 1. 58 1207 12. 3 22 1. 79 1208 13. 6 23 1. 69 1. 40 ± 0. 30†† C ont ro l 2, 500 pp m N FT Nr f2 -/ -C ont ro l T ab le 9 . Gp t M Fs in th e ki dne ys o f Nr f2 +/ + o r Nr f2 -/ - gpt d el ta m ice tr eat ed w ith N FT fo r 1 3 w eek s ** P < 0 .0 1 vs . r es pe ct iv e cont ro l gr oup, † † P < 0 .0 1 vs . r es pe ct iv e cont ro l gr oup Cm R , c hl or am phe ni co l r es is ta nt ; 6 -T G R , 6 -t hi ogua ni ne re si st ant ; M F, m ut an t f re que nc y Cm R c ol oni es (× 1 0 5) 6-T G R a nd Cm R c ol oni es MF (× 1 0 -5) 2, 500 pp m N FT Nr f2 +/ +