OPTIMAL ANALYSIS OF ENERGY-SAVING TECHNOLOGY AND ELECTRICITY
MARKET FOR DEMAND SIDE MANAGEMENT
デマンドサイドマネジメントの省エネルギー技術と電力
市場の最適分析に関する研究
2021 年 3 月
俞 丹
ABSTRACT
Demand side management (DSM) is an important means to regulate user load and
relieve power grid pressure. Demand side management (DSM) has been popularized
earlier, but the implementation progress is different in different countries. At the same
time, the rapid development of renewable energy and power market has brought new
changes to DSM. This study took Japan as an example to study the influence and
promotion effect of policy, electricity price and demand side characteristics on energy
saving technology, which hope to identify the DSM work in Japan and verify the actual
effect. Combined with the promotion process of Japan's power market, theoretical
reference for the future development of DSM could be provided. The results showed
that the promotion and performance improvement of microgrid and air conditioning
system are most suitable for the development of DSM. At the same time, the
liberalization of electricity market is helpful to the promotion of demand side
technology.
In chapter 1, RESEARCH BACKGROUND AND PURPOSE OF THE STUDY. The
development background and specific implementation forms of demand side
management were systematized and summarized. Distributed energy and power market
liberalization, two key development directions of technology side and economic side,
were discussed in detail. Finally, Japan's relevant policies were elaborated, and the
research objectives and specific contents are put forward.
In chapter 2, DEVELOPMENT PROCESS AND RESEARCH STATUS OF
DEMAND SIDE MANAGEMENT (DSM). The typical development process of
demand side management was sorted out. Then, the related research on the technology
and economic side of DSM were summarized. Finally, the application of computer and
Internet technologies such as machine learning and blockchain in DSM was described.
In chapter 3, TECHNICAL SIDE EQUIPMENT MODELING AND ECONOMIC
SIDE THEORETICAL DERIVATION. The research method was proposed, and the
demand side load analysis and technical side equipment characteristics analysis were
carried out. At the same time, the economic side means of demand side management
was studied theoretically.
In chapter 4, THE PROMOTION ANALYSIS OF POLICIES ON THE
TECHNICAL SIDE OF DSM. The research studied the effect of Japan's "top runner"
II
improvement of demand side equipment was analyzed by factor decomposition model,
and the implementation effect of the policy was identified by moving window and
correlation analysis. Finally, the rebound effect of energy efficiency improvement of air
conditioning, passenger car and lighting was analyzed. The results showed that the
policy has the best promotion effect on air conditioning system.
In chapter 5, THE EFFECT ANALYSIS OF ELECTRICITY PRICE ON THE
TECHNICAL SIDE OF DSM. The correlation analysis of electricity price, the
short-term forecast and the influence of different electricity price modes on technical side
means were analyzed. At the same time, hybrid electricity price and widening the gap
between peak and valley electricity prices are conducive to the promotion of LED
lighting and energy storage battery respectively.
In chapter 6, ANALYSIS OF DEMAND SIDE ADAPTABILITY UNDER THE
JOINT ACTION OF TECHNOLOGY AND ECONOMIC MEANS. The adaptability
of different types of buildings under different demand side liberalization degrees was
compared. Firstly, the typical demand side load was obtained by reducing the dimension
of the target building. Then, three kinds of demand side liberalization degrees, namely,
self-use, photovoltaic grid price and free trade, were set to study the adaptability of
different typical demand side loads to different degrees of liberalization. The results
showed that in the case of low demand side liberalization, users with gentle load change
have advantages. In the case of high degree of liberalization, shopping malls with
obvious load difference but strong regularity are more suitable to participate in power
trading as load aggregators.
In chapter 7, DISCUSSION, CONCLUSION AND PROSPECT. The discussion and
conclusions of whole thesis is deduced and the future work of DSM has been discussed.
III
Optimal Analysis of Energy-saving Technology and Electricity
Market for Demand Side
Management
CHAPTER ONE
RESEARCH BACKGROUND AND PURPOSE OF THE STUDY
1.The importance of demand side management 2.Implementation of demand side management 3.Overview of demand side management in Japan
CHAPTER TWO
DEVELOPMENT PROCESS AND RESEARCH STATUS OF DEMAND SIDE MANAGEMENT 1.The development of demand side management
2.Technology and economic means of DSM 3.Application of new technology in DSM
CHAPTER THREE
TECHNICAL SIDE EQUIPMENT MODELING AND ECONOMIC SIDE THEORETICAL DERIVATION
1.Demand side load modeling 2.Typical demand side equipment 3.Price, reward and punishment mechanism 4.Theoretical derivation of an economic measure
CHAPTER FOUR
THE PROMOTION ANALYSIS OF POLICIES ON THE TECHNICAL SIDE OF DSM
1.Identification of "Top Runner" policy 2.The effect of "Top Runner" policy 3.The rebound effect of "Top Runner" policy
CHAPTER FIVE
THE EFFECT ANALYSIS OF ELECTRICITY PRICE ON THE TECHNICAL SIDE OF DSM
1.Correlation of long-term electricity price 2.Volatility of short term electricity price 3.The influence of electricity price mode
CHAPTER SIX
ANALYSIS OF DEMAND SIDE ADAPTABILITY UNDER THE JOINT ACTION OF TECHNOLOGY AND
ECONOMIC MEANS 1.Distributed micro grid system for self use
2. Photovoltaic Feed-in traffic 3.Electric vehicle to grid (V2G) aggregator
4.Demand side adaptability analysis
CHAPTER SEVEN
Ⅴ
ABSTRACT
... ISTRUCTURE OF THIS PAPER
... IIICHAPTER 1: RESEARCH BACKGROUND AND PURPOSE OF THE STUDY
1.1 Background... 1-1 1.2 Overview and development of DSM ... 1-7
1.2.1 Overview of technical means ... 1-7 1.2.2 Overview of economic means ... 1-10
1.3 Key technologies of measures on the technical side ... 1-14 1.4 Key technologies of measures on the economic side ... 1-21 1.5 Development status of energy saving technology of DSM in Japan ... 1-23
1.5.1 Energy saving method ... 1-24 1.5.2 Top runner program ... 1-28 1.5.3 FIT plan ... 1-30 1.5.4 Electricity market liberalization in Japan ... 1-31
1.6 Research structure and logical framework ... 1-35
1.6.1 Research purpose and core content ... 1-35 1.6.2 Chapter content overview and related instructions ... 1-35
Reference... 1-39
CHAPTER 2: DEVELOPMENT PROCESS AND RESEARCH STATUS OF
DEMAND SIDE MANAGEMENT (DSM)
2.1 The development of DSM in typical countries ... 2-1
2.1.1 DSM development in Europe ... 2-1 2.1.2 DSM development in the U.S. ... 2-2 2.1.3 DSM development in China ... 2-5 2.1.4 New development of DSM in Japan ... 2-6
2.2 Review of DSM technology means ... 2-11
2.2.1 Changing the way users use electricity ... 2-11 2.2.2 Improvement of terminal electricity consumption efficiency ... 2-13
2.3 Review of DSM economic means ... 2-15
2.3.1 Demand side response (DR)based on price ... 2-16 2.3.2 Demand side response (DR)based on incentive ... 2-18
Ⅵ
2.4.3 The key point for demand side and power market: renewable energy ... 2-26 2.4.4 Demand side and electricity market ... 2-27
2.5 New technology and research direction of demand side management ... 2-29
2.5.1 The role of machine learning in power market and DSM ... 2-30 2.5.2 The role of Internet and digital technology in power market and DSM ... 2-32
Reference... 2-35
CHAPTER 3: TECHNICAL SIDE EQUIPMENT MODELING AND
ECONOMIC SIDE THEORETICAL DERIVATION
3.1 Movement ... 3-1 3.2 Demand side basic model ... 3-2
3.2.1 User behavior description ... 3-2 3.2.2 User demand model ... 3-2 3.2.3 Problems existing in consumers' living electricity consumption ... 3-3 3.2.4 Main influencing factors of electricity load of users ... 3-5
3.3 Modeling and analysis of typical energy consumption and energy supply equipment 3-9
3.3.1 Characteristic analysis of typical energy consuming equipment ... 3-9 3.3.2 Analysis on the effect of typical energy consumption equipment in user load ... 3-12 3.3.3 Characteristic analysis of typical energy supply equipment ... 3-14
3.4 Electricity price theory and reward and punishment mechanism ... 3-17
3.4.1 Basic definition of electricity price ... 3-17 3.4.2 Dynamic electricity price ... 3-18 3.4.3 Real-time price ... 3-19 3.4.4 Reward and punishment mechanism ... 3-21
3.5 Optimal user load distribution based on real time tariff collection strategy ... 3-27
3.5.1 Electricity charge collection strategy based on real time price ... 3-27 3.5.2 Real time price with dynamic reward and punishment mechanism ... 3-29 3.5.3 Optimal user load distribution based on real time price ... 3-30 3.5.4 User load and electricity price algorithm based on Stackelberg strategy ... 3-35
3.6 Summary ... 3-37 Reference... 3-38
CHAPTER 4: THE PROMOTION ANALYSIS OF POLICIES ON THE
TECHNICAL SIDE OF DSM
Ⅶ
4.2.1. Factor Decomposition ... 4-2 4.2.2. Moving Windows and Correlation Analysis ... 4-3 4.2.3. Life Cycle Rebound Effect ... 4-3
4.3. Research Objects and Analysis ... 4-5
4.3.1. Factor Decomposition of Energy Saving and Emission Reduction Potential ... 4-5 4.3.2. Identification of Top Runner Policy (TRP) and Analysis of Its Influence Lag ... 4-7
4.4. Impact Analysis of Equipment Energy Efficiency Improvement ... 4-12 4.5. CO2 Rebound Effect Analysis ... 4-16 4.6. Summary ... 4-18 Appendix ... 4-20 Reference... 4-23
CHAPTER 5: THE EFFECT ANALYSIS OF ELECTRICITY PRICE ON THE
TECHNICAL SIDE OF DSM
5.1 Content ... 5-1 5.2 Correlation analysis of long term average electricity price ... 5-2
5.2.1 Retail electricity price ... 5-2 5.2.2 Wholesale electricity price ... 5-5
5.3 Correlation analysis and forecast of short term electricity price ... 5-7
5.3.1 Correlation analysis ... 5-7 5.3.2 Price forecasting based on levenbreg marquardt back propagation (LMBP) ... 5-8 5.3.3 Analysis of change regularity based on moving window ... 5-10
5.4 Energy efficiency improvement effect of demand side equipment under different electricity price modes ... 5-13 5.5 Effect of demand side load regulation under different electricity prices ... 5-17 5.6 Summary ... 5-20 Appendix ... 5-21 Reference... 5-22
CHAPTER 6: ANALYSIS OF DEMAND SIDE ADAPTABILITY UNDER THE
JOINT ACTION OF TECHNOLOGY AND ECONOMIC MEANS
6.1 Content ... 6-1 6.2. Methodology ... 6-2
Ⅷ
6.2.4 Objective Function and Boundary Conditions ... 6-5
6.3. Case Study ... 6-7
6.3.1 Case introduction ... 6-7 6.3.2 Load Analysis and Dimension Reduction ... 6-8 6.3.3 Monte Carlo simulation of discharge capacity of electric vehicle ... 6-11 6.3.4 Assumptions and basic parameters ... 6-12
6.4. Result analysis ... 6-14
6.4.1 Spontaneous self-use ... 6-14 6.4.2 Feed-in Tariffs ... 6-17 6.4.3 Electricity free trade ... 6-19
6.5. Summary ... 6-23 Appendix ... 6-25 Reference... 6-31
CHAPTER SEVEN: DISCUSSION, CONCLUSION AND PROSPECT
7.1 Discussion ... 7-1 7.2 Conclusion ... 7-3 7.3 Prospect ... 7-6
RESEARCH BACKGROUND AND PURPOSE OF
THE STUDY
RESEARCH BACKGROUND AND PURPOSE OF THE STUDY ... 1
1.1 Background ... 1
1.2 Overview and development of DSM ... 7
1.2.1 Overview of technical means ... 7
1.2.2 Overview of economic means ... 10
1.3 Key technologies of measures on the technical side ... 14
1.4 Key technologies of measures on the economic side ... 21
1.5 Development status of energy saving technology of DSM in Japan ... 23
1.5.1 Energy saving method ... 24
1.5.2 Top runner program ... 28
1.5.3 FIT plan ... 30
1.5.4 Electricity market liberalization in Japan ... 31
1.6 Research structure and logical framework ... 35
1.6.1 Research purpose and core content ... 35
1.6.2 Chapter content overview and related instructions ... 35
-1-1-
1.1 Background
At present, the energy world is full of huge contradictions. There are a series of gaps between the status quo of energy system and the future development goals. On the one hand, it is the initiative of sustainable energy for all. On the other hand, there are still 850 million people without electricity in the world. The world needs to step up efforts to reduce greenhouse gas emissions, while energy related carbon emissions hit a record high in 2018. The world is full of expectations for renewable energy to promote the rapid transformation of energy, but the current energy system is still highly dependent on fossil energy. On the one hand, it is to seek sufficient and stable oil supply. On the other hand, the geopolitical situation continues to be tense and uncertain.
The two major challenges in the global energy transformation stage are the increasing demand for energy and the limitation of carbon emissions. According to International Energy Agency (IEA) statistics, the industry, transportation and residential sectors are the highest energy consumption areas. The three sections with the most CO2 emissions are electricity and heat producing, industry and transportation[1]. In the BP World Energy Outlook by British Petroleum (BP), the growth of energy demand will be largely offset by the decline in energy intensity in a gradual transformation scenario[2]. The improvement of energy efficiency can effectively reduce energy consumption and CO2 emissions. So many countries have introduced relevant policies aimed at improving energy efficiency [3; 4]]
The IEA found that COVID-19 caused global economic downturn, which led to a 3.8% drop in energy demand[5]. Overall, compared with the first quarter of 2019, global electricity demand decreased by 2.5% in the first quarter of 2020, and global carbon dioxide emissions decreased by more than 5%, as shown in Figure 1-1[6].
Of all energy sources, only renewables have grown. And it is expected that by 2020, renewable energy power generation will grow by nearly 5%. This shows the firm determination of the global energy transformation, and promoting the development of green economy has become a global consensus. Increasing the popularization of clean electricity is the key to realize decarbonization in the world today.
-1-2-
Figure. 1-1 Global energy-related CO2 emissions, 1900-2020[6]
According to the IEA sustainable development scenario, by 2070, the share of electricity in the final energy demand will increase from the current 20% to nearly 50%.and the contribution to the cumulative carbon emission reduction will be nearly 1/5. The demand for electricity will increase by 30000 TWH by then[7]. This means that from now to 2070, the annual increase in electricity demand is equivalent to the sum of the current annual electricity demand in Mexico and the United Kingdom, which is bound to promote a wider range of clean power applications, including solar, wind and nuclear power. Technologies such as renewable energy and electric vehicles, which are in the early application stage, have a certain degree of flexibility in response to the epidemic, and will continue to accelerate development in the near future. Renewable energy electricity generation is expected to grow by 7% year on year in 2021, accounting for 30% of global electricity supply. In 2020, global auto sales will drop by 15% year-on-year, but electric vehicle sales will be flat[8].
In 2019, coal accounted for 38% of global electricity, 1% lower than in 2000. With the adoption of supercritical and ultra-supercritical technologies by power plants, the proportion of subcritical power plant in fired power plant has decreased from 75% in 2000 to 40% in 2019, and coal-fired power emissions have gradually decreased. However, the reserves of fossil energy represented by coal and natural gas are limited, and emissions are inevitable when they are used. Therefore, in the future energy structure, it is bound to vigorously develop hydrogen, wind power, photovoltaic and other clean renewable energy, as shown in Figure 1-2[9]. Wind power, photovoltaic and other renewable energy power generation promote the further green transformation of energy system.
-1-3-
Among them, solar photovoltaic power generation will increase by about 25% in 2019, reaching more than 710 TWH.
Figure 1-2 Change in global electricity generation by source in the Stated Policies Scenario, 2000-2040 The power sector will be one of the first industries to achieve decarbonization through the use of low-carbon technologies such as renewable energy, CCUs and nuclear energy. By 2070, global power generation will nearly triple, with about 70% of the growth to meet the growing electricity demand of the end sector, while 30% of the growth will be in the production of low-carbon fuels, especially hydrogen. As shown in Figure 1-3[10], in the sustainable development scenario, the power generation sector will be completely decarbonized by the 1950s, and the global construction and passenger vehicle sectors will reach zero emissions by 2070.
-1-4-
Figure. 1-3 Historical and projected CO2 emissions from energy infrastructure in use and power plants under construction operated in line with past practice, 2010-2070
Under the dual challenges of economic downturn and energy transformation, in the coming decades, the global energy structure will become more diversified, and the competition among various energy producers will become increasingly fierce. With the preference of consumers and governments for clean and low-carbon energy, renewable energy will penetrate into the energy system at an unprecedented speed in the future. The proportion of renewable energy in primary energy will rise from 5% in 2018 to 20% to 60% in 2050. Electricity system operators all over the world are trying to solve the volatility of renewable energy supply. At the same time, the coal electricity output is decreasing year by year, and the user demand is becoming more and more diversified. In the future, more emerging technologies such as energy storage system, natural gas peak shaving, customer side response and virtual power plant will be applied in power system. As shown in Figure 1-4 [11], In the situation of increasing electricity demand, the global electricity structure will also become more diversified. With the liberalization of electricity market competition, customers can choose their own electricity resources. The electricity market will need more integration to adapt to this more diversified supply.
-1-5-
Figure. 1-4 Electricity demand outlook in selected regions/countries in the Stated Policies Scenario, 2019-2030
With the growth of per capita GDP and the popularity of electrification, the gap between the peak and the valley of power supply has been widening. According to the statistics of Shanghai power load management center of China, the highest power consumption load of Shanghai in 2016 was 3138MW in China, with the valley load of 8620MW, and the ratio of peak to valley was about 3.6 times. In 2017, the peak load of Tokyo was 5383MW in Japan, 1977MW in valley load, and the peak valley ratio was about 2.7 times.
Electricity grids could prove to be the weak link in the transformation of the power sector, with implications for the reliability and security of electricity supply. The projected requirement for new transmission and distribution lines worldwide in the STEPS is 80% greater over the next decade than the expansion seen over the last ten years. The importance of electricity networks rises even more in faster energy transitions.
In order to ensure the safety, stability and economic operation of the electricity grid, measures must be taken in the power generation side for peak load regulation. However, the peak shaving capacity of the grid is limited in unit life, low energy utilization and high investment cost. Therefore, the demand side peak shaving measures are particularly important. Demand side management(DSM) is a kind of electricity management activity. Among them, the electricity industry (Supplier) takes administrative, economic and technical measures to encourage users (demand side) to take various effective measures to change their electricity consumption behavior,
-1-6-
and to improve power efficiency and optimize resource allocation by reducing energy consumption and power load[12].
Demand side response(DR) is a derivative of demand side management. It is proposed by the United States after the electricity market reform, aiming at how DSM can play a full role in the competitive market to maintain system reliability and improve market operation efficiency. In a broad sense, DR can be defined as the market participation behavior of consumers in the electricity market that respond to the market price signal or incentive mechanism and change the normal electricity consumption pattern. DR organization of the United States is relatively perfect, and the types of projects are rich. The market mechanism and operation rules of DR are managed and implemented by the states according to their own actual conditions. For example, California major operational load participation plan, demand reduction plan and other projects. New York state mainly uses interruptible load to participate in day ahead spot market or operational reserve market. New York state mainly uses interruptible load to participate in day ahead spot market or operational reserve market. Similar to the United States, European countries carry out DR according to their own schemes and rules, while the European Union pays more attention to the development and construction of key DR platforms and the formulation and revision of smart electricity standards.
DSM took the lead in the U.S. in the 1970s and made significant progress in the development of DSM in response to the global environmental crisis twice. Since the oil crisis, about 50% of developed countries have reduced energy consumption per unit GDP through various measures, including DSM. In developing countries, such as DSM in China in the past 30 years, has achieved remarkable results. From 2012 to 2016, 55.3 billion kwh of electricity and 12.68 million kw of electricity were saved, equivalent to 31 million tons of loose burning coal, 55.1 million tons of carbon dioxide and 17.53 million tons of sulfur dioxide, nitrogen oxides and dust pollutants. The maximum peak load can reach 16 million kilowatts through orderly electricity consumption transfer. Through the implementation of a series of comprehensive measures such as DR, the peak load has been reduced by more than 2.83 million KW from 2013 to 2015 [13].
-1-7-
1.2 Overview and development of DSM
1.2.1 Overview of technical means
DSM proposed mainly for energy efficiency management, load management, orderly power consumption in the early stage. The means of implementing DSM are mainly divided into administrative means, technical means and economic means. DSM mainly puts forward energy efficiency management, load management and orderly electricity consumption in the early stage. It is an important energy-saving way, aiming at reducing the load demand, reducing the installed capacity, transferring part of the peak load to the low period, and reducing the load peak valley difference. The means of implementing DSM can be divided into administrative means, technical means and economic means. At present, the classification of energy saving in DSM theoretical framework is shown in Figure 1-5.
Figure 1-5 Classification of Energy Conservation in the proposed DSM theoretical framework[14].
Administrative means management means a kind of government regulation of management activities through laws, standards, policies and systems. Electricity consumption and market behavior promote energy conservation and emission reduction, restrain waste and protect the environment of the government's only administrative power[15]. Specifically, the government encourages all parties, such as power companies, to participate in the implementation of the administrative regulations formulated by the DSM program. Enterprises should be encouraged to adopt energy-saving products and technologies. The realization of administrative means is often
-1-8-
achieved through the implementation of technical and economic means. Therefore, the core means of DSM are technical means and economic means.
Technical means refers to the use of advanced energy-saving technology and management technology and corresponding equipment to improve terminal power efficiency or change power consumption mode according to specific management objects, production process and living habits. The technical means adopted to change the mode of power consumption and improve the efficiency of terminal electricity consumption are different.
1. Changing the way users use electricity 1) Direct load control
Direct load control (DLC) is a method for system dispatchers to control terminal electricity consumption through load control device during peak load period. DLC is usually used in industrial power consumption control, and the priority control is based on the principle of minimum outage loss.
2) Time controller and demand limiter
The ideal control method for peak load shifting is to realize intermittent and cyclic load control by using automatic control devices such as time controller and demand limiter.
3) Low valley and seasonal electrical equipment
Adding low-valley power equipment, that is, the peak electricity grid in summer can appropriately increase the winter electricity equipment, and the winter peak electricity grid can appropriately increase the summer electricity equipment. In the period of low daily load, the electric boiler or heat storage device is put into use for electrical insulation, and electric heating or air conditioning can be used to fill the valley in the late winter night.
4) Energy storage device
Electric energy storage devices are put into use to fill the valley during the period of low daily load of electricity grid, such as electric heat accumulator, electric vehicle storage battery and various charging devices which can be arranged randomly.
5) Cold storage and heat storage device
The most effective way to shift peak load and fill valley is to use cold storage and heat storage technology. In the low load period of electricity grid, the energy is stored by cold storage and heat storage, and released for conversion and utilization in the peak load period, so as to achieve the
-1-9- purpose of peak load shifting and valley filling.
2. Improve terminal electricity efficiency
To improve the efficiency of terminal electricity consumption is achieved by changing the consumer behavior of users, using advanced energy-saving technology and efficient equipment. The fundamental purpose is to save electricity and reduce electricity consumption, including direct and indirect electricity saving. Direct electricity saving is to use scientific management methods and advanced technical means to save electricity; Indirect electricity saving depends on improving economic management, adopting adjustment and control measures to reduce electricity consumption.
1) Lighting uses compact fluorescent lamps to replace ordinary incandescent lamps,thin tube fluorescent lamp is used to replace common thick tube fluorescent lamp, sodium lamp is used to replace mercury lamp, high efficiency inductance ballast is used to replace ordinary inductance ballast, electronic ballast is used to replace common inductance ballast, high efficiency reflector cover is used to replace common reflector lamp cover. In addition, intelligent switches such as voice control, light control, time control and sense control and key switch control are adopted to realize lighting power saving operation.
2) The electric motor with high conductivity and magnetic conductivity is used to replace the ordinary motor, the motor matching with the production process is selected to improve the average load rate of operation, various speed control technologies are applied to realize the electric saving operation of the motor, the flow operation is realized, and the empty load rate of the motor is reduced.
3) Refrigeration and air-conditioning use lithium bromide absorption refrigeration to reduce electricity consumption, and use intelligently controlled high-efficiency air conditioners and heat pumps to replace heating and air-conditioning with resistance heating to save electricity. Through the establishment of consumer behavior to adapt to human physiological conditions to reduce electricity consumption.
4) order to reduce the line loss, the high-efficiency transformer with low copper core loss is used to reduce the frequency of electricity transformation. The distribution loss is reduced by implementing the electricity saving operation of transformer, reasonable distribution line layout and adopting reactive power local compensation.
5) Through the application of dry quenching, high temperature waste heat recovery power generation, industrial furnace high temperature waste heat recovery power generation, blast furnace top discharge pressure power generation, industrial boiler residual pressure power generation to recover residual heat, it can be used to improve energy utilization and increase end-user
self--1-10-
sufficiency. Heat recovery and heat conduction equipment such as heat pump, heat pipe and high efficiency heat exchanger are used to reduce electricity consumption directly or indirectly.
6) Reasonable scheduling, through the implementation of specialized centralized production, improve the loading rate of furnace floor and reduce the electricity consumption per unit product. Continuous operation is carried out to reduce the loss of blowing in and shutdown and improve the electricity consumption efficiency of the equipment; fans, pumps and compressors operate economically.
7) Building energy conservation through the use of high thermal insulation wall materials and doors and windows structure, full use of natural light and heat.
8) Energy substitution is to replace solar energy and gas with electric energy, so as to make more economic and rational use of energy resources.
1.2.2 Overview of economic means
DR is specific technique of DSM. It can be divided into IBDR and PBDR, as shown in Figure.1-6.
Figure 1-6 DR programs[16]
In a market economy, every commodity has a price that shows its value. Electricity is a special commodity and has its specific price. Electricity price is the monetary expression of the value of electricity commodity in the process of generation, supply and use exchange. According to the price chain of the whole process of power generation, supply and marketing, electricity price can be divided into two types: generation company's on grid price, power grid company's transmission and
-1-11- distribution price and terminal sales price.
Figure 1-7 Power generation, transmission and distribution, supply and consumption system diagram As shown in Figure 1-7, the process of power supply also constitutes the formation process of electricity price, which successively forms the feed-in tariffs, transmission and distribution price and the final user price. The feed-in tariffs can be called generation price, that is, the ex factory price of the energy generated by the power plant, which reflects the scarcity of power generation resources and the cost difference. The power supply structure can be rationalized by adjusting it. The generation price is composed of generation cost, generation profit and price tax. Transmission and distribution price, also known as power grid price, refers to the price of electricity sold to the distribution company by the owner of high-voltage or ultra-high-voltage transmission or circuit. It is similar to the price of general goods sold to retailers and wholesalers. Therefore, it can also be used as a wholesale price to reflect the consumption of transmission and generation resources, to regulate the construction of transmission network, and to solve the allocation of power resources in rich and poor areas. The transmission and distribution price is mainly composed of power purchase cost, transmission and distribution cost, transmission and distribution profit and tax. The price of electricity sales refers to the price of electricity sold by distribution companies to end users. It is similar to the retail price of general commodities. It is also known as user price or retail price, which reflects the impact of users on the power supply cost. The final selling price consists of the cost of purchasing electricity from the power grid, the cost of power transmission and distribution, and the profit and tax of electricity sales.
1.Price-based DR
Price-based DR refers to users responding to changes in retail electricity prices and adjusting electricity demand accordingly. It mainly includes the following forms.
-1-12-
power supply cost in different periods of power system. Its common forms are peak-valley price, seasonal price and flood season-dry season price.
(2) Real-time pricing (RTP) is a dynamic pricing mechanism. Its renewal cycle can reach 1 hour or less. By linking the price on the user side with the clearing price in the power supply market, it can accurately reflect the change of power supply cost in each period of the day and effectively convey the price signal. RTP can compensate for the shortage of incentive for users to further reduce load when the system is short-term capacity shortage.
(3) Critical peak processing(CPP)is a dynamic tariff mechanism developed on the basis of TOU and RTP. Its main idea is to superimpose peak charges on TOU.
1) Time-of-use (TOU) pricing is a price mechanism. It can effectively reflect the difference of power system cost in different periods. Its common forms are peak valley price, seasonal price and price in flood season and dry season.
2) Real-time pricing(RTP)is a dynamic pricing mechanism. It can be updated for an hour or less. By linking the price on the user side of the clearing price in the power market, the change of the power supply cost in each period of the day can be accurately reflected, and the price signal can be effectively conveyed. RTP can compensate for the lack of incentive and further reduce the load for users in the short-term capacity shortage of the system.
3) Critical peak pricing(CPP)is a dynamic tariff mechanism based on TOU and RTP. The main idea is to add the TOU peak fee.
2. Incentive-based
The incentive-based DSM refers to the DSM implementation agencies formulate corresponding policies according to the supply and demand situation of the power system. Users can reduce the demand for electricity when the system needs or power is tight, so as to obtain direct compensation or another preferential price. It mainly includes the following forms.
1) Direct load control(DLC) refers to the way in which the direct load control mechanism closes or controls the user's electrical equipment through the remote control device during the peak power consumption of the system.
2) Interrupt load (IL) is a method that interrupt request signals are sent to users during a part of electricity interruption period by interrupting load actuator according to the peak period of power grid before the contract between supplier and demander.
-1-13-
participate in power market competition. It enables users to actively participate in market competition and obtain corresponding economic benefits by changing their electricity consumption mode, instead of simple price receivers.
4) Emergency demand response(EDR) refers to the way that users respond to the power demand of emergency interruption in an emergency.
5) Capacity auxiliary service program (CASP) is a form in which the user provides load reduction as a backup system instead of the traditional generator or provides resources.
These two types of DR projects have certain internal relations and can complement each other. For example, users can respond to price changes and make load adjustment through the implementation of DR project based on electricity price. So as to reduce the price peak and alleviate the shortage of system reserve, and further reduce the necessity of implementing incentive based DR project. Therefore, the complementation of each subcategory should be taken into account when the DR implementing agency formulates various DR projects. For example, PG&E company of California stipulates that users who participate in CPP can no longer participate in incentive based DR projects such as IL. Both DR and energy efficiency can achieve peak shaving, slow down the growth rate of demand and save electricity expenses of users. Therefore, these two resources can be collectively referred to as demand resources. From annual system planning to real-time market scheduling, DR can be flexibly deployed in different time scales, and participate in coordinating market pricing and system scheduling management.
-1-14-
1.3 Key technologies of measures on the technical side
The main areas of demand side energy consumption regulation are building fence structure, HVAC system and energy supply system. Among them, the green building evaluation system of various countries involves all the above fields, and the evaluation indicators are set for each key node of energy consumption on the demand side. At the same time, it is difficult to change the fence structure of the demand side after the construction. The demand side technology based on HVAC system and energy supply system is the main core of energy-saving technology transformation. Among them, the distributed energy system established by cocoa renewable energy and clean energy on the demand side has the most obvious effect and the fastest development.
At the end of the 20th century, the United States, the European Union, Japan and other developed countries have begun energy transformation and energy system reform. Although the social conditions and energy endowments of countries are quite different, they are all developing towards a more market-oriented, clean and intelligent direction.
The development trend of the power grid structure is: vigorously promoting the construction of the distributed energy with the integration of clean energy and renewable energy, and constituting a certain capacity of distributed energy with regional distribution network and its user load into a single controllable microgrid system. Connect and integrate these microgrids through smart grid to achieve the balance and optimization configuration of the entire power grid [18]. In the cell architecture theory put forward by Denmark earlier, the microgrid is compared to the cells. The instability of renewable energy is digested in the cell as much as possible, and then complementary relationship is formed with the large power grid. Under the guidance of this concept, in the past ten years, the research and technology of microgrid and smart grid have made great progress, and the distributed energy and renewable energy have been growing dramatically. In 2019-2040, under the established policies and sustainable development scenarios, the share of renewable energy in the new capacity of each region will be increased, as shown in Fig.1-8 [19].
-1-15-
Figure 1-8 Renewables share in capacity additions by region in the Stated Policies and Sustainable Development scenarios, 2019-2040 [17]
The EIA estimates that global power generation will grow by 79% between 2018 and 2050. Population growth and improved living standards in non OECD countries, as well as demand for housing and personal equipment, will increase electricity consumption in the residential sector. With the popularity of electric vehicles and the increase of railway power consumption, the power consumption in the field of transportation has also increased. As shown in Figure 1-9, renewable energy will account for 49% of the world's total power generation by 2050. Resource availability, renewable energy policies, regional load growth, and declining technology costs have driven the EIA's expectations for solar power growth. Among the three renewable energy sources of hydropower, wind and solar energy, EIA believes that solar power generation shares the fastest growth, while hydropower growth is the slowest [20].
-1-16-
Figure 1-9 Global solar PV and coal-fired installed capacity by scenario, 2010-2030 [19] By 2030, the total investment in renewable energy power is expected to reach $3.4 trillion. Among them, the investment in wind power and photovoltaic power generation projects will reach $2.72 trillion, accounting for more than 80% of the total investment. By 2030, the total installed capacity of renewable energy power, including hydropower, will account for 54.1% of the total installed capacity of all electric power, among which wind power and photovoltaic power generation will account for 37.9%. In the next 10 years, the global power sector will rapidly "decentralize". "In 2019, the global total annual investment in renewable energy power will be $53.1 billion; by 2030, this number will grow rapidly to US $92.54 billion. From the regional perspective, Asia, the Middle East and Europe will be the regions with the fastest growth in renewable energy power investment [21]. While the global renewable energy power development momentum is strong, coal power has been facing downward pressure. Traditional power plant operators need to show "extreme physical and digital flexibility" to compete with renewable energy power for a long time. Distributed energy system is to store the surplus energy produced by distributed generation in the energy storage equipment during the low power consumption period, release the surplus energy to the large power grid during the peak period of power consumption, realize the "peak shaving and valley filling" to ensure the dynamic stability of the grid load; assist power supply or transmission in case of power grid failure or natural disasters; ensure the power demand of users in the case of forced power failure or power supply interruption. Application of distributed energy in common fields is shown in Fig 1-10 [22].
-1-17-
Figure.1-10 Applications of DER in three domains [21]
Power selling enterprises must carry out DSM, and DSM will gradually give consideration to energy-saving services. After that, user energy trusteeship and energy efficiency trusteeship will become a new profit model. At this time, the technical advantages of developing distributed energy in energy efficiency trusteeship will be reflected. Compared with other energy utilization modes, the residual heat generated by distributed natural gas power generation can be fully utilized. Its comprehensive efficiency is high, the transmission distance is short, and the line loss is less consumed. Meanwhile, the double peak shaving of electricity and natural gas can be carried out. The energy efficiency enhancement will promote the establishment of the energy internet and improve the competition service through the "Internet +".
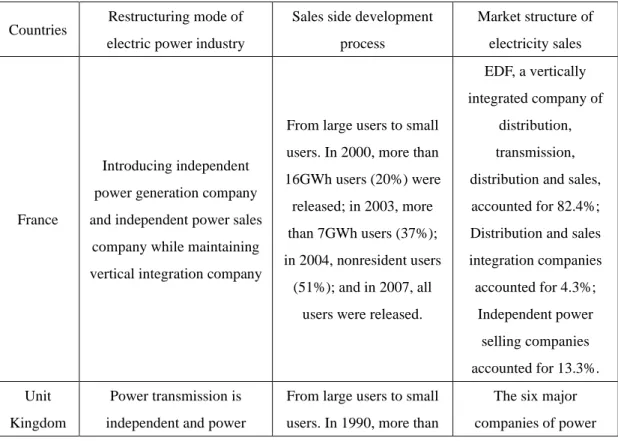
The power grid is currently shifting from a market for the energy of seller to buyer, and the related management mode has also changed from the planned economic dispatching mode to the market-oriented management with the full participation of consumers, which is the future direction of the development of distributed energy. In the future, there will be a large number of distributed generation grid connected, including distributed photovoltaic or small energy storage power station. Small power supply will be aggregated through the microgrids to replace the large power supply, giving full play to the advantages of decentralization and intelligence [23]。
With the rapid development and construction of distributed energy, power demand side management will also develop rapidly. If the demand side power consumption can be interrupted, transferred and misappropriated during the peak period, it will provide a lot of energy space for the society. However, with the development of society, the demand side itself becomes the power generation side. Thus, the power supplier, consumer and user are the same one, so the technology,
-1-18-
mechanism, power balance and other issues need to be addressed. The main force of DSM implementation is not only distributed energy, but also the comprehensive optimization of various energy sources, such as microgrid and large grid.
Figure 1-11 Working concept of Smart Grid [23].
The US Department of energy mentioned in grid 2030 that smart grid (as shown in figure 1-11) is a fully automated power transmission network, which can monitor and control each user and grid node, and ensure the bidirectional flow of information and power between all nodes in the whole transmission and distribution process from the power plant to the end user [24]. Smart grid and Microgrid technology are increasingly integrated with the Internet. Although the concept of Energy Internet has not been formally proposed, the de facto energy Internet has gradually formed. Since Boulder, Colorado, completed the first phase of the smart grid project in 2008, more states began to test run the smart grid. IBM, Google, Intel, Cisco, general motors and other giants joined in. IBM applied its own software and server to the smart grid system, and Cisco mainly focused on the network system connecting meters, converters, digital power stations and power plants Google has developed an application that uses electricity meters to save electricity. In Europe, Germany has established a nationwide electricity sales platform. At the beginning of 2015, there are more than 1000 power suppliers, which can provide more than 9000 kinds of power packages. Some companies are committed to developing new customized packages (such as industrial electrolytic aluminum packages, small city family of three packages, etc.), and some companies provide users
-1-19-
with power package search and screening services. Such a division of labor has been very meticulous. In 2016, 42% of public electricity in California was renewable, which has led to solar curtailment, for example, in summer afternoons. Because the amount of solar power fed back to the grid is too much that the power companies can absorb. This will result in a "negative rate table", that is, if the grid is an used system, it will have a lot of capacity to handle additional energy when the power generation is insufficient, such as an excess of load. However, if too much renewable energy is fed back to the grid, the power companies cannot deal with it. The solution to the excessive load of renewable energy is to greatly increase the energy storage capacity. Some energy storage devices come out in the form of a large number of miniaturized household systems, so that people can improve their electricity bills. However, the biggest driving force of energy storage devices is the size of power companies. Many power companies have high renewable portfolio standards (RPS) goals, as shown in Figure 1-12 [25]。
Figure 1-12:Renewable Portfolio Standards (RPS) strategy of 29 states and Washington D.C The energy storage system keeps the hope of reducing the cost for the end users. At the same time, the generator is connected to the higher quality distributable power production by changing the time difference of power production. The energy storage system keeps the hope of reducing the cost for the end users. At the same time, the generator is connected to the higher quality distributable power production by changing the time difference of power production. By adjusting the load, absorbing the peak power, providing power when the power supply suddenly decreases, and storage local energy can alleviate the power fluctuations caused by renewable energy production and output. The smooth production curve can provide a more stable and reliable power source for the power grid. Some power companies have requirements for power generation equipment connected to the grid, which requires energy storage to adjust the waveform of power production. The utilization of energy storage system can help power companies to postpone the upgrading of basic load power stations,
-1-20-
or delay the increase of new generation capacity, because the increase of new generation capacity will lead to the increase of cost index. At present, there are many ways to store energy, which depends on the specific application and the required system characteristics. Energy can be stored in the form of electric, mechanical, thermal or chemical storage systems, each with its own advantages and applications. Electric storage is the most common way, usually adopts battery or capacitor. From watch batteries to the latest lithium-ion batteries in data storage centers, and large-scale storage systems of power companies. According to the Research Report of Navigant research, the revenue of global distributed energy storage system reached $452 million in 2014, and it is expected to exceed $16.5 billion by 2024. The development of advanced chemical battery technology, including lithium-ion, liquid flow battery, lead-acid battery and other new generation chemical battery, will promote the rapid development of distributed energy storage system. These advanced battery technologies for DSM will help to meet the needs of distributed solar photovoltaic power generation, electric vehicles, charging piles and household energy networks.
-1-21-
1.4 Key technologies of measures on the economic side
The last decade,technological advances, structural market changes, regulatory intervention, and political influences has contributed to the capital integration of global power market and the continuous change of market rules [26]。
First, the electricity market-oriented reform presents the trend of globalization. As of 2009,
86.49% of the global population has experienced electricity market-oriented reform, and the total GDP of power market-oriented countries accounts for 94% of global GDP. No matter in terms of population, GDP share, national development status and continent distribution, there is no doubt that this round of reform is global. Although the background, path and effect of the reform in different countries are not the same, it has become a consensus that they all hope to improve the performance of the power industry and promote the economic and social development of their own countries or regions.
Second, the electricity market-oriented reform presents regional imbalance. The
development progress and marketization degree of electricity market-oriented reform in different continents and regions are unbalanced, and the reform progress of countries in African and Southeast Asian is slow. Europe and Oceania are the two continents with the largest increase in the degree of electricity marketization. Europe, which has the majority of developed countries, has made good achievements in this round of power market-oriented reform. Not only has the score of power marketization reached 7.38, but also the score of power marketization degree has increased by 6.28 scores in this period. New Zealand and Australia in Oceania have opened up more quickly, up 6.75 scores from 1990 to 2009 owing to the spot and futures markets for electricity.
Third, the degree of electricity market-oriented reform is different under the level of national development. The basis of electricity marketization in developed countries is higher than
that in developing countries. In 2009, the average score of power marketization in developed countries reached 6.96, while that in developing countries was 5.25 scores. However, there is no doubt that both developed and developing countries have improved rapidly, with 6.23 and 3.97 scores, respectively. However, there is still a big gap between developed and developing countries in the degree of electricity marketization.
Fourth, the degree of electricity marketization is positively correlated with the level of economic development. By observing the results of the polynomial regression fitting model between the degree of electricity marketization and the level of economic development of 98 countries/regions in 1990 and 2009, it can be seen that, compared with 1990, the influence of economic development of various countries on power marketization in 2009 is higher. By observing the fitting model of the impact of electricity marketization degree on per capita GDP in different countries, we can see that
-1-22-
electricity marketization also affects economic development. When the degree of power marketization is low, the efficiency of the power industry cannot keep up with the speed of economic development, and even hinder the economic development. The state began to carry out the reform of power marketization. With the deepening of power market reform and the improvement of energy supply and distribution efficiency, the power industry began to promote stable economic growth within possible limits. Compared with 1990, with the market-oriented reform in most countries, the difference of power marketization degree among countries in 2009 is also gradually increasing, which results in the stronger impact of power marketization on the economy. At present, the continuous liberalization of the power market has become one of the main development trends to promote the power transformation. Power market liberalization is to improve market efficiency, reduce resource waste, reduce retail price and stimulate technological innovation by deregulation [27] and promoting benign competition. According to the experience of the United Kingdom and other countries since the beginning of deregulation reform in the 1990s, the main factors affecting the competitiveness and efficiency of the power market are local market power, market transparency, barriers to market entry, level of market risk management, sufficient price signals and market structure with appropriate incentives for investors [28]. It can be concluded as the game process between market power and supervision system.
An efficient regulatory system can attract investment in the power market, eliminate market power, reduce unfair competition and improve the profits of operators. The current regulatory system cannot meet these needs at the same time [29]. When the regulatory system is committed to reducing consumer electricity prices, the profits of operators, distribution companies and storage Investors [30] will be greatly reduced. When the regulatory system is committed to the elimination of market power, it will make the consumer price soar [31]. Therefore, while power market liberalization brings dividends to the society, there are also regulatory risks and the distribution of interests of all participants [32].
The development of artificial intelligence and blockchain technology not only promotes the process of power market liberalization, but also realizes the deep application of interdisciplinary technology in the process of power market reform. AI and blockchain technology, combined with Internet of things, GIS and BIM technologies, improve the transparency of electricity price trading by building a peer-to-peer (P2P) electricity trading trading system. It can reduce the time cost and economic cost of transaction, reduce the regulatory risk and improve the quality of supervision.
-1-23-
1.5 Development status of energy saving technology of DSM in Japan
In the 1970s, Japan began to vigorously implement power demand-side management (DSM). From 1973 to 2014, GDP increased by 2.4 times, but industrial energy consumption decreased by 10%. The level of energy saving reached the highest level in the world. In the 1990s, Japan began to carry out the demand resource (DR) technology research, but it was after the East Japan earthquake in 2011 that Japan started to implement DR technology.
In 1995, access to the power generation side was liberalized. Through public bidding, independent power generation enterprises "IPP" were allowed to be established, and "General Electricity Utilities" (GEU) could purchase electricity from IPPs. In 1999, the introduction of Power Producer and Supplier (PPS) to engage in the electricity sales business, can sell electricity to "ultra-high voltage" industrial and commercial enterprises. In March 2000, such large users accounted for 26%. In 2003, the freedom of users to choose power suppliers was further expanded, and "high voltage" small and medium-sized industrial and commercial users could choose power suppliers freely. By April 2004, 40% of users were free to choose. In April 2005, the proportion rose to 63%. In June 2014, Japan published its fourth Basic Energy Plan: in order to promote effective electricity saving on the demand side, with the steady progress of power reform, it is necessary to actively create conditions to introduce a new "demand response" mode, maintain a reasonable scale of power generation capacity and realize stable power supply through user side demand management. In June 2015, the "Japan Revitalization Strategy" clearly put forward a policy to promote VPP. Subsequently, the Ministry of Economy, Trade and Industry of Japan began an auxiliary business to try to solve this problem by remotely controlling the power generation equipment and batteries of factories and households. The goal of the project is to integrate all kinds of power sources into a unified power plant (Virtual Power Plant) to make it work. Therefore, the project is named as "demonstration of virtual power plant with active demand side energy".
In 2016, the "Japan Revitalization Strategy" formulated by the Japanese government proposed to achieve the goal of demand response accounting for 6% of the total power demand by 2030. With DR response electricity (power I-B) listed and traded on the wholesale market, 2017 is known as the "first year of DR" in Japan. The fifth Energy Basic Plan issued in July 2018 continued to clarify the speeding up of low-cost energy storage batteries, V2G (Vehicle to Grid), power-to-gas (P2G) technology promotion, and strengthening of low-power wide area network technology (LPWA) and M2M , P2P technology research and development to further promote the low-carbon power supply. Due to the extreme power shortage caused by the Great Japan Earthquake in March 2011, the Japanese government has made great efforts to strengthen DSM by means of administrative and economic means. With the active cooperation of the whole society, power-saving actions have
-1-24-
achieved remarkable results. During the summer peak power consumption period after the earthquake, under strict DSM measures, the maximum daily load of Tokyo Electric Power in summer decreased from 58.87 million kW in 2010 to 49.22 million kW in 2011, with a year-on-year decrease of 16.3%. In 2016, the demand response capacity of Japan Electric Power Company was approximately 10.7GW, of which 78% of the load was released. In 2016, seven demonstration projects in Japan received a total of 2.65 billion yen in subsidies. In April of the same year, the "Energy Innovation Strategy" formulated a government subsidy plan from 2016 to 2020, vigorously supporting enterprises to carry out VPP technology research and development. One of the key tasks is to verify the reliability of virtual power plants above 50MW, and plan to realize VPP economic independence by 2020. In December 2017, Nippon Power I realized unified regulation and control of power user-side load resources through bidding, and completed a response of 1.33 million kW throughout the year, of which DR reached 958,000 kW, with a value of about 3.6 billion yen. In 2017, six demonstration projects received subsidies totaling more than 6 billion yen.
After several rounds of electricity reform, Japan has gradually established a market operation mechanism based on the participation of DR and VPP in the futures market, day ahead market, hour ahead market and spot market. In the future, new electricity market mechanisms such as base load market, capacity market, non-fossil value market and auxiliary service market will be continued to establish and form. From May this year, the FIT green certificate will be traded in the non-fossil value market, and this market will also be open to all non-fossil energy sources in 2019. In order to promote new power companies to participate in the baseload power trading competition, Japan plans to create a baseload power market in 2019. The competitive power market also requires the establishment of a market mechanism for power capacity and capacity regulation. In 2020, Japan will launch a capacity market and create a demand regulation market. The competitive electricity market also requires the establishment of a market mechanism for power capacity and capacity regulation. In 2020, Japan will launch a capacity market and create a demand regulation market.
1.5.1 Energy saving method
Due to its "congenital deficiency" in energy resources, Japan attaches great importance to the conservation and utilization of energy, and its energy-saving work level is in a leading position recognized in the world. More than 90% of greenhouse gas emissions are carbon dioxide in Japan, and most of them come from energy. Electricity accounts for more than 40%. Of all greenhouse gases, about 30% comes from electricity.
If the potential of reducing carbon dioxide emissions before 2030 is classified by technology, we can get the following estimation. Energy saving can reduce about 60% of the world's carbon dioxide emissions and about 70% of the emissions of developing countries [33]. As a global warming against
-1-25-
strategy, in the world tide of reexamining nuclear power plants after the East Japan earthquake, energy conservation is very effective, which, together with the possibility of renewable energy, has attracted worldwide attention.
In response to the two oil crises in 1973 and 1978, Japan enacted the Energy Conservation Act in 1979. Since the promulgation of the law, through the cooperated efforts of the government and the masses, the energy consumption reduction rate in Japan has increased by 37% in the past 30 years. This is mainly the result of a two-pronged energy conservation policy with restrictions on the industry and financial support. The government invested a budget of about 100 billion yen in the field of energy conservation only when the Energy Conservation Act was promulgated in 1979. In addition, a number of support policies have been introduced in the tax system, policy investment, and finance [34].
The composition of this Energy Conservation Act includes energy conservation standards for manufacturing plants, residential buildings, and machinery and appliances. This benchmark is revised every few years. Four energy-saving benchmarks were issued and strengthened including the factory business department (including business buildings, hospitals, shopping malls), transportation departments, residential buildings, as well as the mechanical appliances and automobiles in Top Runner Program (Top Runner). In order to meet the standards, the industry has formulated various autonomous action plans to save energy.
According to the Energy Conservation Act, factories and business departments have designated factories for energy management, and the scope of restrictions has also been expanded from manufacturing to business departments. In the 2005 revision, the transport industry was added to the regulations, and the shipper was also included in the scope of the regulations. In the residential construction sector, the content of the code is gradually strengthened. Especially in 1998 when the machinery department was revised to introduce the Top Runner Program. This sets a high level that must be achieved in the next few years. So far, standards have been set for 21 products including automobiles, home appliances, and lighting appliances.
For example, when the car Top Runner Program was announced in 1999, car manufacturers accepted this rather strict regulation. As a result, car manufacturers developed toward the set future target value, and competition among manufacturers occurred [35]. Regarding the achievement of the goal before 2010, Mitsubishi Motors announced in 2001 the ambitious goal of "achieving the plan by 2005". Other companies followed suit and announced plans to achieve the goal in advance and achieved the goal ahead of schedule. Figure 1-13 shows the total energy supply of the five countries in 2018 [36].
-1-26-
Figure 1-13 Top five countries by total energy supply by energy source, 2018
In 2015, the Japanese government announced its long-term energy supply and demand outlook based on the Strategic Energy Plan (2014). The outlook puts forward an ideal structure of energy supply and demand in 2030, which can be achieved if appropriate measures are taken to achieve the basic objectives of energy policy: security, energy security, economic benefits and environmental protection.
Energy efficiency and renewable energy play a key role in achieving all these goals by promoting energy independence, reducing oil and gas imports and reducing greenhouse gas emissions. Under the new plan, final energy demand will be saved by as much as 50.3 billion liters (crude oil equivalent) by 2030. Divided by industry, the transportation industry will save 1.607 million kiloliters, followed by the commercial sector with 1.226 million kiloliters, the residential sector with 1.160 billion kiloliters, and the industrial sector with 1.042 million kiloliters. These figures show that from 2012 to 2030, the final energy intensity needs to increase by 35%. In 2030, renewable energy power generation is 237-252 TWh, accounting for 22-24% of total power generation, solar photovoltaic power generation is 7.0%, wind power generation is 1.7%, and biomass power generation is 3.7-4.6%. Geothermal power generation is 1.0-1.1%, and hydropower generation is 8.8-9.2%.
In 2015, the Japanese government published the Long-term Energy Supply and Demand Outlook based on the Strategic Energy Plan (2014). This outlook presents the ideal structure of energy supply and demand for 2030 that can be realized if appropriate measures are taken to achieve the fundamental objectives of energy policy: safety, energy security, economic efficiency and
-1-27-
environmental protection.Energy efficiency and renewable energy plays a key role in achieving all these objectives because they can contribute to energy independence, to the reduction of oil and gas imports and to the reduction of greenhouse gas emission.According to this new plan, the final energy demand should save as much as 50.3 billion litres (crude oil equivalent) by 2030. By sector, savings from transport will amount to 16,070 thousand kilolitres, followed by commercial at 12,260 thousand kilolitres, residential sector 11,600 thousand kilolitres and industry at 10,420 thousand kilolitres. Those figures indicate that 35% improvement of final energy intensity needs to be achieved from 2012 to 2030. Renewable electricity generation would be 237-252 TWh, and its share in total electricity generation would be 22-24% in 2030: solar PV 7.0%, wind 1.7%, biomass 3.7-4.6%, geothermal 1.0-1.1% and hydro 8.8-9.2%.
In accordance with the development of the world economy, changes in the energy environment, and energy-saving technological innovation, the Japanese government formulated the fifth Energy Strategic Plan in 2018. The plan puts forward the development plan and target for 2030: By 2030, the total energy consumption will be reduced by 43 million tons of standard oil. Clean energy utilization rate reached 44%, renewable energy power generation accounted for 22-24%, and energy self-sufficiency rate increased to 24%. Greenhouse gas emissions will be reduced by 26% in 2030 compared with that in 2013, and 80% by 2050, so as to realize the new goal of "low-carbon" to "decarbonization". Energy conservation and energy efficiency, to achieve an energy-saving society in an all-round way, to achieve 100% energy-saving popularization rate of circulation products by 2020 and 100% of energy-saving popularization rate of stock products by 2030.
Since 2003, the Japanese government required public building builders to submit mandatory energy-saving plan reports based on energy-saving standards. In 2005, the Japanese government began to require residential building builders to submit mandatory energy-saving plan reports. According to statistics from the Ministry of Land, Infrastructure and Tourism (MLIT), the submission rate of mandatory energy-saving reports in 2005 was 100%, of which 85% of public buildings met the requirements of the 1999 version of CCREUH at the design stage, while this figure was only 34% in 2000. A housing evaluation report based on the Housing Quality Assurance Law shows that 36% of newly built housing in 2006 met the requirements of the 1999 version of CCREUH.
On September 23, 2009, the Japanese government announced an energy-saving goal: By 2020, greenhouse gas emissions will be reduced by 25% compared to 1990. Based on the current state of end-use energy in Japan, building energy conservation is regarded as the most energy-saving potential field. Based on the latest goals, the Ministry of Economy, Trade and Industry and the Ministry of Land, Infrastructure, Transport and Tourism jointly established the "Building Energy Conservation Promotion Committee for Building a Low-Carbon Society", and in April 2012 passed
![Figure 1-8 Renewables share in capacity additions by region in the Stated Policies and Sustainable Development scenarios, 2019-2040 [17]](https://thumb-ap.123doks.com/thumbv2/123deta/8004088.1250231/29.892.229.643.132.560/figure-renewables-capacity-additions-policies-sustainable-development-scenarios.webp)
![Figure 1-9 Global solar PV and coal-fired installed capacity by scenario, 2010-2030 [19]](https://thumb-ap.123doks.com/thumbv2/123deta/8004088.1250231/30.892.233.638.149.533/figure-global-solar-coal-fired-installed-capacity-scenario.webp)