A Comparison of Centroid Factor Extraction Methods
for Q Methodology
Shawn BANASICK
Q 方法論における重心因子分析抽出法の比較について ショーン・バナシック 神戸女学院大学 文学部 英文学科 教授 連絡先:ショーン・バナシック [email protected]Abstract
Q methodology is an approach to systematically studying subjectivity that draws on both qualitative and quantitative methods. Despite the improvements in computing power that have made principal component analysis and other types of factor analysis possible, centroid factor analysis remains an important component of Q methodology. In this paper the Tucker-MacCallum method for the extraction of centroid factors is compared to the more commonly used methods in Q methodology. Four data sets of varying size are examined using the three factor extraction methods. The results show that the three methods tend to produce very similar loadings for the first two or three factors, but then tend to have divergent results for the remaining factors. For each of the four data sets examined in the paper, at least one of the methods had difficulty producing well-defined factors. The “criterion L” statistic provided by the Tucker-MacCallum extraction method did not provide much assistance for decisions related to the number of factors that should be retained for analysis. Overall, the results suggest that the Tucker-MacCallum extraction method could be a useful addition to the currently available methods in Q methodology.
Keywords: Q methodology, centroid factor analysis, Tucker-MacCallum centroid factor extraction method
要 旨 Q 方法論は、定性的手法と定量的手法を利用して主観的な考え(subjectivity)を体系的に研究する アプローチ法である。主成分分析や他の因子分析は計算能力が向上したにも関わらず、重心因子分析 は Q 方法論の中で重要な役割を果たしている。本論文では、重心因子分析を抽出するために Q 方法 論で使用されていない Tucker-MacCallum(T-M)法と、Q 方法論で一般的に使用されている手法を 比較する。様々なサイズと構造の異なる⚔つのデータセットを⚓つの因子抽出法で調べたところ、こ れら⚓つの手法は最初の⚒〜⚓の抽出された因子に対して非常に類似した負荷を生成する傾向にある ことを示したが、残りの因子に対してはそれぞれ異なる結果をもたらしている。本論文で検討した⚔ つのデータセットについて、少なくとも一つの手法で次善となる要因が生じた。T-M 法によって出 てくる結果は、より詳しい統計が抽出されたが、重心因子分析のために必要な要因の数を決めるため の情報は、こちらの研究ではあまり役立たなかった。これらの結果として、T-M 法は Q 方法論で現 在使用されている手法に併せて有用である可能性があることを示唆している。 キーワード:Q 方法論、重心因子分析、Tucker-MacCallum 重心因子抽出法
1. Introduction
Q methodology combines qualitative and quantitative methods to provide a systemic approach to the study of human subjectivity (Stephenson 1935, Brown 1993). In a Q methodological study participants are asked to compare and rank a series of statements about a topic according to their opinions and feelings. The participant rankings for the statements (called “Q sorts”) are then correlated and factor analyzed. The resultant factors represent perspectives or viewpoints on the research topic (Brown 1993, 114).
Centroid factor analysis continues to be an important option for Q methodological researchers. Before the 1980s, it was widely used in psychology and other disciplines, but as computing power improved many researchers shifted to principal components analysis or other techniques (Comrey and Lee 1992). Researchers using Q methodology, however, have continued to emphasize the need to retain centroid factor analysis because its assumptions and computational steps are a better match with the philosophical approach of Q methodology (Ramlo 2014). Because centroid factor analysis is rarely available in current commercial statistical software packages, researchers must rely on software specifically designed for Q methodology. In the most commonly used software applications there are only two centroid factor extraction methods available – one described by Brown (1980), and the other developed by Horst (1965).
The purpose of this paper is to assess the utility of a third method of centroid factor extraction developed by Tucker and MacCallum (1997) in relation to the two currently available methods. Four data sets are examined, and the factors extracted by each method are compared in terms of the differences in the factor loadings and the overall similarity of the factors extracted. The Tucker-MacCallum factor extraction method also provides for the calculation of a “criterion L” statistic, which they argue can be used to assist the researcher in determining the number of factors that should be accepted as being reliable for analysis. In this research Tucker and MacCallum’s criterion L statistic is evaluated relative to several other statistics commonly used for this purpose.
2. Method and Data
There are three open-source software packages designed for use in Q methodological research: the “qmethod” package for the R statistical computing environment (Zabala 2014), the PQMethod software application (Schmolck and Atkinson 2014), and the KADE software application (Banasick 2019). The qmethod R package, however, does not include any centroid factor extraction methods. PQMethod and KADE both include the Brown (1980) and Horst (1965) extraction methods.
their computation steps, but a lack of space prevents a full description of these differences.1)One of the most important differences between the Brown and Horst methods is related to the estimates of the diagonal entries of the residual matrix. The Tucker-MacCallum method differs from the Brown and Horst methods not only in terms of the estimates of the diagonal entries, but also in that it relies on an “algebraic approach” (1997, 202) to extracting factors rather than a geometric approach. For this research, the Brown and Horst centroid factors were extracted using the KADE software package. The Tucker-MacCallum factor extraction method is not included in any software package, so its centroid factors were calculated with a custom software extension for KADE developed by the author.
Four data sets were used to evaluate the factor extraction methods. The data were selected based on their ability to highlight differences between the three factor extraction methods. The first data set is from Brown (1980) and is based on the work of Lipset (1963). This data is often included as sample data with open-source Q methodology software. The second data set is from an unpublished 2014 study conducted by the author on student perceptions on the use of technology in the classroom. The third is from Barchak’s (1984) “Knowledge or Certainty” study (hereafter referred to as “KOC”), and is available from the Q Study Archive webpage (Schmolck n.d.). The fourth data set is comprised of artificial Q sorts generated with software written by the author. Three seed Q sorts were created and added to the data set. Randomized Q sorts were then generated by the software, compared with one of the seeded Q sorts, and added to the data set if their Pearson correlation coefficient was larger than a pre-determined level.
Following Brown’s (1980, 223) recommendation, seven factors were extracted for comparison. While statistical recommendations, such as those discussed below, may suggest fewer than seven factors for extraction, the extra factors can be used to improve the factors of interest through the judgmental rotation process (Brown 1980, 223). For ease of comparison, the factors extracted by the three methods, including factor loadings and eigenvalues, are combined into a single table and organized by factor number. A second table shows the raw differences between the individual factor loadings and the Pearson correlation coefficient as a measure of similarity between pairs of factors extracted by the three methods. The results shown in these tables can be used to determine if the differences between the factors are due to the influence of unusual results for individual participants or from systematic differences created by variations between the extraction methods.
The contribution of Tucker-MacCallum’s criterion L statistic for decisions related to the number of factors to retain is evaluated by comparing it with Kaiser’s rule, Humphrey’s rule, and the largest factor loading of the residual matrix. Kaiser’s rule states that factors should be accepted or seen as reliable for analysis only if their eigenvalues are greater than one (Kaiser 1960). Humphrey’s rule is described in Fruchter (1954), and requires that the “cross-product of its two
1) A full discussion of the computational steps with worked examples can be found in Brown (1980, 208-224), and Tucker and MacCullum (1997, 201-212). Horst (1965, 129-134) also provides Fortran code for his method.
highest loadings (ignoring sign) exceeds twice the standard error” (Brown 1980, 223). Humphrey’s rule can be applied in a “less stringent” manner, such that the factor could be accepted if it just exceeds the standard error, rather than twice the standard error (Brown, 1980, 223). Both versions of Humphrey’s rule are used in this paper, with the standard version referred to as “Humphrey-strict”, and the less stringent version as “Humphrey-loose”. Tucker and MacCallum also suggest that examining the largest factor loading of the residual matrixes can provide useful information for factor retention. They argue that if the largest factor loading is less than 0.2, then the factor should not be accepted.
3. Results
3.1 The Lipset Data Set
With only nine participants, the Lipset data set is an example of the type of small study that can be found in Q methodology research. The data includes 33 statements related to perceptions of democratic values. The original correlations of the participant Q sorts were almost evenly split between positive and negative correlations, with the largest positive correlation between Q sorts having a value of 0.62, and the largest negative correlation being -0.56. The factors produced by the Brown, Horst, and Tucker-MacCallum extraction methods are shown in Table 1. The percent explained variance results suggest that the first two factors are relatively strong, together explaining 34 to 41 percent of the total variance. In addition, the strength of the factors extracted by the Brown and the Tucker-MacCallum methods is quite similar, especially for factors three to seven.
In factor analysis it is expected that the extraction methods will calculate each factor in such a way that it accounts for as much variance as possible. Therefore, the eigenvalues should decrease with each successive factor extracted. Unfortunately, in some cases centroid factor extraction methods have difficulty in accounting for the maximum amount of variance, and some of that variance is carried over to the next factor extracted. In this case the eigenvalue of the next factor will increase rather than decrease. Table 1 shows that only the Tucker-MacCallum method was able to extract seven factors with descending eigenvalues for the Lipset data set. The Brown extraction method showed some difficulty extracting factor six, and the Horst extraction method also had difficulties with factor five. In addition, the Horst method produced a Heywood case for the Q sorts of participants 3, 5, and 9. A Heywood case occurs when the total variance accounted for by a Q sort is greater than 100 percent (Heywood 1931; Horst 1965, 125). A Heywood case creates a dilemma for the researcher, who must decide whether to make ad hoc adjustments the factor loadings for the affected participants or to change the number of factors extracted.
Table 2 shows the differences between the factor loadings and the Pearson correlation coefficient for pairings of the extracted factors. The first two factors are quite similar for all three extraction methods. After the second factor, however, the Tucker-MacCallum method begins to produce factors that are different from the other methods. While the Brown and Horst methods
T ab le 1. Fa ct or Lo ad in gs ,E ig en va lu es ,a nd Pe rc en tE xp la in ed Va ria nc e — Li ps et D at a Se t T ab le 2. Fa ct or Lo ad in g D iff er en ce s an d Fa ct or C or re la tio ns — Li ps et D at a Se t
have relatively similar factors three and four, for factors five through seven they also diverge. For the last three factors, the extraction methods produce relatively unique factors.
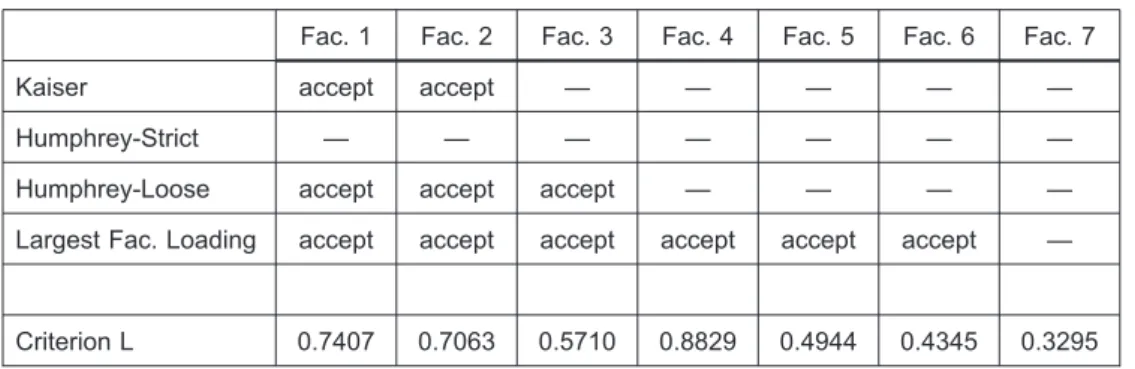
Table 3 provides the results for the criterion L statistic produced by the Tucker-MacCallum extraction method along with the results for the four other factor retention statistics. Tucker and MacCallum suggest that a large drop in the value for criterion L designates a breakpoint that should be used to determine the number of factors to accept (1997, 211). The Lipset results have relatively high criterion L values for the first two factors, but then a substantial drop for the third factor. If the subsequent rise in criterion L for factor four is ignored, this would suggest a two factor solution, which would match the results for the often-used Kaiser rule (retain factors with eigenvalues greater than one). The strict version of Humphrey’s rule rejects all of the factors, while the Humphrey-loose version suggests that three factors are acceptable. The largest factor loading rule is the most accepting of the statistics, suggesting that six factors could be retained for further analysis.
3.2 The Classroom Technology Data Set
The classroom technology data is a larger study than the Lipset data, with 27 participants sorting 50 statements related the use of iPads and other technology in the classroom. The strongest positive correlation between Q sorts was 0.76, while the strongest negative correlation was -0.34. Overall, 91% of the correlations between participant Q sorts was positive. Similar to the Lipset data, the centroid factors for the three extraction methods have two strong factors (Table 4), explaining approximately 45 percent of the total variance. The eigenvalue results are generally similar for the Horst and Tucker-MacCallum centroid factors, but there is an unexpected pattern for eigenvalues for the Brown factors three through seven. This unusual pattern suggests that there may be something else contributing to the calculation of the sub-optimal factors beyond the inability of the method to capture the maximum amount of variance.
The poorly-defined nature of the Brown centroid factors can also be seen in the factor loadings (Table 5). Although the first two factors are very similar for all three extraction methods,
Table 3. Comparison of Factor Retention Rules and Criterion L — Lipset Data Set
Fac. 1 Fac. 2 Fac. 3 Fac. 4 Fac. 5 Fac. 6 Fac. 7
Kaiser accept accept — — — — —
Humphrey-Strict — — — — — — —
Humphrey-Loose accept accept accept — — — —
Largest Fac. Loading accept accept accept accept accept accept —
T ab le 4. Fa ct or Lo ad in gs ,E ig en va lu es ,a nd Pe rc en tE xp la in ed Va ria nc e — C la ss ro om T ec hn ol og y D at a Se t
T ab le 5. Fa ct or Lo ad in g D iff er en ce s an d Fa ct or C or re la tio ns — C la ss ro om T ec hn ol og y D at a Se t
only the Tucker-MacCallum and the Horst methods continue to show similarity in the remaining factors. Factor six is the only exception for Tucker-MacCallum and Horst, perhaps influenced by unusually large differences in factor loadings for participants 6, 10, 21, and 26. The Brown factors three to seven differ considerably from those produced by the other two methods.
The results for the criterion L statistic show that its interpretation may be more difficult than suggested by Tucker and MacCallum (Table 6). Just as with the Lipset data, there is a lack of consensus amongst the factor retention statistics, with the Kaiser rule suggesting that four factors could be retained for the analysis, and the strict version of the Humphrey rule suggesting two factors. The largest factor loading rule is again quite different from the other statistics, viewing all seven of the factors as reliable. The criterion L statistic shows a substantial drop after the first factor and after the third factor. Given the similarity of the criterion’s values for factors four through seven, if the first drop in the criterion is ignored, it would suggest the acceptance of three factors. This would match with the loose version of the Humphrey rule (if the unusual result for factor six is also ignored).
3.3 The KOC Data Set
The KOC data consists of 36 statements sorted by 38 participants, which is close to the size of the classroom technology data set described above. The strongest positive correlation between the participants’ Q sorts was 0.74, while the strongest negative correlation was -0.43. Overall, 96 percent of the statement correlations were positive.
Factor one for the KOC data has a large percent explained variance value, generally about 38 percent for all three extraction methods. The eigenvalues do show the expected declining trend for the factors extracted by the Brown and Horst methods, but the Tucker-MacCallum method had difficulty extracting factor five, so its eigenvalue for factor six increases (Table 7).
Table 8 indicates that the three methods produced similar factor loadings for the first three factors (for the Horst and Tucker-MacCallum methods, the first four factors). For factor four, the Brown and Horst methods produce very different factors with little correlation, perhaps influenced Table 6. Comparison of Factor Retention Rules and Criterion L — Classroom Technology Data Set
Fac. 1 Fac. 2 Fac. 3 Fac. 4 Fac. 5 Fac. 6 Fac. 7
Kaiser accept accept accept accept — — —
Humphrey-Strict accept accept — — — — —
Humphrey-Loose accept accept accept — — accept —
Largest Fac. Loading accept accept accept accept accept accept accept
T ab le 7. Fa ct or Lo ad in gs ,E ig en va lu es ,a nd Pe rc en tE xp la in ed Va ria nc e — K O C D at a Se t
T ab le 8. Fa ct or Lo ad in g D iff er en ce s an d Fa ct or C or re la tio ns — K O C D at a Se t
by large differences in factor loadings for participants 22 and 29. For factor six the three methods produce mostly unique factors, but for factor seven the Brown and Tucker-MacCallum methods again have very similar factors.
One unusual aspect of the results for this data is the relatively high level of eigenvalues for all seven factors, so applying the Kaiser rule to these results suggests that they could all acceptable for analysis (Table 9). The largest factor loading rule also supports the acceptance of all seven factors. The Humphrey rules are less accepting, with the strict version suggesting the retention of two factors, and the loose version suggesting three factors. The results for criterion L are somewhat unclear. The statistic does have relatively large drop after the second factor, which could be interpreted as suggesting a two factor solution, but it also has another drop from factor three to factor four which might be considered sufficiently large enough to suggest a three factor solution.
3.4 The Simulated Data
The simulated data includes 34 Q sorts ranking 30 statements. The data set was chosen in part because it has a relatively large number of negative correlations between the Q sorts (45%), similar to the level seen in the Lipset data. The Pearson correlation coefficient for the largest positive correlation between the artificial Q sorts was 0.49, while the largest negative coefficient was -0.59. The factor loadings table for the three extraction methods (Table 10) shows that, unlike for the first three data sets, the first several factors do not large values for the total explained variance. In addition, it shows that the Brown and Tucker-MacCallum methods were not able to extract the maximum amount of variance when calculating factor four, so its eigenvalues for factor five increase.
Table 11 indicates that this data set replicates the pattern seen in the other data sets of a relatively high level of correlation between the three methods for the first several factors extracted – specifically the first three factors in this case. The Brown and Tucker-MacCallum methods are able to continue this level of similarity, although at a slightly lower level, until factor six. For factor seven, the three methods produce unique factors. Unlike the other data sets, however, there is no
Table 9. Comparison of Factor Retention Rules and criterion L — KOC Data Set
Fac. 1 Fac. 2 Fac. 3 Fac. 4 Fac. 5 Fac. 6 Fac. 7
Kaiser accept accept accept accept accept accept accept
Humphrey-Strict accept accept — — — — —
Humphrey-Loose accept accept accept — — — —
Largest Fac. Loading accept accept accept accept accept accept accept
T ab le 10 .F ac to rL oa di ng s, Ei ge nv al ue s, an d Pe rc en tE xp la in ed Va ria nc e — Si m ul at ed D at a Se t
T ab le 11 .F ac to rL oa di ng D iff er en ce s an d Fa ct or C or re la tio ns — Si m ul at ed D at a Se t
instance of a method producing a factor that is extremely different from the other two methods. The results for the comparison of retention rules vary considerably from the previous data sets, which may be related to the relatively large number of negative correlations between the participants’ Q sorts (Table 12). The Kaiser rule suggests retaining all seven factors, as does the largest factor loadings rule. The Humphrey-Loose statistic suggests retention of the first six factors, while the Humphrey-Strict statistic has odd results with all factors rejected except for factor three. Tucker and MacCallum’s criterion L statistic provides relatively similar, low values for all seven factors. It is unclear if this should be interpreted as suggesting that all of the factors can be accepted or that they should all be rejected.
4. Conclusions
Centroid factor extraction is an important component of Q methodology, but there is surprisingly little information on the usefulness and applicability of the different extraction methods available to researchers. The results of this research show that, in terms of being able to consistently produce well-defined centroid factors for all data sets, there is no clearly superior method. Therefore, the most appropriate extraction method will depend on the structure of the data and the theoretical concerns of the researcher. The Tucker-MacCallum method does seem to be a useful addition to the currently available options for centroid factor extraction. In some cases, such as with the Lipset data, it provided more well-defined factors than the Brown and Horst methods. The Tucker-MacCallum method can also provide a useful alternative to the Horst method for instances when it produces a Heywood case for one or more of the participant Q sorts. The ability of Tucker and MacCallum’s criterion L statistic to assist with decisions related to the reliability and acceptability of factors remains unclear, due in part to a lack of information on its proper interpretation. In one case it had multiple sharp decreases in its value across the extracted factors instead of a single decline, and in another case there was no decrease in its value for any of the factors. Determining how to best interpret the criterion L statistic for such cases will require more research.
Table 12. Comparison of Factor Retention Rules and Criterion L — Simulated Data
Fac. 1 Fac. 2 Fac. 3 Fac. 4 Fac. 5 Fac. 6 Fac. 7
Kaiser accept accept accept accept accept accept accept
Humphrey-Strict — — accept — — — —
Humphrey-Loose accept accept accept accept accept accept —
Largest Fac. Loading accept accept accept accept accept accept accept
REFERENCES
Banasick, Shawn. 2019. “KADE: A Desktop Application for Q Methodology.” Journal of Open Source
Software 4 (36): 1360.
Barchak, Leonard J. 1984. “Discovering Communication Paradigms with Q Methodology: Ferment or Sour Grapes?” Operant Subjectivity 7 (4): 115-30.
Brown, Steven R. 1980. Political Subjectivity: Applications of Q Methodology in Political Science. New Haven: Yale University Press.
Brown, Steven R. 1993. “A Primer on Q Methodology.” Operant Subjectivity 16 (3/4): 91-138.
Comrey, Andrew Laurence, and Howard Bing Lee. 1992. A First Course in Factor Analysis, 2nd Ed. Hillsdale, NJ: Lawrence Erlbaum Associates.
Fruchter, B. 1954. Introduction to Factor Analysis. Princeton, NJ: Van Nostrand.
Heywood, HB. 1931. “On Finite Sequences of Real Numbers.” Proceedings of the Royal Society of London. Series
A, Containing Papers of a Mathematical and Physical Character 134 (824): 486-501.
Horst, Paul. 1965. Factor Analysis of Data Matrices. New York: Holt, Rinehart, and Winston.
Kaiser, Henry F. 1960. “The Application of Electronic Computers to Factor Analysis.” Educational and
Psychological Measurement 20 (1): 141-151.
Lipset, Seymour Martin. 1963. “The Value Patterns of Democracy: A Case Study in Comparative Analysis.”
American Sociological Review 28 (4): 515-531.
Ramlo, Susan. 2016. “Centroid and Theoretical Rotation: Justification for Their Use in Q Methodology Research.” Mid-Western Educational Researcher 28(1): 73-92.
Schmolck, Peter. n. d. “Q Study Archive.” QMethod. Accessed September 25, 2020. http: //schmolck. org/qmethod/qsa.htm.
Schmolck, Peter, and John Atkinson. 2014. “PQMethod (Version 2.35).” [Computer Software]. Retrieved from http://schmolck.org/qmethod/downpqwin.htm.
Stephenson, William. 1953. The Study of Behavior; Q-Technique and Its Methodology. The Study of Behavior; Q-Technique and Its Methodology. Chicago, IL: University of Chicago Press.
Tucker, Ledyard R., and Robert C. MacCallum. 1997. Exploratory Factor Analysis. Unpublished Manuscript, Ohio State University, Columbus.
Zabala, Aiora. 2014. “qmethod: A Package to Explore Human Perspectives Using Q Methodology.” The R
Journal 6(2), 163-173.