JAIST Repository
https://dspace.jaist.ac.jp/
Title
Role of base in the formation of silver
nanoparticles synthesized using sodium acrylate
as a dual reducing and encapsulating agent
Author(s)
Nishimura, Shun; Mott, Derrick; Takagaki,
Atsushi; Maenosono, Shinya; Ebitani, Kohki
Citation
Physical Chemistry Chemical Physics, 13(20):
9335-9343
Issue Date
2011-04-08
Type
Journal Article
Text version
author
URL
http://hdl.handle.net/10119/10734
Rights
Copyright (C) 2011 Royal Society of Chemistry.
Shun Nishimura, Derrick Mott, Atsushi Takagaki,
Shinya Maenosono and Kohki Ebitani, Physical
Chemistry Chemical Physics, 13(20), 2011,
93359343. http://dx.doi.org/10.1039/C0CP02985H
-Reproduced by permission of The Royal Society of
Chemistry
CREATED USING THE RSC ARTICLE TEMPLATE (VER. 3.1) - SEE WWW.RSC.ORG/ELECTRONICFILES FOR DETAILS
ARTICLE TYPE
www.rsc.org/xxxxxx
| XXXXXXXX
Role of Base in the Formation of Silver Nanoparticles Synthesized Using
Sodium Acrylate as Dual Reducing and Encapsulating Agents
Shun Nishimura,
aDerrick Mott,
aAtsushi Takagaki,
bShinya Maenosono,*
aand Kohki Ebitanil*
aReceived (in XXX, XXX) Xth XXXXXXXXX 200X, Accepted Xth XXXXXXXXX 200X First published on the web Xth XXXXXXXXX 200X
5
DOI: 10.1039/b000000x
The formation mechanism of Ag nanoparticles (NPs) synthesized with a wet-chemical reduction method using sodium acrylate as dual reducing and capping agents was investigated with various analytical techniques. The time course of state of the reaction solution was investigated using UV-vis and XAFS spectroscopies which showed that the NP formation rate increased with increasing 10
concentration of sodium hydroxide (NaOH). The detailed kinetic analyses reveal that both the reduction rate of Ag ions and the nucleation rate of Ag NPs are dramatically increased with increasing the NaOH concentration. XANES analyses imply that another reaction pathway via alternative Ag+ species, such as Ag(OH)
x, was developed in the presence of NaOH. Consequently,
NaOH is found to play an important role not only in creating specific intermediates in the 15
reduction of Ag+ to Ag0, but also accelerating the reduction and nucleation rates by enhancing the
oxidation of sodium acrylate, thereby increasing the rate of formation of the Ag NPs.
Introduction
A wet chemical reduction method has been widely employed for the preparation of highly dispersed nanoparticles (NPs), 20
because it is relatively simple and has wide applicability in synthesis of various types of NPs. The synthetic procedure involves the reduction reaction of one or more metal precursors in the presence of capping ligands using a reducing agent such as hydrogen, formaldehyde, sodium borohydride, 25
hydrazine or γ-irradiation. Some organic materials such as poly(allylamine) (PAAm), poly(N-vinyl-2-pyrrolidone) (PVP), poly(vinyl alcohol) (PVA), poly(sodium acrylate) (PSA), poly(ethylene glycol) (PEG), citric acid, ascorbic acid, and glucose have been employed as dual active agents,1 serving as
30
both reducing and capping agent in the method.
Many researchers have focused on the control of NP size and shape, because these have a strong relationship with the properties, for example as catalyst, magnetic devices, biosensors, and so on. There are several successful reports on 35
the synthesis of NPs which show the effect of solvent polarity,2 shape directing agents,3 or mixing ratio of metal
precursor to stabilizer,4 on the metal NP formation. Although
the relationships between the synthesized metal NPs morphology and preparation conditions have been gradually 40
clarified, it is still difficult to design a novel synthetic methodology in a rational manner to obtain highly uniform and size/shape controllable metal NPs. This is mostly because the NP formation process is generally governed by an instantaneous nucleation process followed by crystal growth. 45
The nucleation and growth rates nonlinearly depend on the supersaturation of atoms, and have a profound effect on the mean size, size distribution and morphology of the resulting NPs. This means that the control of supersaturation of atoms is crucially important to obtain highly monodisperse and 50
shaped NPs. The supersaturation of atoms is closely related to
the reduction rate of ions, complexation ability of capping ligands with metal, and solubility and stability of intermediates. It remains a mystery how intermediates are formed during the reaction and how they affect the reaction 55
kinetics.
The X-ray adsorption fine structure (XAFS) method is a valuable technique for providing information of the dynamic aspect of the particle formation. Regarding the formation mechanism of highly monodisperse NPs, Polte and coworkers 60
investigated the Au NP formation process by XAFS and small-angle X-ray scattering (SAXS) methods using synchrotron radiation, and they found that the Au NPs were formed over a four step mechanism as follows: fast initial nucleation, coalescence of the nuclei into bigger particles, 65
slow further growth, and fast final growth.5 Harada et al.
studied the formation mechanisms of Rh, Pd, Ag, Au, and Pt NPs synthesized by photoreducing metal ions in an aqueous ethanol solution and they found that the type of formed seed and/or intermediates during reduction were strongly related to 70
the formation kinetics of NPs.6 Very recently, we investigated
the formation mechanism of Cu NPs using the in situ XAFS method with other supporting techniques, and proposed that the role of PVP in the Cu NP formation is primarily as a stabilizer, not only for the formed NPs but also for 75
intermediates such as Cu+ ions and Cu hydroxides, which
prolongs the lifetime of Cu+ ion and reduces the
supersaturation of Cu0 species, during the course of the
reaction.7
Ag NPs are one of the most attractive materials for electric 80
devices, catalysts, antibacterial agents, fluorescent labels and bio/chemical sensing applications. Recently, we developed a synthetic methodology towards fine Ag NPs with narrow size distribution using sodium acrylate as dual reducing and encapsulating agent (See Electronic Supplementary 85
Information (ESI)†, Fig. S1).8 In our own synthesis approach
impact on the reaction kinetics of particle formation, and is thought to be the key factor in regulating the monodispersity of the resulting Ag NPs. However, until now, the formation mechanism has not been well understood. Although some people have studied the formation process of Ag NPs 5
synthesized in different ways using UV-vis spectroscopy,9
there have been no detailed reports on the effect of alkaline agent on the reaction kinetics. Therefore, in this paper, we present a study on the role of NaOH in the formation of Ag NPs using the in situ XAFS method in combination with other 10
observation techniques.
Experimental Section
The Ag NPs were synthesized with a wet-chemical reduction method reported by Mott et al.8 with some modifications.
Silver nitrate (AgNO3) and sodium acrylate (SA) were used as
15
a precursor and dual reducing/capping agent, respectively. First, a 0.83 mM solution of AgNO3 was prepared, then
sodium hydroxide (NaOH) was gradually dropped into the solution with stirring at room temperature. Second, 5 mL of 50 mM SA was added to the above solution. The prepared 20
solution consisted of AgNO3/NaOH/SA with molar ratios of
1/x/6.7 in 50 mL water, where x was varied in the range of 0-3.6. The solution was refluxed in a two-neck round-bottom glass flask at 373 K under an Ar atmosphere. The solution was sampled several times during the reaction using a clean glass 25
pipette at various times after the start of refluxing at 373 K. The sampled liquid was rapidly-quenched and immediately used for ex situ characterizations.
X-ray diffraction (XRD) patterns of solid materials were obtained in reflection geometry using an X-ray diffractometer 30
(Rigaku, RINT2000) at room temperature with Cu Kα radiation (wavelength, 1.542 Å; step width, 0.02°). The sample was prepared by centrifuging the solution followed by drying in vacuo.
The mean size, size distribution and morphology of NPs 35
were examined using a Hitachi H-7100 transmission electron microscope (TEM) operated at 100 kV. TEM samples were prepared by dropping the reaction solutions onto carbon-coated copper microgrids followed by drying in vacuo.
UV-vis spectra were recorded with a Perkin-Elmer 40
Lambda35 spectrometer at room temperature. After the sampling, the solution was diluted to eight times with highly purified water for measurement.
XAFS was obtained at BL01B1 in SPring-8 (proposal No. 2010A1598). The Ag-K edge (Kα; 22.16 keV) XAFS spectra 45
were measured with a fluorescence method using a multi-element solid state detector (SSD). The synchrotron radiation beam was monochromated using Si(311) single crystal. The obtained spectra were treated with count loss correction before analyzing. The k3-weighted extended XAFS (EXAFS)
50
functions [k3χ(k)] were obtained from normalized EXAFS
spectra, and Fourier-transformations (FT) were performed within the range Δk = 3–11 Å−1.
Results and Discussion
Visual inspection of the reaction solutions
55
The colorless AgNO3 aqueous solution gradually became a
yellow cloudy solution during addition of NaOH at room temperature. After that, the injection of SA aqueous solution caused no change in the color. Next, during temperature ramping from room temperature to reflux, the prepared 60
yellowish solution transformed to a paler yellow shade. The color changes of the solutions over time during the reaction after the start of refluxing at 373 K shows the differences in the case of using x = 0, 1.1, or 3.6 (Fig. 1). The color of the solutions gradually became deep yellow color via a dark blue 65
color (through transmitted light) despite the amount of NaOH added. Hyning and coworkers also reported that a dark yellow solution was obtained before a lighter yellow solution in the formation process of Ag NPs reduced by borohydride, and they suggested that the dark yellow solution occurred due to 70
the composition and prismatic qualities of reduced silver.10
Yin et al. also reported a similar color transition in their work.11 According to these reports, our dark blue (transmitted
light) solutions also indicated the existence of small reduced Ag NPs in the formation process. Comparing the color of the 75
solution after 30 min refluxing, the solution synthesized with a high amount of NaOH took on a more deep yellow color than others. It seems that the reduction pathways were not drastically changed, although the rate of reduction is highly affected by the amount of NaOH added in the synthesis. 80
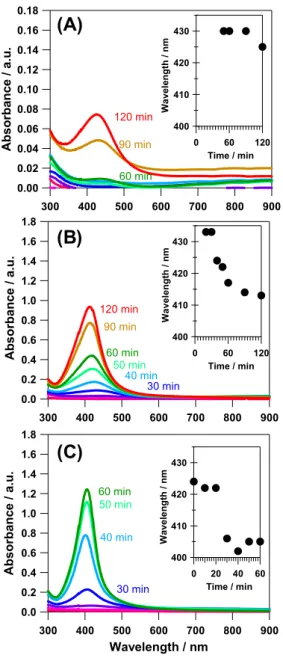
Time evolution of absorption spectra of reaction solutions
Figure 2 shows the UV-vis spectra of the solutions after sampling in the cases of x = 0, 1.1, and 3.6. The absorbance peak around 405 nm corresponds to the surface plasmon resonance (SPR) band derived from Ag NPs which possess a 85
small spherical structure (ca. 3–10 nm).12 In the case of Ag NPs, the intensity of the SPR band is directly related to the amount and size of synthesized Ag NPs, and the SPR peak wavelength is related to the electron density which is associated with different types of adsorbates13,14 or particle
90
size and shape.15 Moreover, initial oxidation of surface silver
atoms also causes a red shift of the SPR peak because of removal of electron density from the particle surface.11,14
From TEM and XAFS analyses (vide infra), the synthesized Ag NPs after 60 min refluxing were largely composed of 95
(A)
(B)
(C)
0 min 10 min 20 min 30 min 60 min 90 min 120 min
0 min 10 min 20 min 30 min 60 min 90 min 120 min
0 min 10 min 20 min 30 min 40 min 50 min 60 min
Fig. 1 Time evolution of the color of the reaction solution in the cases of x = (A) 0, (B) 1.1, and (C) 3.6.
1.8 1.6 1.4 1.2 1.0 0.8 0.6 0.4 0.2 0.0 Abs o rb ance / a. u. 900 800 700 600 500 400 300 Wavelength / nm 60 min 50 min 40 min 30 min 1.8 1.6 1.4 1.2 1.0 0.8 0.6 0.4 0.2 0.0 A b s o rbance / a. u. 900 800 700 600 500 400 300 120 min 90 min 60 min 50 min 40 min 30 min 0.18 0.16 0.14 0.12 0.10 0.08 0.06 0.04 0.02 0.00 Abs o rb ance / a. u. 900 800 700 600 500 400 300 120 min 90 min 60 min
(A)
(B)
(C)
430 420 410 400 W a v el ength / nm 120 60 0 Time / min 430 420 410 400 W a v el ength / nm 120 60 0 Time / min 430 420 410 400 W av e le ng th / nm 60 40 20 0 Time / minFig. 2 Time evolution of UV-vis spectra of the reaction solution in the
cases of x = (A) 0, (B) 1.1, and (C) 3.6. The insets emphasize the shift of SPR peak wavelength as a function of refluxing time.
5
spherical Ag metal NPs with narrow size distribution (ca. 2–6 nm). Therefore, a blue shift in the SPR peak from 420–430 nm to 405–410 nm observed at an early stage of reaction in the cases of x = 1.1 and 3.6 (Insets of Figs. 2B and 2C) indicates that the surface of small Ag seeds (such as clusters) 10
is initially oxidized, and then, the conversion of surface oxide layer to Ag metal gradually occurred during refluxing. There is no red shift of the SPR peak wavelength during refluxing while the SPR peak intensity increases with extending the time of refluxing. Thus, the aggregation and further oxidation 15
of synthesized Ag NPs could be ruled out during refluxing in water while the amount of Ag NPs increased in the solution.
In the case of x = 0, the same tendency is also observed, however the SPR peak intensity is quite small as shown in Fig. 2A. It is evident that the reaction rate is clearly different from 20 2.0 1.5 1.0 0.5 0.0 ISPR / a . u. 140 120 100 80 60 40 20 0
Refluxing time / min
Fig. 3 Time evolution of SPR intensity in the cases of x = 0 (×-mark), 0.4
(diamond), 1.1 (triangle), 1.8 (square), and 3.6 (circle). Solid lines represent the calculation results (vide infra).
25
the case of x ≠ 0. The SPR peak intensity after 60 min refluxing in the case of x = 3.6 is much higher than those of x = 1.1 and 0. The positive correlation between x and the SPR peak intensity is clearly observed in all conditions (ESI, Fig. S2). It seems that NaOH has a large impact on the reaction 30
kinetics of Ag NP formation, and causes an acceleration of the Ag NP formation when using dual active SA in water.
To evaluate the reaction kinetics during the Ag NPs formation using various amounts of NaOH, the changes in the intensity of the SPR band at 405 nm (ISPR) was plotted as a
35
function of refluxing time (Fig. 3). In the case of x = 3.6, ISPR
gradually increases from 0–20 min refluxing, and exponentially rose after 20 min refluxing. Therefore, there is an induction period in the initial stage of the reaction within 20 min time. In the cases of x = 1.8 and 1.1, a similar behavior 40
is observed, i.e., an induction period within 20 min followed by exponential increase. However, the rate of exponential increase (after 20 min) slightly descended with decreasing x. When x < 1.1, no exponential increase is observed, and thus, the induction period is indefinable. Even in the case of x = 0, 45
however, a weak SPR band was seen after 60 min refluxing as shown in Fig. 2A, indicating that even in the absence of NaOH Ag NPs were formed, although only in small amount. In a separate study, a similar result was reported with respect to the Ag NPs formation,9 and it was proposed that small
50
seeds of Ag0 were formed during the first reaction step. These
results indicate that Ag NPs gradually formed by refluxing the solution despite the amount of NaOH added, though the formation rate of Ag NPs strongly depends on the NaOH concentration. This suggests that NaOH accelerates the 55
reduction reaction of Ag+ ions and/or the nucleation of Ag
NPs.
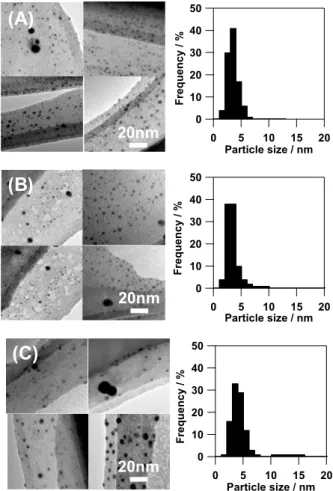
Structural characterization of products
Figure 4 shows the TEM images of the samples after refluxing for 60 min in the cases of x = 0, 1.1 and 3.6. Many small NPs 60
(ca. 2–6 nm) and a few large NPs (ca. 12 nm) can be seen in all images. The particle size distributions of all samples are almost the same and the mean diameter is ca. 3.5 nm. In the
case of x = 3.6, however, a small amount of large particles (ca. 12 nm) are formed as shown in Fig. 4C. Wang et al. studied the synthesis of PVP-capped Ag NPs using glucose and NaOH, and they observed that the NaOH had an adverse effect on particle agglomeration.16 The large NPs observed in Fig. 4C
5
might be produced by enhanced crystal growth and/or agglomeration of primary NPs. Though some large NPs were observed in all cases, no red shift in the SPR peak wavelength was detected during formation process (see the inset of Fig. 2). These results indicated that the number density of large NPs is 10
negligible.
One question is why do the size distributions after 60 min refluxing show a similar tendency regardless of x, which has a major impact on the formation rate as discussed before. To provide an answer to the question, the coordination numbers 15
(CN) of the samples after 60 min refluxing were estimated with the EXAFS analyses (shown in a later section). The CN is related to the mean diameter of NPs.17 For example, CN =
10 corresponds to a metal NP of approximately 35 Å diameter based on the cuboctahedron model. The CNs of samples 20
synthesized with x = 0, 1.1 and 3.6 were CN = 0.7, 6.3 and 9.9, respectively. This result indicates the mean diameters of Ag NPs were below 35 Å in all cases. The diameter estimated from EXAFS analyses are averaged over all Ag atoms in the 25 50 40 30 20 10 0 F req uen cy / % 20 15 10 5 0 Particle size / nm 50 40 30 20 10 0 F req u e ncy / % 20 15 10 5 0 Particle size / nm 50 40 30 20 10 0 Fr eq ue nc y / % 20 15 10 5 0 Particle size / nm
(A)
(B)
(C)
20nm
20nm
20nm
Fig. 4 TEM images of the samples after refluxing for 60 min in the cases
of x = (A) 0, (B) 1.1, and (C) 3.6. The lower graphs correspond to the size distributions of NPs calculated from 800 randomly selected NPs from the TEM images.
30
solution. Thereby, these results imply that there are many ultra-small Ag clusters and/or Ag complexes, which conduce to small CNs, in all cases when comparing the mean sizes of Ag NPs estimated from TEM images.
The intensity of the SPR band for x = 3.6 after 60 min 35
refluxing was 146 times higher than that of x = 0 (Fig. S2). Considering these results, the existence of small Ag0 seeds
(clusters and/or complexes), which could not be easily observed with TEM, were created in all conditions. Furthermore, in the case of x = 0, the fraction of Ag0 seeds 40
seems to be much higher than those of x = 1.1 and 3.6.
Kinetic rate consideration of Ag NP formation process
To consider the effect of NaOH, the rate of Ag NPs formation is analyzed based on a reaction kinetics study. For simplicity, in the reaction we assumed only reduction of Ag+ ions and
45
nucleation of Ag0 neglecting the crystal growth. In our
particular syntheses, the mean size of Ag NPs is unaffected by NaOH concentration (see Fig. 4), suggesting that the formation of NPs is dominated only by the nucleation process. Hence, the formation process of Ag NPs can be written by the 50
following two-step reactions, 0 + Ag Ag k1
→
(1) n 0 Ag Ag k2→
n (2)where k1 and k2 are overall reduction and nucleation rates,
respectively. The rate equations can be expressed as 55 n nk k dt d ] Ag [ ] Ag [ = ] Ag [ 0 2 + 1 0 - (3) n k dt d ] Ag [ = ] Ag [ 0 2 n (4) According to the results of XAFS analyses and TEM
observations, there seems to be two main states of Ag intermediates, i.e., Ag+ complexes (molecular state) and/or
60
Ag0 seeds (solid state) (vide infra). In general, the SPR
intensity of metallic NPs is proportional to the cube of the NP diameter. Therefore, the contributions of Ag+ complexes and
ultra-small Ag clusters to the SPR intensity is negligible. The SPR intensity can be assumed to be proportional to the 65
number of Ag NPs (ISPR∝ [Agn]), because the crystal growth
has been neglected. In Fig. 3, the best fit curves obtained using Eqs. (3) and (4) are plotted as solid lines. As a result of the fitting, we observed that k1 and k2 increase with increasing
the NaOH concentration, while n decreases with increasing 70
the NaOH concentration (Fig. S3). This result clearly indicates that both the reduction reaction of Ag+ and the
nucleation of Ag NPs are simultaneously accelerated by NaOH. The chemical picture of the enhancement effect of the reaction rates will be discussed later.
75
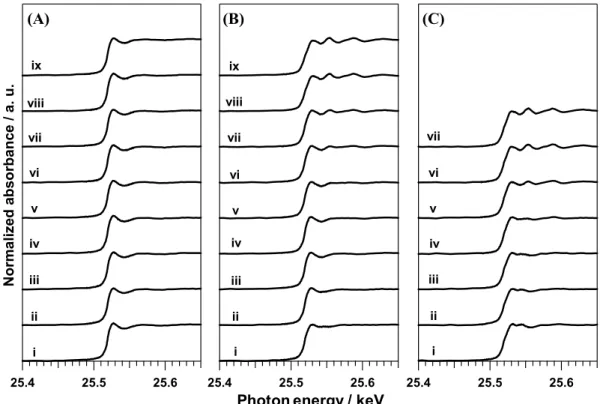
Evaluation of XAFS spectra during Ag NP formation
reaction, the solutions collected by sampling were analyzed with the XAFS technique. Fig. 5 shows the X-ray absorption near-edge structure (XANES) spectra as a function of refluxing time, t, in the cases of x = 0, 1.1 and 3.6. The XANES spectra of reference materials such as Ag foil, Ag2O
5
powder, and AgNO3 (aq.) are shown in Fig. S4. The XANES
spectrum at t = 0 in the case of x = 0 is almost identical to that of AgNO3 [Fig. 5A(i)]. On the other hand, the XANES
spectrum at t = 0 in the case of x = 3.6 exhibits a two-humped peak that is characteristic of Ag2O [Fig. 5C(i)]. According to
10
the previous research, Ag+ ions were unstable in alkaline
conditions (pH > 10.5) and were converted to insoluble Ag2O
particles.18 In our reaction conditions, the pH of the solution
before refluxing is over 10.4 when x ≥ 1.1 (Fig. S5). Furthermore, the yellow color, XRD patterns and XAFS 15
spectra of the samples before heating indicate the presence of Ag2O phase (Figs. S6 and S7). Therefore, we can conclude
that Ag2O species were formed in the presence of NaOH,
which serves as an alternative precursor accelerating the reduction reaction of Ag+ to Ag0.
20
Taking a look at the time variations of XANES spectra, there were few qualitative differences in the case of x = 0 (Fig. 5A). In the cases of x ≠ 0, the XANES spectra gradually changed from a dampened structure to an undulated structure with increasing reflux time (Figs. 5B and 5C). This behavior 25
indicates that the reduction from AgNO3 or Ag2O to Ag metal
is promoted by addition of NaOH, and the reduction rate depends on x.
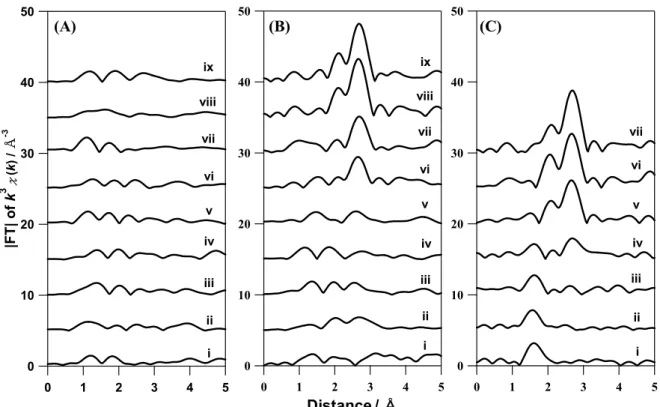
To deeply elucidate the formation mechanism of Ag NPs, the time courses of |FT| of k3χ(k) is plotted in Fig. 6. It is
30
known that Ag2O has a peak at 1.6 Å (Ag-O), while Ag metal
exhibits a peak at 2.7 Å (Ag-Ag) (Fig. S4B). At t = 0, only the case of x = 3.6 shows a significant |FT| peak at 1.6 Å corresponding to the Ag2O particles [Fig. 6C(i)], in which
both cases of x = 0 and 1.1 do not show a Ag-O peak at t = 0 35
[Figs. 6A(i) and 6B(i)]. Note that both cases of x = 1.1 and 3.6 before starting reflux indicated the Ag-O peaks as shown in Fig. S7. Hence, the formed Ag2O NPs before heating might
change into small Ag NPs or redissolve during the ramping of temperature in the case of x = 1.1. As shown in Fig. 6A, the 40
case of x = 0 exhibits no significant peak during refluxing. On the other hand, the cases of x = 1.1 and 3.6 exhibit some characteristic peaks as shown in Figs. 6B and 6C. In the case of x = 1.1, the Ag-Ag peak gradually increased after 40 min refluxing [Fig. 6B(v)-(ix)]. In the case of x = 3.6, the Ag-Ag 45
peak intensity increased with decrease in the Ag-O peak intensity as shown in Fig. 6C. This suggests that excess Ag2O
particles remained in the solution at t = 0 due to the presence of much NaOH, and they were gradually transformed to Ag metal NPs during refluxing. According to these results, one of 50
the roles of NaOH in the reaction is the production of insoluble Ag2O, which creates another reaction pathway for
formation of the Ag NPs with a much faster rate.
The transformation of the |FT| peak height at 2.7 Å, which corresponds to the total number of Ag-Ag bonds in the system, 55
were plotted as a function of refluxing time (Fig. 7). The peak height increases for extended refluxing, and the rate of increase positively correlates to x. These tendencies correspond to the results from UV-vis spectra (Fig. 3). These results strongly suggest that the reaction pathway is not only 60
straightforward (i.e. directly via AgNO3 to Ag NP) but also
Normalized a b so rbanc e / a. u. 25.6 25.5 25.4 x10³ i ii iii iv v vi vii viii ix 25.6 25.5 25.4 x10³ i ii iii iv v vi vii viii ix 25.6 25.5 25.4 x10³ i ii iii iv v vi vii
Photon energy / keV
(A)
(B)
(C)
Fig. 5 Time course of XANES spectra taken at (i) 0 , (ii) 10, (iii) 20, (iv) 30, (v) 40, (vi) 50, (vii) 60, (viii) 90, and (ix) 120 min after starting reflux in the
50 40 30 20 10 0 5 4 3 2 1 0 i ii iii iv v vi vii viii ix 50 40 30 20 10 0 |FT| o f k 3 χ (k ) / Å -3 5 4 3 2 1 0 i ii iii iv v vi vii viii ix 50 40 30 20 10 0 5 4 3 2 1 0 i ii iii iv v vi vii
(A)
(B)
(C)
Distance / Å
Fig. 6 Time course of |FT| taken at (i) 0, (ii) 10, (iii) 20, (iv) 30, (v) 40, (vi) 50, (vii) 60, (viii) 90, and (ix) 120 min after starting reflux in the cases of x =
(A) 0, (B) 1.1, and (C) 3.6.
occurs via the Ag2O intermediate (at least in the case of x =
5
3.6), which was created with NaOH. Evanoff et al. synthesized Ag NPs with hydrogen reduction of Ag2O, and
reported that Ag2O as a precursor was more easily reduced
than AgNO3.19 Guang-nian et al. proposed that the difference
in reducing rate between Ag2O and AgNO3 was due to the
10
presence of NO3-.20 However, neither of these studies
mentions the complex intermediate formation observed in our own synthetic approach.
12 10 8 6 4 2 0 P eak he ig ht at 2. 7 Å 120 100 80 60 40 20 0
Refluxing time / min 15
Fig. 7 Time evolution of the height of |FT| at 2.7 Å in the cases of x = 0
(×-mark), 0.4 (diamond), 1.1 (triangle), 1.8 (square), and 3.6 (circle).
XANES study over the Ag NP formation
To clarify the intermediate state, the observed XANES spectra 20
were deconvoluted using the reference spectra. Using Ockham’s razor as an initial concept, we deconvoluted the observed XANES spectra with AgNO3 (aq.) and Ag foil
spectra. If the least square error is always less than a threshold value for the cases of t = 0, 30 and 60 min, we did not add 25
another reference spectrum for the deconvolution. The least square error, R, is given as
∑ ∑ 2 obs 2 ) ∑ obs ( = X i X i φ X R - (5)
where Xobs, Xi and ϕi are observed XANES spectrum, XANES
spectrum of the i-th reference and contribution ratio of the i-th 30
reference, respectively. Note that i = 1 and 2 represent AgNO3
(aq.) and Ag foil spectra, respectively. The threshold value,
Rth, is defined as 0.025. If R > Rth, we added the Ag2O
spectrum as a third reference spectrum (i = 3) for the deconvolution.
35
Figure 8 shows the results of the deconvolution of XANES spectra. In the cases of x = 0 and 0.4, the observed spectra could be well reproduced using two reference spectra (AgNO3
(aq.) and Ag foil) (R = 0.015–0.022). In the cases of x ≥ 1.1, AgNO3 (aq.) and Ag foil reference spectra were not enough to
40
reproduce the observed spectra (i.e. R > Rth) especially at an
25.56 25.54 25.52 25.50 25.48
Photon energy / keV x103 R=0.052 R=0.021 R=0.037 R=0.021 R=0.022 R=0.022 i ii iii 25.56 25.54 25.52 25.50 25.48
Photon energy / keV x103 R=0.042 R=0.016 R=0.028 R=0.015 R=0.021 R=0.020 i ii iii 25.56 25.54 25.52 25.50 25.48
Photon energy / keV x103 R=0.022 R=0.018 R=0.015 i ii iii 25.56 25.54 25.52 25.50 25.48
Photon energy / keV x103 R=0.029 R=0.011 R=0.014 R=0.019 R=0.018 R=0.016 i ii iii 25.56 25.54 25.52 25.50 25.48
Photon energy / keV x103 i ii R=0.016 R=0.015 R=0.015 iii (A) (B) (C) (D) (E) No rm al iz ed ab so rp ti o n / a. u .
Photon energy / keV
Fig. 8 The observed and reconstructed XANES spectra at t = (i) 0, (ii) 30, and (iii) 60 min in the cases of x = (A) 0, (B) 0.4, (C) 1.1, (D) 1.8 and (E) 3.6.
Black circles represent the observed XANES spectra. Red curves correspond to the sum spectra of AgNO3 (aq.) and Ag foil (ϕ1X1+ϕ2X2). Yellow curves correspond to the sum spectra of AgNO3 (aq.), Ag foil and Ag2O (ϕ1X1+ϕ2X2+ϕ3X3)
100 90 80 70 60 50 40 30 20 10 0 60 50 40 30 20 10 0 100 90 80 70 60 50 40 30 20 10 0 60 50 40 30 20 10 0 100 90 80 70 60 50 40 30 20 10 0 60 50 40 30 20 10 0 100 90 80 70 60 50 40 30 20 10 0 60 50 40 30 20 10 0 100 90 80 70 60 50 40 30 20 10 0 60 50 40 30 20 10 0 (A) (B) (C) (D) (E)
Refiuxing time / min
Fr ac ti on of A g s p ec ie s / % 5
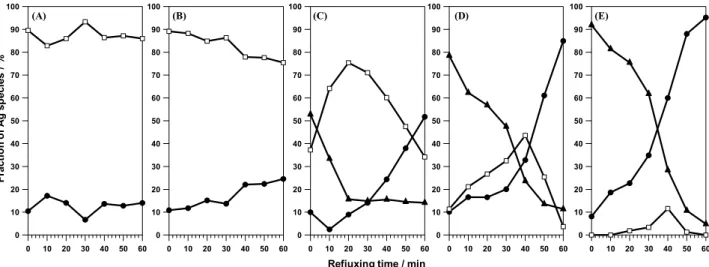
Fig. 9 Time evolution of the fraction of each Ag species (ϕi) in the cases of x = (A) 0, (B) 0.4, (C) 1.1, (D) 1.8, and (E) 3.6. Open squares, filled circles
and filled triangles correspond to ϕ1 [Ag+ (AgNO3 origin)], ϕ2 (Ag metal) and ϕ3 [Ag+ (Ag2O origin)], respectively. Ag2O reference spectrum was taken into account. This
assumption is reasonable because the XRD and EXAFS 10
results clearly showed the existence of Ag2O due to addition
of a large amount of NaOH as noted before. As a result, the observed spectra could be well reproduced using three reference spectra (AgNO3 (aq.), Ag foil and Ag2O) in the
cases of x ≥ 1.1 (R = 0.011–0.022). 15
Figure 9 shows the time evolution of ϕi during refluxing. In the case of x = 0, the transformation from Ag+ to Ag metal
rarely happened as seen in Fig. 9A, indicating that the reduction reaction from AgNO3 to Ag0 NPs is a very slow
process. In the case of x = 0.4, the reduction gradually 20
proceeds to form trace amounts of Ag metal (Fig. 9B). In contrast, in the cases x = 1.1 and 1.8, the fraction of Ag2O
species (ϕ3) is the highest at t = 0, and the fraction of Ag+
(AgNO3) (ϕ1) increase with decrease in ϕ3 at 0 < t < 20 min
for x = 1.1 and at 0 < t < 40 min for x = 1.8. This implies the 25
transformation of solid Ag2O to Ag+, which has similar
electronic structure to AgNO3, takes place at the initial stage
of refluxing (Figs. 9C and 9D). After the initial increase, ϕ1
starts to decrease. At the same time, ϕ2 (Ag metal) starts to
drastically increase. The transformation from Ag2O to Ag+
30
and the reduction from Ag2O to Ag metal seem to be
competitive. In the case of x = 3.6, ϕ3 is more than 90% at t =
0 and ϕ1 maintains a low value throughout the reaction (Fig.
9E). This result seems to suggest that the reduction from
Ag2O to Ag metal are dominant compared to the
35
transformation from Ag2O to Ag+. Importantly, the reduction
rate notably increases with increase in x. The question arises here, why does the reduction rate of Ag+ to Ag0 increase with
increasing x if Ag+ species created by redissolution of Ag 2O
are the same as AgNO3? According to the aforementioned
results, we speculate that an alternative Ag+ intermediate,
which is of a different type from AgNO3 species, would be
created in the reaction system when the NaOH concentration is high enough, because the rate of reduction reaction via AgNO3 to Ag NPs seems to be much slower than that of via
5
Ag2O as discussed in detail later.
Proposed mechanism for the Ag NP formation
Here we summarize the following three important experimental facts: (1) insoluble Ag2O particles are formed in
the presence of NaOH at room temperature and the 10
concentration of Ag2O increases with increasing the NaOH
concentration (x), (2) Ag2O particles redissolve during the
heating (ramping of temperature and refluxing) creating Ag+
species, which has similar electronic structure to AgNO3, and
(3) both the reduction reaction of Ag+ and the nucleation of
15
Ag NPs are simultaneously accelerated by increasing x. In general, the state of complex and its reduction potential are varied depending on pH value.21 For example, Au(III) or
Pt(IV) complexes have different ligand-mediated structures depending on pH, and the reaction rates of the complexes to 20
form NPs strongly depend on the molecular structures.22
Wang et al. reported that a Ag(OH) intermediate existed in the solution in the presence of NaOH.23 The formation of
Ag(OH)x through hydrolysis of Ag2O was also proposed in the
previous reports.19,24 Considering the previous studies, Ag+
25
species created by redissolution of Ag2O in our own
experiments is in the form of Ag(OH)x such as Ag(OH) and Ag(OH)2−. Scheme 1 illustrates the proposed reaction
pathways for the Ag NPs formation using SA as dual reducing and capping agents. According to a wide range of 30
experimental results, we conclude that the following two reaction pathways exist in the system depending on x: (1) direct reduction of Ag+ (AgNO
3 origin) to Ag0 followed by
nucleation to form Ag NPs and (2) reduction of Ag(OH)x, which is formed from Ag2O under alkaline conditions, to Ag0
35
followed by nucleation to form Ag NPs.
By the way, primary and secondary alcohol and aldehyde groups have been extensively used as a reducing agent in conjunction with base.25 These functional groups are widely
known as sacrificial oxidation agents by inducing the 40
abstraction of H+ under alkaline condition.26 Based on this
fact, the reducing ability of SA is likely to be affected by NaOH. Carboxylic acid and salt, and amine groups also have been applied as a reducing agent.27 Hoppe et al. suggested that
the PVP degradation to the H+ and oxidation products after
45
heating was observed.28 The same phenomena were also
suggested using ethylene glycol,29 block-copolymer,30
ascorbic acid,31 vinyl group,32 and N, N-dimethylformamide
(DMF)33 in the presence of alkaline additive. Therefore, these
compounds act as a reducing agent in compensation for the 50
oxidation of themselves. According to these results, NaOH might increase the reducing speed by accelerating the oxidation of the polymer by reducing the formed H+. The
observation of the decrease in the pH of the reaction solution after 60 min refluxing (Fig. S5) is presumably due to the 55
formation of H+ with oxidation of SA. It is known that an
increase in H+ concentration causes depression of reducing
Na-acrylate H2O Na-acrylate H2O, OH- H2C CH C O O Ag+ H2C CH C O O Ag(OH)x Slow Fast Agn-acrylate Ag0seed Ag(OH)x Ag+ OH- Ag+NO 3-(aq) Ag2O (s)↓
Scheme 1. Reaction Scheme for the Ag NP Formation 60
activity of organic compounds in the case of the reducing reaction eliminating H+.31 This is because the standard redox
potential is varied by pH. Therefore, it is highly possible that the reducing ability of SA is enhanced with increasing x. 65
In summary, there seems to be three possible reasons why both the reduction reaction of Ag+ and the nucleation of Ag
NPs are simultaneously accelerated under alkaline condition. The first possible reason is that the reduction reaction takes place at the solid-liquid interface. The surfaces of solid Ag2O
70
particles are converted to Ag(OH)x during the ramping of temperature, and then, the reduction of Ag(OH)x by SA occurs on the Ag(OH)x surface followed by nucleation to form Ag NPs. The second possible reason is that the reduction rate constant itself of Ag(OH)x is much higher than that of AgNO3
75
even under the same conditions. The third possible reason is that the reducing ability of SA is enhanced with increasing pH. These might affect the reaction kinetics synergistically and the formation rate of Ag NPs dramatically increases with increasing the NaOH concentration.
80
Conclusions
The role of NaOH on the reaction kinetics of Ag NPs formation were investigated using a wide variety of experimental/analytical techniques including UV-vis spectroscopy, TEM observation, XRD measurements, XAFS 85
spectroscopy, and kinetic analyses. All results clearly indicate
the existence of Ag2O and Ag(OH)x as alternative
intermediates when the NaOH concentration is high, which do not exist in the absence of NaOH. The possible reasons why the NaOH markedly accelerates the formation process of Ag 90
NPs are found to be as follows: (1) the solid-liquid interface reaction, (2) the higher reduction rate constant of Ag(OH)x,
and (3) the enhanced reducing ability of SA. Due to the dramatic increase in the reduction rate of Ag+, the
extremely-high supersaturation could be achieved on/near the surface of 95
Ag2O particles. As a result, the nucleation rate of Ag NPs is
bulk solution. Presumably, due to a huge difference in the reduction rates between AgNO3 in bulk solution and Ag(OH)x
on/near the surface of solid Ag2O, the nucleation and growth
processes might be separated autonomously. The clear separation between nucleation and growth processes might be 5
a reason why the monodispersity of Ag NPs synthesized our own scheme becomes exceptionally high.
Acknowledgements
We thank Mr. Kazuo Kato (JASRI) for assistance in using SSD instrument for XAFS measurement. The synchrotron 10
radiation experiments have been performed at the BL01B1 station in the SPring-8 synchrotron radiation facility with the approval for young researcher’s exploratory research (proposal No. 2010A1598) of the Japan Synchrotron Radiation Research Institute (JASRI).
15
Notes and references
a School of Materials Science , Japan Advanced Institute of Science and
Technology (JAIST), 1-1 Asahidai, Nomi, 923-1292, Japan. Fax: +81-761-51-1625; Tel:+81-761-51-1611; E-mail:shinya@jaist.ac.jp (S. M.), ebitani@jaist.ac.jp (K. E.)
20
b Department of Chemical System Engineering, School of Engineering,
The University of Tokyo, 7-3-1 Hongo, Bunkyo-ku, Tokyo 113-8656, Japan.
† Electronic Supplementary Information (ESI) available: TEM, pH values, fitting results, XAFS, and XRD patterns. See DOI: 10.1039/b000000x/ 25
1 G. Frens, Nature, 1973, 241, 20; J. Turkevich, Gold Bull., 1985, 18,
86; S. Link, Z. L. Wang and M. A. El-Sayed, J. Phys. Chem. B, 1999,
103, 3529; B. Lim, M. Jiang, J. Tao, P. H. C. Camargo, Y. Zhu and Y.
Xia, Adv. Funct. Mater., 2009, 19, 189. 30
2 M. Yamada, Z. Shen and M. Miyake, Chem. Commun., 2006, 2569; D. Lu, T. Qiu and X. L. Wu, Eur. Phys. J. B, 2004, 41, 49.
3 M. Yamada, S. Kon and M. Miyake, Chem. Lett., 2004, 34, 1050; Z. Liu, Z. Hu, J. Liang, S. Li, Y. Ynag, S. Peng and Y. Quia, Langmuir, 2004, 20, 214; B. Wiley, T. Herricks, Y. Sun and Y. Xia, Nano Lett., 35
2004, 4, 1733; J. Zeng, Y. Zheng, M. Rycenga, J. Tao, Z. Li, Q. Zhang, Y. Zhu and Y. Xia. J. Am. Chem. Soc., 2010, 132, 8552. 4 T. A. Ahmadi, Z. L. Wang, T. C. Green, A. Henglein and M. A.
El-Sayed, Science, 1996, 272, 1924; M. M. Koebel, L. C. Jones and G. A. Somorjai, J. Nanopart Res., 2008, 10, 1063; J. Ohyama, Y. Hitomi, 40
Y. Higuchi and T. Tanaka, Top. Catal., 2009, 52, 852.
5 J. Polte, T. T. Ahner, F. Delissen, S. Sokolov, F. Emmerling, A. F. Thunemann and R. Kraehnert, J. Am. Chem. Soc., 2010, 132, 1296. 6 M. Harada and Y. Inada, Langmuir, 2009, 25, 6049; M. Harada, Y.
Inada and M. Nomura, J. Colloid Interface Sci., 2009, 337, 427; M. 45
Harada and H. Einaga, Langmuir, 2007, 23, 6536; M. Harada and H. Einaga, Langmuir, 2006, 22, 2371.
7 S. Nishimura, A. Takagaki, S. Maenosono and K. Ebitani, Langmuir, 2010, 26, 4473; S. Nishimura, A. Takagaki, S. Maenosono and K. Ebitani, NSTI-Nanotech., 2010, 1, 356.
50
8 D. Mott, N. T. B. Thuy, Y. Aoki and S. Maenosono, Phil. Trans. R.
Soc. A, 2010, 368, 4275.
9 P. Silvert, R. Herrera-Urbina and K. Tekaia-Elhsissen, J. Mater.
Chem., 1997, 7, 293; I. Pastoriza-Santos and L. M. Liz-Marazan, Langmuir, 1999, 15, 948; J. H. Kim, C. K. Kim, J. Won and Y. S.
55
Kang, J. Membr. Sci., 2005, 250, 207.
10 D. L. V. Hyning and C. F. Zukoski, Langmuir, 1998, 14, 7034. 11 Y. Yin, Z. Li, Z. Zhong, B. Gates, Y. Xia and S. Venkateswaean, J.
Mater. Chem., 2002, 12, 522.
12 K. G. Stamplecoskie and J. C. Scaiano, J. Am. Chem. Soc., 2010, 132, 60
1825; J. Zheng and R. M. Dickson, J. Am. Chem. Soc., 2002, 124, 13982; S. He, J. Yao, P. Jiang, D. Shi, H. Zhang, S. Xie, S. Pang and H. Gao, Langmuir, 2001, 17, 1571.
13 J. M. Nedeljkovic and V. V. Vukovic, Langmuir, 1993, 9, 980; S. Kapoor, Langmuir, 1998, 14, 1021; T. Pal; T. K. Sau and N. R. Jana, 65
Langmuir, 1997, 13, 1481.
14 T. Pal; T. K. Sau and N. R. Jana, Langmuir, 1997, 13, 1481. 15 J. J. Mock, M. Barbic D. R. Smith, D. A. Schultz and S. Schultz, J.
Chem. Phys., 2002, 116, 6755; R. Zong, J. Zhou, Q. Li, B. Du, B. Li,
M. Fu, X. Qi, L. Li and S. Buddhudu, J. Phys. Chem. B, 2004, 108, 70
16713.
16 H. Wang, X. Qiao, J. Chen and S. Ding, Colloids Surf. A:
Physicochem. Eng. Aspects, 2005, 256, 111.
17 A. I. Frenkel, C. W. Hills and R. G. Nuzzo, J. Phys. Chem. B, 2001,
105, 12689; A. Jentys, Phys. Chem. Chem. Phys., 1999, 1, 4059; J. 75
Graaf, A. J. Dillen, K. P. Jong and D. C. Koningsberger, J. Catal., 2001, 203, 307.
18 B. J. Murray, Q. Li, J. T. Newberg, E. J. Menke, J. C. Hemminger and R. M. Penner, Nano Lett., 2005, 5, 2319.
19 D. D. Evanoff and G. Chumanov, J. Phys. Chem. B, 2004, 108, 80
13948.
20 X. Guang-nian, Q. Xue-liang, Q. Xiao-lin and C. Jian-guo, Colloids
Surf. A: Physicochem. Eng. Aspects, 2008, 320, 222.
21 D. Krishnan and T. Pradeep, J. Cryst. Growth, 2009, 311, 3889. 22 X. Ji, X. Song, J. Li, Y. Bai, W. Yang and X. Peng, J. Am. Chem. 85
Soc., 2007, 129, 13939; F. Zhang, J. Chen, X. Zhang, W. Gao, R. Jin,
N. Guan and Y. Li, Langmuir, 2004, 20, 9329; B. J. Morrow, E. Matijevic and D. V. Goia, J. Colloid Interface Sci., 2009, 335, 62. 23 X. Wang, H. Wu, Q. Kuang, R. Huang, Z. Xie and L. Zheng,
Langmuir, 2010, 26, 2774.
90
24 G. Biedermann and L. G. Sillen, Acta Chem. Scand., 1960, 14, 717. 25 H. Wang, X. Qiao, J. Chen, X. Wang and S. Ding, Mater. Chem.
Phys., 2005, 94, 449; K. Chou and C. Ren, Mater. Chem. Phys., 2000, 64, 241; S. L. Hsu and R. Wu, Mater. Lett., 2007, 61, 3719; B. He, J.
J. Tan, K. Y. Liew and H. Liu, J. Mol. Catal. A: Chem., 2004, 221, 95
121.
26 T. Mitsudome, A. Noujima, T. Mizugaki, K. Jitsukawa and K. Kaneda, Green Chem., 2009, 11, 793; K. Ebitani, K. Motokura, T. Mizugaki and K. Kaneda, Angew. Chem., Int. Ed., 2005, 44, 3423; K. Ebitani, K. Motokura, K. Mori, T. Mizugaki and K. Kaneda, J. Org. 100
Chem., 2006, 71, 5440.
27 I. Hussain, M. Brust, A. J. Papworth and A. I. Cooper, Langmuir, 2003, 19, 4831; R. Sardar, J. Park and J. S. Shumaker-Parry,
Langmuir, 2007, 23, 11883; P. N. Njoki, I. S. Lim, D. Mott, H. Park,
B. Khan, S. Mishra, R. Sujakumar, J. Luo and C. Zhong, J. Phys. 105
Chem. C, 2007, 111, 14664; I. Washio, Y. Xiong, Y. Yin and Y. Xia, Adv. Mater., 2006, 18, 1745.
28 C. E. Hoppe, M. Lazzari, I. Pardinas-Blanco and M. A. Lopez-Quintela, Langmuir, 2006, 22, 7027.
29 L. Longenberger and G. Mills, J. Phys. Chem., 1995, 99, 475; Y. Sun, 110
Y. Yin, B. T. Mayers, T. Herricks and Y. Xia, Chem. Mater., 2002,
14, 4736.
30 T. Sakai and P. Alexandrides, J. Phys. Chem. B, 2005, 109, 7766. 31 I. Sondi, D. V. Goia and E. Matijevic, J. Colloid Interface Sci., 2003,
260, 75; D. V. Goia and E. Matijevic, Colloids Surf. A: Physicochem. 115
Eng. Aspects, 1999, 146, 139.
32 M. S. Yavuz, W. Li and Y. Xia, Chem. Eur. J., 2009, 15, 13181. 33 I. Pastoriza-Santos and L. M. Liz-Marzan, Langmuir, 1999, 15, 948.