Perceived Market Risk of the Renewable Energy Industry in the United States
8
0
0
全文
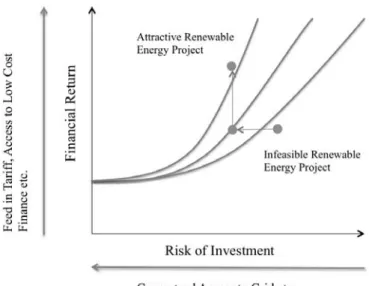
(2) Alexander Ryota Keeley. Timothy D. Keeley. the keys to mobilizing private investments in RE is creating attractive risk/ reward profiles, which means higher financial return and lowered risk of investments. There are various ways that can increase the financial return and minimize the risk of investment such as: setting grid codes, feed-in tariff policies, and providing access to low cost finance etc. As of 2015, 144 countries have set RE policy targets, and a lot of countries employ RE support policies such as feed-in tariff (FIT) and renewable portfolio standards (RPS) in order to support the utilization of RE technologies (REN 21, 2014). In the United States, although some observers would argue that the United States does not have a comprehensive national policy in place for promotion of RE technologies, there are important federal policies that are providing support such as corporate tax incentives for RE. Figure 1. Creating an attractive investment environment for Renewable Energy. Created based on (Glemarec, 2011). These policy supports could not only act as factors that directly lower the risk of investment and increase profitability, but also lower perceived market risk of RE companies leading to more access to low cost finance, which accelerates the uptake of RE. Therefore, looking at how these policies have actually affected perceived market risk of the RE industry is important for understanding the relation between the two. The main objectives of this paper are to estimate the market risk (the word risk in this paper refers to market risk observed from the equity performance) of the RE industry, and to assess the impact of key policy changes regarding RE in the United States by comparing the equity performance between different.
(3) Perceived Market Risk of the Renewable Energy Industry in the United States. periods created based on the key policies. In order to achieve these objectives, the Ardour Global Alternative Energy Index and S&P 500 are used for the representation of equity performance of the RE industry and the bench mark for the analysis.. Ⅱ.Literature Review As interest on the part of investors in environmentally friendly industries has increased, more studies have emerged in attempt to investigate the risk/return performance of those industries. Some researches on this topic have attempted to investigate the relationship between environmental stewardship and the financial performance of several companies and traded funds. Some of the pioneering works in this field, such as Spicer (1978), have shown that better pollution performance has improved profitability and reduced risks. However, when focusing on the RE industry, little effort has been made toward assessing the risk /return performance of the industry. Otras (2013) conducted one of the few studies approaching this topic and analyzed the financial performance of the mainstream Global Clean Techs equity indexes using a state-space market model. Some of the highlighted findings were: 1) Clean Techs indexes outperform the market portfolio in terms of returns, 2) Clean Techs indexes are highly volatile financial instruments even in bull markets. This study contributes to the preceding studies by focusing on the market risk of the RE industry in the United States in particular, and by assessing the impact of policy changes on market risk.. As stated in the introduction, in the United States, there have been important federal policies that have provided support to the domestic utilization of RE (Campbell, 2014). A brief introduction of each policy is provided below: The Energy Policy Act of 2005 The Production Tax Credit (PTC) for wind and biomass technologies was introduced. The law also authorized funds for developing RE technologies and loan guarantees for RE deployment, and required electric utilities to offer net metering to customers upon request. Furthermore, the law created the Renewable Fuel Standard (RFS) with requirements for blending 7.5 billion gallons of renewable fuel with gasoline by 2012..
(4) Alexander Ryota Keeley. Timothy D. Keeley. The Energy Independence and Security Act of 2007 (EISA) Continuing from the Energy Policy Act of 2005, EISA also provided funds to accelerate R&D for RE, particularly solar and geothermal power, and energy storage technologies. EISA also extended the RFS program with a mandate to blend 36 billion gallons of renewable fuel with gasoline and diesel fuel by 2022. The American Recovery and Reinvestment Act of 2009 (ARRA) ARRA was enacted as a stopgap measure in response to the financial crisis of 2007 to 2008 in order to aid economic recovery. More than $45 billion was appropriated for energy efficiency and RE programs across federal government programs, most of which was to be obligated before the end of FY 2010. Almost $8 billion was provided for energy and other R&D programs, $2.4 billion for energy technology and facility development grants, and $14 billion for electric power transmission grid infrastructure development and energy storage development (including $6 billion for loan guarantees). Another $14.1 billion was provided for RE tax incentives, with an additional $2.3 billion for energy efficiency tax incentives.. Ⅲ.Methods and Data This research applies a state-space market model to recursively estimate the market risk with the Kalman Filter optimization algorithm. Based on the preceding studies, although there are other approaches to estimate the timevarying behavior of the equity indexes risk and return, applying the state-space market model is found to show superior performance especially when daily market databases are employed (Otra, 2013). This model is given by the following system of equations: = α +β r +ε. where. (1). β = β 1+η. (2). α = α 1+ϒ. (3). is the return over the risk-free asset of the RE equity index in period t;. is the return over the risk-free asset of the Bench Mark (BM) index in period t; and-ε is the equation disturbance, modeled as an homoscedastic white noise process. This model allows the RE equity index s alphas and betas to vary over time and follow a random walk stochastic process. The beta-coefficient estimated through this formula can be considered as the manifestation of the market risk.
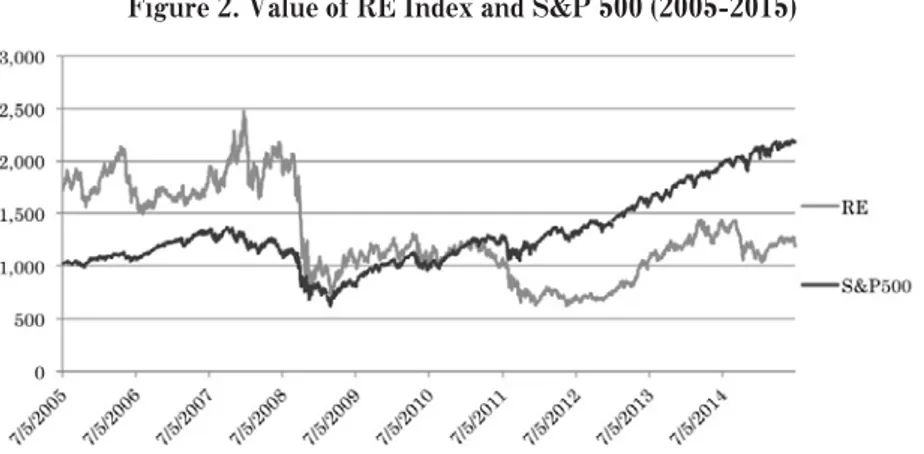
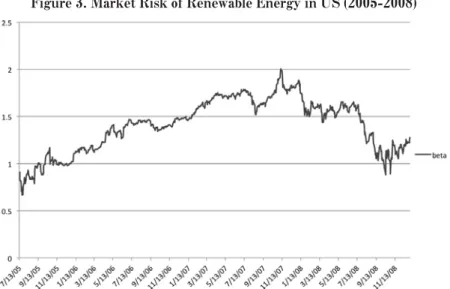
(5) Perceived Market Risk of the Renewable Energy Industry in the United States. (Yano, 2004).. The data used in this paper is: 1) the Ardour Global Alternative Energy Index (RE index), which is a weighted float adjusted equity index designed to serve as an equity benchmark for globally traded stocks of companies that are principally engaged in the field of Alternative Energy Technologies, including renewable energy, alternative fuels and related enabling technologies in North America; and 2) the S&P 500, which is a bench mark index that includes 500 leading companies and captures approximately 80% coverage of available market capitalization. The duration of the data is from July 2005 to July 2015. In this paper, daily market data is used instead of the monthly data, making the estimates comparatively more robust. The value of RE index and S&P 500 over the period of 2005 to 2015 is depicted in Figure 2. Figure 2. Value of RE Index and S&P 500 (2005-2015). Ⅳ.Results Using the state-space market model with the Kalman Filter optimization algorithm, the time-varying beta-coefficient of the RE index is estimated and presented as the manifestation of the market risk of RE industry in the United States. The analysis was conducted deviding the data into three sub-periods: 20052008, 2009-2010, and 2011-2015. This classification is based on the commencement of key RE policies in the United States: The Energy Policy Act of 2005, The Energy Independence and Security Act of 2007 (EISA), and The American Recovery and Reinvestment Act of 2009 (ARRA). Figure 3 shows the beta-.
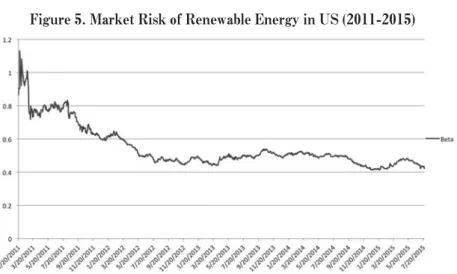
(6) Alexander Ryota Keeley. Timothy D. Keeley. coefficient of the RE index during the period of 2005 to 2008. The figure shows that the beta had stayed between 1 and 2. At the end of 2007, the beta started to decrease reaching around 1 in 2008, but considering the increase between 2005 and 2007, it is not prudent to conclude that The Energy Policy Act of 2005 had lowered the market risk of RE industry in the United States. Next, Figure 4 depicts the beta-coefficient during the period of 2009 to 2010. Although it seems a little volatile in the first quarter of 2009, the beta-coefficient steadily decreases over the period reaching below 1 at the end of 2010. Considering that ARRA, the policy enacted in 2009, provided the largest support in terms of the budget - more than $45 billion for energy efficiency and RE Figure 3. Market Risk of Renewable Energy in US (2005-2008). Figure 4. Market Risk of Renewable Energy in US (2009-2011).
(7) Perceived Market Risk of the Renewable Energy Industry in the United States. Figure 5. Market Risk of Renewable Energy in US (2011-2015). programs across federal government programs -, the lowered market risk of RE industries in the United States during this period is understandable. Finally, Figure 5 presents the beta-coefficient during the period of 2011 to 2015. Compared to the previous period, it stably stayed low, and steadily decreased with the passage of time. Most of the federal government programs under ARRA had finished before the end of 2010, thus it is problematic to try to explain the lowered market risk after 2011 with the policies focused on in this paper.. Ⅴ.Conclusion This research attempts to measure the market risk of the RE industry in the United States using an RE index and analyzing its time-varying beta-coefficient. The results of the analysis clarified that the market risk of the RE industry in the United States has steadily decreased over the course of time, stably holding around 0.4 during the recent period. Observing the period between 2005 and 2008, it is hard to conclude that the commencement of the energy act had a significant impact on the market risk of the RE industry. Moreover, ARRA commenced in 2009 and most of the support ceased by the end of 2010. However, even after the end of the support provided by ARRA, the beta-coefficient has steadily decreased. Therefore, it is difficult to determine the impact of each key national policy change on the market risk of the RE industry. Considering that there could be other factors such as the oil price change, decrease in cost of RE technologies, state-level RE policies, and financial shock etc. that could impact the market risk of RE industry in the United States, these factors need to be taken into account in.
(8) Alexander Ryota Keeley. Timothy D. Keeley. order to further understand the impact of national RE policies on market risk of the RE industry more clearly.. References [1]The Ardour Global Alternative Energy Indexes, Ardour Global Alternative Energy Index, accessed on April 12th 2016 (www.ardourglobalindexes.com/) [2]Bloomberg Market, S&P 500 Index, accessed on April 13th 2016 (https://www.bloomberg.com/ quote/SPX:IND) [3]B.H. Spicer Market risk, accounting data, and companies pollution control records J Bus Finance Account, 1978, pp. 67-83 [4]Eduardo Ortas and José M. Moneva, The Clean Techs equity indexes at stake: Risk and return dynamics analysis, Energy Volume 57, 2013, Pages 259-269 [5]Glemarec, Y. Catalysing climate finance: A guidebook on policy and financing options to support green, low-emission and climate-resilient development. New York, NY: United Nations Development Programme, 2011 [6]IEA. . Paris: OECD/IEA, 2015. [7]M. Santamouris, C. Pavlou, P. Doukas, G. Mihalakakou, A. Synnefa, A. Hatzibiros, et al. Investigating and analysing the energy and environmental performance of an experimental green roof system installed in a nursery school building in Athens, Greece Energy, 2007, pp. 1781-1788 [8]REN 21, RENEWABLES 2014 GLOBAL STATUS REPORT, 2014 [9]Richard J. Campbell, China and the United States―A Comparison of Green Energy Programs and Policies, 2014 [10] 矢野浩一,カルマンフィルターによるベータ推定,FSA リサーチ・レビュー, ,pp. ‐ ..
(9)
図
関連したドキュメント
Furuta, Log majorization via an order preserving operator inequality, Linear Algebra Appl.. Furuta, Operator functions on chaotic order involving order preserving operator
For example, a maximal embedded collection of tori in an irreducible manifold is complete as each of the component manifolds is indecomposable (any additional surface would have to
Keywords: continuous time random walk, Brownian motion, collision time, skew Young tableaux, tandem queue.. AMS 2000 Subject Classification: Primary:
Then it follows immediately from a suitable version of “Hensel’s Lemma” [cf., e.g., the argument of [4], Lemma 2.1] that S may be obtained, as the notation suggests, as the m A
To derive a weak formulation of (1.1)–(1.8), we first assume that the functions v, p, θ and c are a classical solution of our problem. 33]) and substitute the Neumann boundary
Our method of proof can also be used to recover the rational homotopy of L K(2) S 0 as well as the chromatic splitting conjecture at primes p > 3 [16]; we only need to use the
This paper presents an investigation into the mechanics of this specific problem and develops an analytical approach that accounts for the effects of geometrical and material data on
While conducting an experiment regarding fetal move- ments as a result of Pulsed Wave Doppler (PWD) ultrasound, [8] we encountered the severe artifacts in the acquired image2.
