Clothing Export from sub-Saharan Africa :
Impact on Poverty and Potential for Growth
著者
Fukunishi Takahiro
権利
Copyrights 日本貿易振興機構(ジェトロ)アジア
経済研究所 / Institute of Developing
Economies, Japan External Trade Organization
(IDE-JETRO) http://www.ide.go.jp
journal or
publication title
IDE Discussion Paper
volume
163
year
2008-07-01
INSTITUTE OF DEVELOPING ECONOMIES
IDE Discussion Papers are preliminary materials circulated
to stimulate discussions and critical comments
Keywords: manufacturing exports, poverty reduction, FDI spillover, productivity
JEL classification: F21, D24, J31, O33
* Research Fellow, Africa Study Group, Area Studies Center, IDE
([email protected])
IDE DISCUSSION PAPER No. 163
Clothing Export from sub-Saharan
Africa: Impact on Poverty and
Potential for Growth
Takahiro FUKUNISHI
Abstract
Increases in clothing exports after 2000 signaled the first incidence of large-scale manufacturing exports from sub-Saharan Africa. Using firm-level information, this paper explores the potential of clothing exports for poverty reduction and further growth as seen in other low income countries. It shows that the garment exporting industries in Kenya and Madagascar have contributed poverty reduction in the short term by providing mass employment for female and less educated workers with wages beyond the poverty line. However, the long-term impact is not certain. High production costs and limited development of local firms weaken potential for further growth in the competitive world market. Upgrading of the market and improvement of efficiency are required to remain competitive for African industries, and governmental support for local participation are needed to facilitate technology transfer.
The Institute of Developing Economies (IDE) is a semigovernmental,
nonpartisan, nonprofit research institute, founded in 1958. The Institute
merged with the Japan External Trade Organization (JETRO) on July 1, 1998.
The Institute conducts basic and comprehensive studies on economic and
related affairs in all developing countries and regions, including Asia, the
Middle East, Africa, Latin America, Oceania, and Eastern Europe.
The views expressed in this publication are those of the author(s). Publication does not imply endorsement by the Institute of Developing Economies of any of the views expressed within.
INSTITUTE OF DEVELOPING ECONOMIES (IDE), JETRO 3-2-2, WAKABA,MIHAMA-KU,CHIBA-SHI
CHIBA 261-8545, JAPAN
©2008 by Institute of Developing Economies, JETRO
No part of this publication may be reproduced without the prior permission of the
IDE-JETRO.
Clothing Exports from Sub-Saharan Africa:
Impact on Poverty and Potential for Growth
*Takahiro Fukunishi†
May 2008
Abstract
Increases in clothing exports after 2000 signaled the first incidence of large-scale manufacturing
exports from low-income countries in sub-Saharan Africa. Using primary and secondary firm-level
information, this paper explores the potential of clothing exports for poverty reduction and further
growth as seen in other low income countries. It shows that the garment exporting industries in
Kenya and Madagascar have contributed poverty reduction in the short term by providing mass
employment for female and less educated workers with wages beyond the poverty line. However, the
long-term impact is not certain. High production costs and limited development of local firms
weaken potential for further growth in the competitive world market. In the Kenyan industry, high
labour costs have pushed production costs up while productivity is only slightly lower than that of
Asian industry. High labour costs as well as uncertainty of market access have discouraged local
firms from participating in the export market. Upgrading of the market and improvement of
efficiency are required to remain competitive for African industries, and governmental support for
local participation are needed to facilitate technology transfer.
Keywords: garment industry, poverty reduction, productivity, FDI spillover, Africa
*
I would like to thank for comments by Tatsufumi Yamagata and participants in the session “Industrialization in LDC” at the Annual Bank Conference for Development Economics 2008 by World Bank. I also appreciate garment firms, staffs of Institute of Development Studies, University of Nairobi, and staffs of Institute of Business Administration, University of Dhaka for their
cooperation to the research. †
1. Introduction
Except for a few countries, the manufacturing sector has been stagnant in sub-Saharan Africa. Its
share in the economy, particularly in exports, is significantly smaller than other low income
countries, and this shows a sharp contrast to Asian countries. In East Asian countries,
labour-intensive products such as clothing, shoes, and wooden products have been main sources of
export growth in the early stage of industrialization, and this has contributed to the reduction of
poverty through provision of employment to unskilled workers (World Bank [1993], Pack and
Westphal [1986]). The same process occurred in other Asian and Latin American countries in the
1980’s and 1990’s, and recently even reached low income countries such as Vietnam and Cambodia.
The wave finally came to Africa after 2000, triggered by the free duty access to US markets: Africa
Growth Opportunity Act (AGOA). Foreign investments have been made in the garment industry1 in
several African countries, specifically Kenya, Madagascar, Lesotho, and Swaziland, and exports of
clothing to the US market sharply increased after 2000. This paper investigates whether the
emergence of clothing exports will lead to poverty reduction and economic growth in Africa.
There are several reservations with regard to replicating the Asian experience in Africa. First,
while the clothing industry provides large employment to unskilled and female workers, it is
criticized for its low wages and poor working conditions. It is argued that the intense competition in
the world textile market gives strong pressure of cost reduction for garment firms, as called
“immiserising growth” (Kaplinsky [2000]). Second, as the performance after termination of the
quota system in world textile market shows, there is a serious concern about the competitiveness of
African clothing within the free market system. Since the rapid growth of exports was initiated by
the non-duty and non-quota status given to African products, the termination of the quota system in
the world textile market has partly spoiled that advantage, and the growth trend has been disrupted in
some African countries. The literature suggests that an inefficient business environment and poor
1
In order to differentiate it from the spinning and weaving industry, the industry (firm) specializing in sewing and knitting processes of clothing production is called the garment industry (firm) in this paper.
technical knowledge in local firms has hindered development of the manufacturing sector in Africa
(Collier and Gunning [1999], Lall [1999], Biggs et al [1995]). Third, in the process of growth, local
firms have played an important role in most garment exporting countries, but they are not active in
Africa. Local firms not only supported multinational firms as subcontractors, but they finally
replaced multinational firms. This is also important for the transfer of technology and knowledge,
which is a source of sustained economic growth in theory as well as the Asian experience. It is
reported that local firms gained knowledge of technology, markets, and management from
multinational firms, and such technology transfer built the industrial base of Asian countries (World
Bank [1993], UNCTAD [2002]).
Reservations above are examined in this paper using firm level information including firm data
collected in Kenya and Bangladesh in 2003 and the author’s interviews in Kenya and Madagascar
from 2003 to 2006. The impact of poverty is discussed with respect to whether employment
provided sufficient income opportunities for the poor. Competitiveness of African products is
analyzed by comparing production costs between Kenyan and Bangladeshi firms, the latter being
successful garment exporters. Productivity and factor costs are also compared between the two
countries as a determinant of competitiveness. Local participation and technology transfer in the
Kenyan and Malagasy garment industries are reported based on the author’s interviews. In order to
understand the background of local firm response, the capacity and incentive for learning new
technology is analyzed for the case of Kenya.
In the next section, the recent trend of garment exports in Africa is summarized, and the impact on
poverty is discussed in the third section. Competitiveness of the African garment industry is
analyzed in the fourth section, and this is followed by an assessment of local participation in the fifth
2. Overview of Clothing Exports from Africa
Export of textile products started in South Africa and Mauritius in the 1980’s. Particularly
Mauritius is a typical replication of the Asian model, which foreign direct investment (FDI) initiates
export to US and EU markets. FDI first came from Hong Kong, which was seeking the quota free
status of Mauritius, and this was followed by investment from East Asia, Europe, and domestic
sources. Clothing exports were quite successful and realized rapid growth of GDP per capita with
large-scale employment (Bowman [1991]). As wages rose during 1990’s, the Mauritian industry
shifting production to Madagascar, and consequently, Madagascar became the third largest garment
exporter in Africa in the middle 1990’s. The South African industry also suffered from high wages,
and many firms shifted to Lesotho where wages were lower. By the 1990’s, however, only a few
countries exported to the non African markets, and production was very small relative to Asian
countries.
The African Growth and Opportunity Act (AGOA) brought about drastic change. It provided
duty-free and quota-free access for African textile products with very generous rules of origin, which
allow poor countries to use imported fabrics. Such access led to massive investment in some
privileged countries such as Kenya, Lesotho, Swaziland, and Madagascar from East Asia, South Asia,
Mauritius, and South Africa. During 2000-2005, 31 investment projects were undertaken in the
textile sector in Lesotho, and 17 projects were conducted in Swaziland mainly by Taiwanese and
South African firms.2 Lesotho benefited most from this opportunity; and it became the largest
African exporter to the US market. Its textile exports (about 450 million US dollars in 2004)
accounted for 68% of all commodity exports. In Madagascar, despite temporal interruption caused
by political turmoil in 2001, East Asian investment surged after the enactment of the AGOA.
Clothing exports further grew, and in 2004, they accounted for 56% of all commodity exports. In
Kenya, 30 foreign firms operated in Export Processing Zones, and they exported 300 million dollars
in 2004 (EPZA [2005]). To a lesser extent, investment flowed into Namibia, Botswana, Malawi, and
2
Documents created by Lesotho National Development Corporation and Swaziland Investment Promotion Authority.
other countries. Clothing exports from Africa to the US and EU doubled from 1997 to 2004 and
reached 2.8 billion dollars (Figure 1). Due to labour-intensive characteristics, it had much larger
impact on employment. Within the four main emerging exporters, it is estimated that exporting firms
created about 222,000 jobs.3
Figure 1 Clothing Exports from Africa
Export to Europena Market (million $)
0 200 400 600 800 1000 1200 1400 1600 1800 2000 1996 1997 1998 1999 2000 2001 2002 2003 2004 2005 2006 other South Africa SACU Madagascar Mauritius Export to US Market (million $)
0 200 400 600 800 1000 1200 1400 1600 1800 2000 1996 1997 1998 1999 2000 2001 2002 2003 2004 2005 2006 other Kenya Swaziland Lesotho South Africa SACU Madagascar Mauritius
Note: Exports from the Southern African Custom Union are separated by individual country after 2000. Source: UNComtrade, report by importers.
Growth trends changed after termination of the Multi-Fibre Agreement (MFA) in 2005.
Abolishment of the quota system changed the trade pattern, and this resulted in a growth of Asian
firms and a fall in African firms, particularly for the US market. Although quotas for China were
revived in the form of voluntary regulation, exports from Africa dropped by 17% in 2005. It was
reported that shrink of the sector brought loss of 20,000 jobs in Lesotho and Swaziland.4 Currently,
quotas set by the South African government for Chinese imports have partially mitigated drastic
reductions in production, but Lesotho and Swaziland industries will be in a critical phase after 2008
when quotas for Chinese products in the US, EU and South African markets will be swept away. The
3
Employment figures are based on EPZA [2005] for Kenya, data from the Ministry of Industry and Trade (cited in Mamininarivo [2006]) for Madagascar, and documents created by Lesotho National Development Corporation and Swaziland Investment Promotion Authority.
4
Documents created by Lesotho National Development Corporation and Swaziland Investment Promotion Authority.
Malagasy and Mauritian industries also received an adverse impact, but steady demand in the
European market has compensated the loss. Both industries recoded expansion of exports in 2006.
3. Impact on Poverty Reduction
Effect of development of garment industry on poverty reduction is questioned mainly from its
low wages and poor working condition. Global value chains literature argued that asymmetric
structure of an industry, for example intense competition among of suppliers and oligopoly within
buyers, created asymmetric distribution of value added among the value chains; buyers take a lion’s
share of value added of final products and suppliers get smaller share (Kaplinsky [2000]). Textile
industry is seen as a typical case of asymmetric structure with countless number of garment factories
and a few large multinational retailers because of easy entry to sewing process. Assuming the large
pool of cheap labour in the world, the asymmetric structure will be maintained and labour costs, a
part of value added, will be kept low. Basu [2003] argued that a government of developing country is
not motivated to improve wages and working conditions of multinational companies, unless all
governments in the world effectively enforce labour legislation, and capital flight to a less regulated
country is not possible.
However, if garment employment provides better income opportunity for the poor who have no
choice other than informal sector, it has positive impact on poverty reduction at least in short term.
We will see whether clothing exports has provided such opportunity.
3.1 Employment and Entry Barriers
Because of its labour-intensiveness in technology, the garment industry provides greater
employment opportunities relative to output. Since exporting firms do not compete with local firms
supplying domestic and African markets, a most of the 222,000 jobs created in the sector reflect net
growth in employment. These jobs have led to a significant increase in the amount of formal
employment in these countries where informal jobs are dominant. For example, in Madagascar,
created in the Swaziland garment industry account for about 40% of total formal employment. Even
in Kenya, where the industrial base is relatively large, employment in garment exporting firms
corresponds with 3% of the employment in the private sector in 2004.
Female workers dominate production jobs, namely supervisors, operators, and helpers, which
comprise the majority of employment in garment firms. In Kenya, around 80% of operators and
helpers, and 60% of supervisors working in Export Processing Zone (EPZ) are female (Table 1). The
dominance of female worker is more prevalent in EPZ sector than local garment industry.
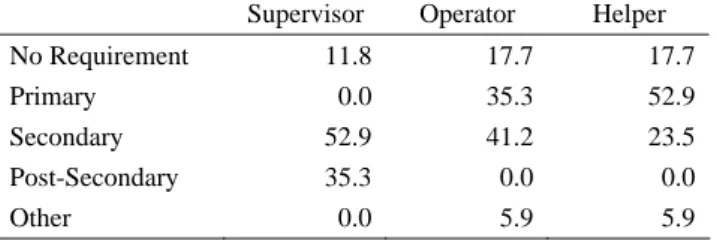
Employment is open to workers with less education and skill. Although the majority of EPZ firms
require primary or secondary education, no educational attainment is needed for 18% of the firms for
operators and helpers, and even for supervisors, 12% of the firms do not require education (Table 2).
Given that 18.1% of females in Nairobi have no education or primary incomplete (Central Bureau of
Statistics et al [2004]), the target of garment employment is neutral with respect to education. As for
skill, 82% of firms do not require previous experience in garment industry for helpers, and all firms
need less than one year experience for operators. Relatively low requirement of education and skill is
resulted from the nature of sewing skill, which can be developed in-house training (mainly
on-the-job). While some firms are open to uneducated people for all three types of job, other firms
set higher requirement for higher position; 89% of firms require supervisors to have secondary or
higher education. This suggests that workers with little education may have a difficulty in
promotion.
Table 1 Ratio of Female to Total Employment (percentage)
EPZ Firms (N=17) Local Firms (N=58) Managerial 30.1 18.5 Other Officer 39.3 34.5 Engineer 0.0 10.0 Designer 43.5 21.3 Supervisor 58.8 36.1 Operator 82.6 54.5 Helper 78.2 60.5
Table 2 Educational Requirements in EPZ Firms (percentage, N=17)
Supervisor Operator Helper No Requirement 11.8 17.7 17.7
Primary 0.0 35.3 52.9
Secondary 52.9 41.2 23.5
Post-Secondary 35.3 0.0 0.0
Other 0.0 5.9 5.9
Source: Firm survey in 2003
3.2 Wages
A job in the garment industry is in general regarded as a low-paying job. In Kenya, the average
monthly wage of EPZ garment firms was 82.9 US dollars in 2003, while the average wage in the
manufacturing sector was 142.3 US dollars (Central Bureau of Statistics [2004]). To reduce
heterogeneity in worker characteristics by industry, a comparison with wages of local garment firms
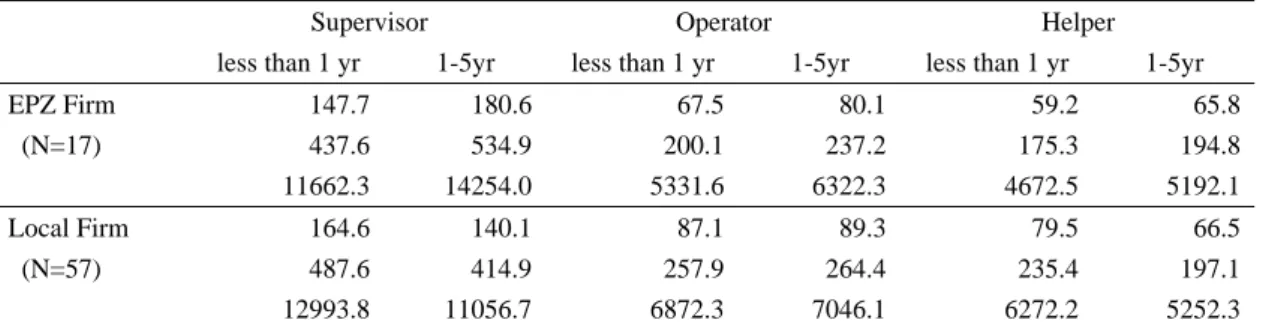
was made5 (Table 3). It indicates that with the exception of supervisors with one to five years
experience, EPZ firms pay less than local firms by up to 25 percent. Since there is a significant gap
in lifetime working experience (total experience in garment sector) between workers in EPZ and
local firms (the average experience operator of EPZ firms is 1.7 years and that of local firms is 4.6
years), the wage gap partly reflects the skill of workers. It follows that EPZ firms provide
employment for less experienced workers with lower wages in comparison with local firms.
Then, the wage level relative to the poverty line is critical to understand the impact on poverty
reduction. The monthly wage of operators in EPZ firm ranges from $200 to $237 in purchasing
parity rate (5300 to 6300 Kenya Shillings) depending on the experience6 (Table 3), which is far
above the international poverty line, 30 or 60 dollar as well as national poverty line, 3421 KSh.7
Also the average wage of helpers, $175 to $195 in PPP rate (4700 to 5200 Ksh), is higher than the
poverty lines. As most of helpers promote to operators within eight months, wage of operator can be
regarded as a standard wage for a less educated female worker. It is also notable that no gender
5
In this comparison, worker characteristics are only partially controlled, but heterogeneity is much smaller when compared with the other sector.
6
Reported wage information was obtained from managers. To confirm bias of the information, we also interviewed workers at their home and found that there were no unreasonable gaps, though manager’s reply may be slightly upward biased.
7
Poverty line for urban area is estimated from the official estimates of national poverty line in 1997 by incorporating price change until 2003 (Government of Kenya [2000a]).
discrimination is found in the EPZ sector wage. Table 4 showed that there is little wage gap by
gender except one category, while in local firms male wages are higher than female wages for
operators and helpers. It is thus evident that the average wage for female operator is sufficient for
more than three adults to live at $2 per day, and in conservative estimates, it can feed herself and one
child on the national poverty line. In the case of Madagascar, a labour market study showed that
wages of the firms in Zone Franche (export processing zone) were significantly higher than informal
sector wages, and that there were no significant gender gaps while informal jobs shows a large gap
(Glick and Roubaud [2006]). Overall, though garment job is less paid than other formal job, wage is
well beyond the poverty lines, in particular by the international standard, and it is open to less
educated and unskilled workers and less biased by gender.
Table 3 Average Monthly Wage by Position and Experience
(upper: dollar in exchange rate, middle: dollar in purchasing parity rate, lower: Kenya shilling)
Supervisor Operator Helper
less than 1 yr 1-5yr less than 1 yr 1-5yr less than 1 yr 1-5yr
EPZ Firm 147.7 180.6 67.5 80.1 59.2 65.8 (N=17) 437.6 534.9 200.1 237.2 175.3 194.8 11662.3 14254.0 5331.6 6322.3 4672.5 5192.1 Local Firm 164.6 140.1 87.1 89.3 79.5 66.5 (N=57) 487.6 414.9 257.9 264.4 235.4 197.1 12993.8 11056.7 6872.3 7046.1 6272.2 5252.3 Note: Experience indicates years worked in current employer. Due to young age of EPZ firms, information for workers with more than 6 years experience is not reported.
Source: Firm survey in 2003
Table 4 Female/Male Wage Ratio
Less than 1 yr 1-5 yrs EPZ (N=17) Local (N=57) EPZ Local Supervisor 1.03 1.57 0.87 1.12 Operator 1.08 0.91 1.02 0.92 Helper 1.02 0.83 1.01 0.72*
* Statistically different from one at 5% level. Note: Unpaired ratio
Source: Firm survey in 2003
Prospective of wage increases have also been a concern. In the case of Kenya, it is reported that
percent. The study, using Malagasy labour survey data, showed that wages for unskilled workers in
the Zone Franche sector did not grow despite considerable increases in wages for skilled labour
(Nicita [2006]). Since most helpers are promoted to operator (some to supervisor) after some
experience, even poor people can get wage increases due to promotion. In terms of wage changes
without promotion, however, evidence is mixed; Malagasy case imply that worker will have wage
increase once she promotes to an operator,8 while Kenyan case reported no increase in real term. The
Mauritian experience shows that wages rose steadily with 150 % growth from 1980 to 2000 in real
terms (Figure 2). It should be noted that industry in Mauritius has remained competitive with such
steady rise of labour cost by improving productivity (Subramanian and Roy [2003]) and by shifting
from low-end to middle range markets; this is consistent with the argument in global value chain
studies. Mauritian case indicates that sustained rise of wages can be seen if a strategic change of
industry is taken place.
Figure 2 Real Wages and Employment in the Mauritian Garment Industry
0 20000 40000 60000 80000 100000 1980 1982 1984 1986 1988 1990 1992 1994 1996 1998 2000 0 0.5 1 1.5 2 2.5 3 Employment Real wage (1982=1.0)
Source: Author’s calculation using statistics from the Central Statistic Office [various issues a] [various issues b].
8
Though definition of skilled and unskilled is not shown in Nicita [2006], some fraction of operators must be counted as a skilled worker considering the share of skilled worker (46%) in the sample. Then, their result implies operator can have wage rise due to time trend. Nicita [2006] also argued that garment employment is not pro-poor because only 45% of welfare gain is distributed to the poor. However, share of the poor in garment sector is 42% and welfare gain by promotion seems to be counted as gain for the non-poor and thus, gain by the poor may be underestimated.
3.3 Working Conditions
It is criticized that most EPZ jobs in Kenya are for casual workers who work with short contract
periods. Only potentially biased information on this issue is available. The average share of
permanent workers in total employment replied to by a manager is 73.1% (higher than the local firm
average), but many workers have complained about the short contract period and the fear of no
renewal. It is at least evident that Kenyan workers are not satisfied with working conditions in the
EPZ sector from the fact that large scale labour strikes occurred in 2003 demanding improvement of
working conditions including stable employment contract.
Working hours tend to be long, particularly before delivery dates. Workers are occasionally
requested to work very late and are forced to stay overnight in the factory due to unavailability of
transportation. A Malagasy labour market survey revealed that Zone Franche workers worked longer
and quit jobs more frequently than those in other private sectors (Glick and Roubaud [2006]). EPZ
firms in Kenya were also accused of not allowing workers participating to labour union.9 Because of
severe competition in the world market, managers are keen on improving efficiency of production,
which intensifies the workload of floor-level workers.
In contrast to the general perceptions, employment in the garment industry provides higher
income than work in the informal sector, which is the most likely alternative job opportunity. It
benefits particularly female workers, and it is partially open to uneducated workers. Gender and
education may affect a chance for promotion to the better-paid positions, but jobs in the exporting
sector provide sufficient income to live over the poverty line for the marginalized people. On the
other hand, instability of employment contracts and relatively poor working conditions are
disadvantages for workers. Also long-term wage increase may not be expected unless the industry
takes strategic change in the production and marketing.
9
Working condition in Kenyan EPZ firms was improved after the negotiation between union, EPZ firms, employer’s association and government. Government enforced labour legislation, unlike Basu’s argument, but industry-wide strikes evidently triggered the enforcement.
4. Competitiveness of African Products
Rapid growth of garment exports after 2000 brought a somewhat optimistic view of industrial
development in Africa, but cessation of growth trends after the termination of MFA has led to doubts
about the competitiveness of African products. It is argued in economic literature that technological
backwardness of firms and high transaction costs have caused stagnation of the manufacturing sector
in Africa. Based on field studies, technological capability studies found that most African firms use
obsolete technology with inefficient management, and attempt little learning, i.e. R&D,
improvement in production processes, and training for worker and managers. They argued that lack
of an effective technology policy has discouraged learning by firms, and scarcity of skilled workers
and lack of technological inflow (typically in the form of FDI) have weakened the capacity of
learning (Lall [1999], Biggs et al. [1995], Pack [1993]). On the other hand, microeconomic firm
studies have shown that the poor business environment in Africa has adversely affected production
in private firms. Weak contract enforcement, inefficient and sometimes anti-productive public
service, and poor infrastructures have increased the costs of business and have reduced the efficiency
of production (Collier and Gunning [1999]). These views are consistent with the argument that
attributed the success of Asia to their high educational levels and better institutions (Rodlik [1994],
World Bank [1993]).
Despite wide recognition of the technological backwardness and poor business environment in
Africa, however, industry and firm-level studies comparing performance between Africa and other
region are scarce.10 In this section, the competitiveness and performance of African garment firms
are compared with Asian firms.
4.1 Productivity and Competitiveness
Competitiveness of garment products is determined by cost, delivery, and quality. For low-priced
products that are main products of African firms, cost and delivery are particularly important (Lall
10
To the author’s knowledge, with the exception of Pack [1987], there are no studies comparing costs and productivity of exporting firms in Africa with other developing regions.
and Wignaraja [1994]). African products have a disadvantage in delivery because most fabrics are
imported from Asia, and this necessitates an extra 20 to 30 days for transportation. Consequently,
African exports consist primarily of basic items for which demand is relatively stable and slower
delivery is allowed. Costs are another critical part of competitiveness, and economic literature
suggests that they must be high in African firms because of technological backwardness and poor
business environments
Costs of production are compared using firm data in Kenya and Bangladesh. Garment exporting
firms in the both countries compete in the low-end market in the US and EU, so their costs are
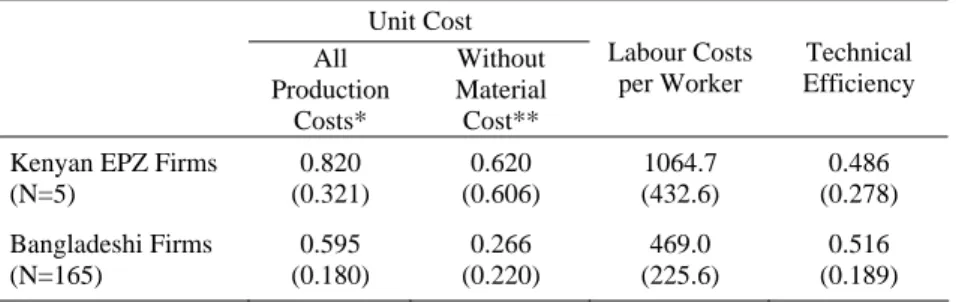
comparable. The first column of Table 5 shows that the average unit cost of Kenyan EPZ firms is
higher by 37.7% than that of Bangladeshi firms.11 This result is consistent with the change in trade
after 2005; US buyers switched their supply source from Africa to Asia due to lower costs. Then,
question is whether the cost disadvantage of Kenyan firms resulted from lower productivity, as
predicted by literatures, or higher factor prices. Among factor prices, capital and labour prices are
likely to differ in two countries because difference in unit cost becomes much larger when material
costs are excluded from production costs (note the second and third columns in Table 5).
Table 5 Cost Statistics and Technological Efficiency
Unit Cost All Production Costs* Without Material Cost** Labour Costs per Worker Technical Efficiency
Kenyan EPZ Firms (N=5) 0.820 (0.321) 0.620 (0.606) 1064.7 (432.6) 0.486 (0.278) Bangladeshi Firms (N=165) 0.595 (0.180) 0.266 (0.220) 469.0 (225.6) 0.516 (0.189) * Input costs per gross output.
** Capital and labour input costs per value added
Note: Average of the group. Standard deviations are in parentheses. Source: Fukunishi [2007]
The productivity of Kenyan and Bangladeshi firms is measured as technical efficiency, which
11
indicates deviation of actual output from the technically maximum output, given factor inputs12
(Fukunishi [2007]). Though measured technical efficiency differs by estimation model, the average
of Bangladeshi firms is higher than that of Kenyan firms in all estimations13. The difference of
technical efficiency ranges from 6% to 16 %, though the standard model shows the smallest
difference, and it is not statistically significant (Table 5). Estimates indicate that on average, Kenyan
EPZ firms are likely to be only slightly less productive than internationally competitive firms in
Bangladesh. Given that all Kenyan exporting firms are multinational firms with international
standard technology and knowledge, the technological backwardness is not significant in this case.
To understand what drives cost differences between Kenyan and Bangladeshi firms, unit cost is
decomposed into technical efficiency and factor prices using a cost function estimate. Deriving the
input demand function from the production function, technical inefficiency can be incorporated in
cost function:
)
,
,
,
,
(
)
,
,
,
,
(
)
,
,
,
,
(
r
w
Y
TE
AE
wL
r
w
Y
TE
AE
C
r
w
Y
TE
AE
rK
C
=
+
=
,where Y is output, K is capital, L is labour, r is rental price, w is wage, TE is technical efficiency, and
AE is allocative efficiency indicating a degree of misallocation of capital and labour, given factor
prices.14 The unit cost function is obtained by dividing cost by output. By taking the ratio of the unit
costs of two firms (firm i and j), the gap of unit cost between firm i and j is decomposed as
j i j i j i j i j i j i
AE
AE
TE
TE
Y
Y
w
w
r
r
D
D
β β β β β β β1 2 1− −1⎟
⎟
⎠
⎞
⎜
⎜
⎝
⎛
⎟
⎟
⎠
⎞
⎜
⎜
⎝
⎛
⎟
⎟
⎠
⎞
⎜
⎜
⎝
⎛
⎟
⎟
⎠
⎞
⎜
⎜
⎝
⎛
=
, (1)under the production function specified as
i i i i i
K
L
TE
error
Y
=
α
β1 β2∗
∗
12Production function with stochastic technical efficiency in the following form is estimated. ,
where Y: output, K: capital, L: labour, TE: technical efficiency, and error: stochastic disturbances. Technical efficiency ranges form 0 to 1, a higher score indicates more efficiency, and is assumed to be a stochastic variable.
13
A small number of the Kenyan sample present a potential problem in the estimation, though the production function estimates are based on larger samples (including Kenyan local firms), and the estimation results are stable over a variety of functional specifications. For methodology and detailed results of the estimation, refer to Fukunishi [2007].
14
Though allocative efficiency does not indicate productivity in the standard definition, it represents a part of managerial effort to reduce costs. Thus, it can be regarded as a reflection of knowledge that an individual firm has.
i i
i
i
K
L
TE
Y
=
α
β1 β2∗
,where D = C/Y is unit cost, β= β1+β2, and
AE
i is extra cost borne by misallocation of inputs.15The first two terms in the right hand side represent the contribution of a gap in factor prices to the
unit cost ratio between firm i and firm j, and the third term represents the contribution of scale
economy. The fourth term is the contribution of technical efficiency followed by allocative efficiency.
Hypothetical average Kenyan firms, with average input, output, factor prices, and efficiency are
compared with hypothetical average Bangladeshi firms.
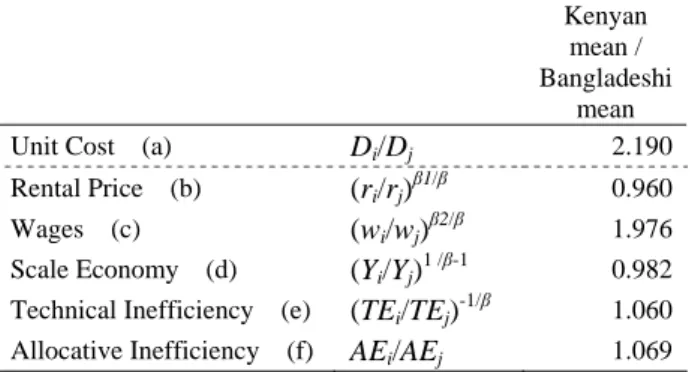
Unit cost is defined as capital and labour cost per value added, and the Kenyan mean unit cost is
2.19 times larger than that of Bangladeshi firms (Table 6). This result suggests that technical
“inefficiency” has pushed up the unit cost of Kenyan firms by 6% relative to the Bangladeshi mean,
and even if allocative inefficiency is added, these inefficiencies inflated unit costs by 13.3%.16 On
the other hand, wages make the largest contribution, increasing unit costs by 97.6%, and rental
prices and scale economy have slightly reduced costs (because of the large size of Kenyan EPZ
firms). The estimate shows that most of the gap in unit costs is explained by labour costs and to
much lesser extent by productivity. This is in contrast to predictions made in economic literature.
Table 6 Decomposition of the Difference of Unit Cost
Kenyan mean / Bangladeshi
mean Unit Cost (a) Di/Dj 2.190 Rental Price (b) (ri/rj)β1/β 0.960 Wages (c) (wi/wj)β2/β 1.976 Scale Economy (d) (Yi/Yj)1 /β-1 0.982 Technical Inefficiency (e) (TEi/TEj)-1/β 1.060 Allocative Inefficiency (f) AEi/AEj 1.069 Note: As indicated by equation (1), a = b*c*d*e*f.
Source: Fukunishi [2007]
i
AE
15
is a function of AE and parameters (β). β1 and β2 are estimated using production function. A full extension of the unit cost function is shown in Fukunishi [2007]. For details of the
methodology, refer to the paper. 16
From table 6, contribution of technical efficiency (1.060) multiplied by that of allocative efficiency (1.069) gives 1.133.
4.2 Adverse Effect of the Business Environment
What about adverse effect of business environment? Does not the poor business environment in
Kenya hurt productivity and inflate costs? In fact, both Kenya and Bangladesh have been recognized
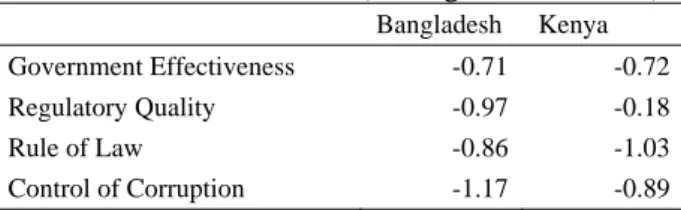
as a country with the worst governance. The governance index created by the World Bank Institute
rated them in the bottom quarter of the world with respect to “rule of law” and “control of
corruption” (World Bank Institute [2007]). A comparison of this index (Table 7) shows that levels of
the governance index are similar between the two countries and far below the world average (except
for “regulatory quality” in which Kenya received a better evaluation).
The national level governance evaluation is consistent with the firm level information for business
environment. It reveals that delays in material delivery occurred more frequently in Kenyan EPZ
firms than in Bangladeshi firms, while power failures happen more frequently in Bangladesh (Table
8). Though delivery delays are partly the result of long transportation distances, managers of Kenyan
firms also complained of slow and corrupt custom clearance. The largest Export Processing Zone in
Kenya is equipped with an independent power supply, and this may have improved the electric
supply. It was also reported that sales collection took longer for Kenyan firms, but 27 days on
average is not very long considering due dates. Managers indicated that foreign buyers complied
with contracts. This evidence suggests that there is not a large difference in business environment of
Kenya and Bangladesh, and poor business environment do not seriously affect operation.17 Simple
technology of the industry is likely to minimize the adverse effect of the poor business environment
on productivity.
Table 7 Governance Index (Average of 2002-2004)
Bangladesh Kenya
Government Effectiveness -0.71 -0.72 Regulatory Quality -0.97 -0.18
Rule of Law -0.86 -1.03
Control of Corruption -1.17 -0.89 Note: Indices range form -2.5 to 2.5 with world mean at zero. Source: World Bank Institute [2007]
17
Rodrik [2005] argued that improvement of business environment is not always the first step to stimulate entrepreneurial activities based on the experiences in South Korea, China and Latin America.
Table 8 Business Environment Occurrence of Delivery Delay Days of Blackout Days to Collect Sales Kenyan EPZ Firms 3.35*
(3.77) 12.16 (17.27) 26.58 (28.48) Bangladeshi Firms 1.04 (2.98) 18.68 (33.80) 20.07 (15.27) * Statistically different from the Bangladeshi average at the 5% level.
Note: Delivery delay and blackouts in the last three months were surveyed. Standard deviations are in parentheses. Source: Firm Survey in 2003
4.3 Wages and Labour Market
The average wage for Kenyan firms is higher by 2.3 times than that of Bangladeshi firms (Table
5), but wage levels of exporting firms are very close to the minimum wage. Thus, the minimum
wage is a barrier for exporting firms to lower wages, but given wages offered in the informal sector,
elimination of the minimum wage is unlikely to produce wages at the same level of Bangladesh.18
The wage gap corresponds with the national poverty line; the poverty line in Nairobi is higher by 2.6
times than that in Dhaka (Fukunishi et al [2006]). Further reduction of wages will aggravate the
health condition of workers, and firms will not have incentive to do so.
High wages can result from factor endowment pattern. Wood and Mayor [2001] argue that the
factor endowment pattern in Africa is skilled-labour scarce and land abundant, and it gives a
comparative disadvantage to manufacturing products. In absence of wage equalization for some
reasons, a country with scarce skilled labour may have higher wages than one with abundant labour.
Then, can factor endowment explain this situation? Actually, labour is scarce relative to land in
Kenya when compared with very populous Bangladesh. Then, the prices of agricultural products and
land in Kenya would not be higher than those in a country with scarce land. The poverty line, based
on the commodity basket in which food and rent have a large share, must therefore not be higher
than Asian countries. Comparative advantage based on factor endowment pattern is not consistent
with relative price level in Kenya.
18
The average wage of manufacturing micro and small enterprises (less than 10 employees), which mainly comprised of informal sector is 3771 KSh in 1999 (Central Bureau of Statistics et al. [1999]).
Relatively high wages are not a unique feature of the Kenyan labour market. In other garment
exporting countries, such as Lesotho, Swaziland, Mauritius, and South Africa, wages are not lower
than those in Kenya, and only the Malagasy labour market offers low wages.19 Among these
countries, Lesotho, Swaziland, and South Africa are struggling in the export market, while Mauritius
and Madagascar recovered growth. Mauritius and Madagascar differ from other exporting countries
in market orientation. A substantial share in exports is directed to the European market, while other
African countries rely mostly on the US market. The European market is characterized as having a
relatively large demand for quality and variation, and consequently orders tend to be small with
longer lead time (Gereffi and Memedovic [2003]). This is more suitable for African industries with
high wages, smaller clusters, and logistical disadvantages. Besides, efforts have been made in the
Mauritian industry to improve productivity during the period of steady wage increases (Subramanian
and Roy [2003]), which is partly a result of upgrading the market from low-end to middle range.
Currently, Mauritius remains competitive with middle-range garments in the European market with
an average wage of 279 US dollars.
For poverty reduction, an alternative way to strengthen competitiveness is to improve productivity
and reduce other input costs. The Mauritian experience is a good model for African countries to
follow; improving productivity, upgrading from a bottom range market to middle range, and
developing domestic textile supply.
5. Spillover from FDI to Local Firms
5.1 Linkage with Local and Multinational Firms
In many garment-exporting countries, local firms developed technical capacity through interaction
with multinational firms, and gradually replaced them. The most impressive spillover was seen in
Bangladesh where about 700 local exporters were operating only five years after the first garment
19
The monthly wage for operators in Lesotho is 100 US dollars, 80 US dollars in Swaziland, 130-180 US dollars in urban areas of South Africa (Gibbon [2003]), 50-55 US dollars in Madagascar (author’s interviews with exporting firms). The average monthly labour cost per worker (including all types of workers) in Mauritius was 279 US dollars in 2003 (Central Statistics Office [2005]).
exports supported by a Korean firm (Rhee and Belot [1989]). Following the emergence of FDI, local
entrepreneurs in Mauritius had invested in the garment industry and it is estimated that they
contributed to more than 50% of the total investment (Bowman [1991]). In Sri Lanka, garment
export was triggered by FDI that mainly came from East Asia in late 1970’s, but local firms also
ventured into export and recorded just as good performance as foreign firms (Athukorala and
Rajapatirana [2000]). More recently, local garment firms in Vietnam have developed through joint
ventures and technical cooperation with Korean and Hong Kong firms (Ngoc Ca and Dieu Anh
[1998]).
Multinational firms, particularly in the garment industry, are sometimes described as “foot-loose”
(Gibbon [2003]) because small initial sunk costs allow them to change location in a short period.
Thefore, development of local firms has helped to sustain long-term growth of exports in Asian
countries. In addition, the spillover of technology and knowledge to local firms is regarded as
technology transfer, which is seen crucial for the economic growth of developing countries in the
theoretical and empirical literatures.20 FDI spillover is considered to be an important path for
technology transfer through labour turnover and vertical linkage of firms (UNCTAD [2002], Lall
and Urata [2003]). In fact, several studies suggest that lack of manufacturing FDI is one of the
reasons for technological backwardness in Africa (Lall and Pietrobelli [2004], Pack [1993], Biggs et
al [1995]).
According to the author’s survey, spillover was very limited in Kenya and Madagascar. In Kenya,
among 120-150 local firms in major cities, 19 were found to be working with EPZ firms as
subcontractors21. In Antananarivo, where many multinationals are located, there was no cluster of
local garment firms, and several small firms subcontracting with multinational firms were scattered
20
Endogenous growth models suggested that technology transfer is necessary for developing countries to catch up, though not guarantee (Grossman and Helpman [1991], Barro and
Sala-i-Martin [1997], and Parent and Prescott [2004] among others). Romer [1992] described the Mauritian experience as a typical case in which technology transfer led to economic growth. 21
Due to the unavailability of a complete firm list, the number of local firms was estimated from the firm survey by contacting all firms in the several incomplete firm lists (including one used in World Bank RPED survey). Firms with less than ten employees, most from the informal sector, were not included. For details of the survey methodology, see Fukunishi et al [2006]. Local exporters were identified through the survey and author’s interviews with firms and industrial associations.
around the city. On the other hand, the volume of FDI and the growth of garment exports in these
countries was no less than that of other low income countries. Employment by EPZ firms in Kenya
is as large as that of Mauritius and larger than that of Sri Lanka in the middle of 1980’s, that is, about
10 years after the start of exports in the both countries. The annual growth rate of Kenyan exports
between 2000 and 2004 was 58.5%, which is much faster than the growth rate of Mauritius from
1985 to 1990 (30.0%) when the fastest growth was recorded. FDI to Madagascar is larger and has a
longer history than that in Kenya. Despite the substantial accumulation of FDI, participation of local
firms in export markets is very small.
5.2 Learning Capacity and Incentives
The process of spillover is described as the learning of new technology and knowledge for export
markets. Production of export products differs from domestic products in quality, volume of order,
lead-time, and management of logistics (Lall and Winaraja [1994]), so firms attempting to enter into
the export market must learn. Literature on technology transfer, however, argues that absorptive
capacity is necessary for firms to learn new technology (for example, Nelson and Phelps [1982] and
Abramovits [1986]), and thus, leaning by local firms from FDI depends on their absorptive capacity.
Further, incentives for learning affect a firm’s learning decision, as learning is not cost less. It
requires training and consultancy costs, opportunity costs of giving up current production, and
foregone profits during trial and errors of new technology in addition to physical investment.22 It
also entails risk because technical and market information of new technology may not be completely
known before learning. Based on interviews with local and EPZ firms, local capacity and learning
incentives were analyzed for the Kenyan case23 (Fukunishi [forthcoming]).
Profiles of local exporters and non-exporters revealed that the former did not necessarily have
better leaning capacity than the latter. Majority of local exporters were newly established by Kenyan
22
Social learning literature modeling technology transfer (or imitation) assumes learning costs and risks (for example, Chamley [2004]).
23
Thirty-three firms (10 local exporting firms, 18 local non-exporting firms and 5 EPZ firms) were visited in 2005 and 2006. For details of the interviews, see Fukunishi [forthcoming].
entrepreneur with expatriates spun-off from EPZ firms.24 Most Kenyan entrepreneurs had no
experience in the garment industry and relied on the technical and market knowledge of expatriates.
On the other hand, existing local firms have a good capacity to manage production and are as
effective as Bangladeshi firms on average.25 EPZ firms visited local firms and offered subcontracts
to some of them,26 but only four existing firms ventured into the export market. This evidence
suggests that knowledge belongs to human capital, and local firms can at least start in the export
business by recruiting skilled workers. This is consistent with cases in Asia where labour turnover
has played important role (Rhee and Belot [1989]). No support for lack of learning capacity was
found.
Though exports have been rapidly growing, returns from export businesses were quite uncertain
before 2005 because of the termination of MFA. Among 18 non-exporting firms interviewed, six
indicated that they did not start their export business because of market risks (Table 9). However,
interviews also revealed that they only have a general perception of the volatility of demand and
prices in export markets rather than specific concerns regarding market access. In fact, with one
exception, all non-exporting firms did not understand the regulation of market access.
Despite long stagnation of the domestic market,27 export market was not attractive for local firms.
Table 9 indicates that six firms regard the export market as not profitable, and three firms think that
current business is more profitable. Altogether, half (nine) of the interviewed firms thought that the
export market was not attractive. This negative evaluation relates primarily to output price with eight
out of nine firms responding that prices are too low to make sufficient profits (the remaining firm did
not give a clear answer). Wages of local firms are even higher than EPZ firms on average (Table 3),
and in the presence of an active union, however, cutting wages is not a feasible option. Given the
current wage level, managers of local firms must be aware that it would be very difficult to make a
24
Among 19 local exporters, 15 firms were newly established and four were existing firms having switched from a domestic market.
25
The average technical efficiency of Kenyan local firms is 0.514; this is comparable with values in Table 5.
26
Among 18 non-exporting local firms interviewed, 12 talked with EPZ about subcontracting (Table 9 indicates that 6 firms had no offer from EPZ firms).
27
Sales for the domestic market have been shrinking since trade liberalization because of the influx of imports and secondhand items (Mccormick et al [1999]).
profit with the output price offered by EPZ firms. In contrast, local exporters offer lower wages than
non-exporting firms by 30% on average, and this gives them a more favorable expectation for return.
Newly started local exporters did not need wage cuts.
To offset high wages, higher productivity is needed. Given their average wage, local firms must
realize higher productivity than EPZ firms. While EPZ firms have made efforts to raise productivity,
which include developing long-term training schemes and using sophisticated machines,
productivity is not yet as good as that of Bangladesh firms as we have seen. For local firms with less
knowledge, human capital, and experience, it is not easy, and a long period of trial and error is
necessary. This inflates learning costs as well as the risk of learning.
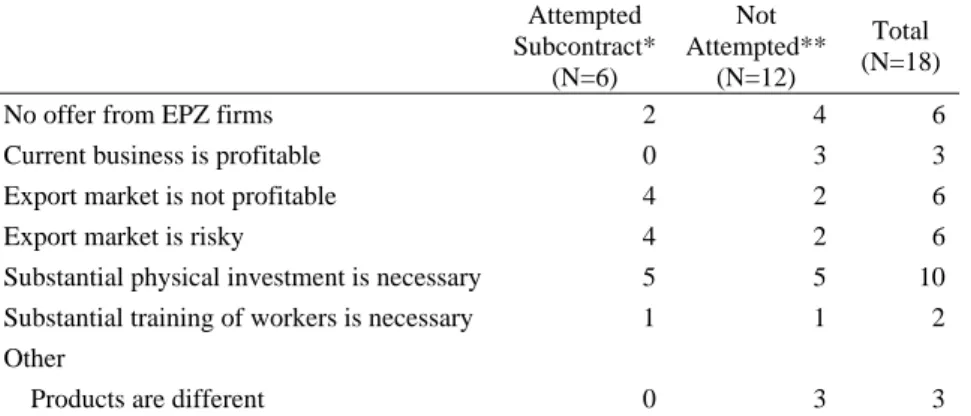
Table 9 Reasons Not to Take Subcontracts from EPZ Firms (Multiple Answers)
Attempted Subcontract* (N=6) Not Attempted** (N=12) Total (N=18)
No offer from EPZ firms 2 4 6
Current business is profitable 0 3 3
Export market is not profitable 4 2 6
Export market is risky 4 2 6
Substantial physical investment is necessary 5 5 10 Substantial training of workers is necessary 1 1 2 Other
Products are different 0 3 3
* Firms which attempted subcontracts of EPZ (but not realized). ** Firms which did not attempt subcontracts. Source: Fukunishi [forthcoming]
Physical investment is raised by 10 local firms as a reason not to start an export business (Table 9).
In general, at least 150 sewing machines are necessary to take subcontracts of EPZ firms, while local
firms possess 50 machines on average. Newly established exporters spent 14.9 million Ksh (about
190,000 US dollars) on average (including factory buildings if purchased), though existing firms
need much less investment. Among 18 non-exporting local firms interviewed, only three small firms
were not access to credit, and rest firms replied that they are unwilling to borrow for investment
significantly differ from Bangladesh and India in the country-level statistics,28 the inactive response
of Kenyan firms can not be attributed to credit constraints. A possible interpretation for this is that
the expected return on investment in the export business is not higher than the interest rate.
In the case of Kenya, low expectations for profitability and general risk for the export market
discouraged investment in export business, while learning capacity and credit constraint had an
adverse effect only on small firms. This resilt, however, may not be extended to the case of
Madagascar, because wages in Malagasy firms are lower than those in Kenya. The background of
limited FDI spillover in African garment industry has not yet been explored.
6. Conclusion
Foreign investment in the garment industry has created formal employment, particularly for
female and less educated people in urban areas. Though wages are generally lower, and working
hours tend to be longer than in other private sector jobs, new employment opportunity provides
income well beyond the poverty line with less gender bias in wages and promotion. If working
conditions are improved, clothing exports will be able to contribute to poverty reduction in urban
areas.
However, middle and long term impact on poverty is less clear. The garment industry in Africa is
less competitive in terms of cost and logistics and spillover effect to local firms is quite limited.
Consequently, growth of the industry is questioned in some countries, and diversification of
industrial structure through technological development of local firms can not be assumed currently.
Investigation of the case of Kenya shows that in contrast to existing studies, cost disadvantages
result primarily from high labour costs, while the productivity gap is small. Technology and
knowledge is brought by multinational firms, and the adverse effect of the business environment on
productivity is minimized due to simple technology of the garment sector. Limited spillover is not
attributed to poor absorptive capacity and credit constraints in the case of Kenya, which are often
28
raised by the economic literature. Again, high labour costs and uncertainty in the export market have
discouraged local firms from investing in export opportunities. Without further investigation, this
evidence cannot be extended to other African countries such as Madagascar where wages are less
than other African exporting countries. However, this study does indicate new aspect of stagnation in
the African manufacturing sector.
Though minimum wages have kept labour costs high, elimination of such is unlikely to solve the
problem in view of efficiency wage as well as poverty reduction. The only solution is to improve
productivity. As the case of Mauritius shows, improvement of productivity can sustain
competitiveness with high labour costs. Upgrading the market as well as increasing efficiency is
needed, but multinational firms tend to switch locations rather than make efforts to improve, and
local firms without market linkage and technical knowledge face high learning costs. Governments
can support solutions to these problems. They can give multinational firms incentives to stay through
providing better business environment and economic and political stability. They can also help
learning by local firms by linking them with multinationals, encouraging technology transfer, and
Bibliography
Abramovitz, Moses [1986] “Catching Up, Forging Ahead, and Falling Behind,” The Journal of
Economic History, Vol. 46, No.2, pp.385-406.
Athukorala, Prema-chandra and Sarath Rajapatirana [2000] Liberalization and Industrial
Transformation: Sri Lanka in International Perspective, Oxford; Oxford University Press.
Basu, Kaushik [2003] Globalization and Marginalization: A Re-examination of Development Policy, BREAD Working Paper No.026, Bureau for Research in Economic Analysis of Development. Barro, Robert and Xavier Sala-i-Martin [1997] “Technological Diffusion, Convergence, and
Growth,” Journal of Economic Growth, Vol.2, pp.1-26.
Biggs, Tyler, Manju Shah and Pradeep Srivastava [1995] Technological Capabilities and Learning in
African Enterprises, World Bank Technical Paper No. 285, Washington D.C; World Bank
Bowman, Larry W. [1991] Mauritius: Democracy and Development in the Indian Ocean, Boulder; Westview Press.
Central Bureau of Statistics [2004] Economic Survey, Nairobi, Ministry of Planning and National Development, Kenya.
Central Bureau of Statistics, International Center for Economic Growth and K-Rep Holdings [1999]
National Micro and Small Enterprise Baseline Survey 1999: Survey Results, Kenya.
Central Bureau of Statistics, Ministry of Health, and ORC Macro [2004] Kenya Demographic and
Health Survey 2003, Calverton, Maryland; CBS, MOH and ORC Macro.
Central Statistic Office [various issues a] Digest of Industrial Statistics, Ministry of Finance and Economic Development, Mauritius.
Central Statistic Office [various issues b] Annual Digest of Statistics, Ministry of Finance and Economic Development, Mauritius.
Chamley, Christophe P. [2004] Rational Herds: Economic Models of Social Learning, Cambridge; Cambridge University Press.
Collier, Paul and Jan Willem Gunning [1999] “Explaining African Economic Performance “, Journal
of Economic Literature, Vol.37. No.1, pp.64-111. pp.722-756.
EPZA (Export Processing Zones Authority) [2005] Annual Report, Nairobi; Export Processing Zones Authority.
Fukunishi [forthcoming] "Learning Process in Kenyan Garment Industry: Has Technology Spilled over from FDI?", in Kawakami ed., Repositioning Local Firms in Global Value Chains, Interim Report, Institute of Developing Economies, pp.97-129.
Fukunishi, Takahiro [2007] Has Low Productivity Constrained Competitiveness of African Firms?:
Comparison of the firm performances with Asian Firms, IDE Discussion Paper Series No.129,
Chiba: Institute of Developing Economies.
Fukunishi, Takahiro, Mayumi Murayama, Akio Nishiura and Tatsufumi Yamagata [2006]
Industrialization and Poverty Alleviation: Pro-poor industrialization strategies revisited,
UNIDO Research Programme Report, United Nations Industrial Organization.
Gereffie, Gary and Olga Memedovic [2003] The Global Value Chain: What Prospects for Upgrading
by Developing Countries, Sectoral Studies Series, Vienna: United Nations Industrial
Development Organization.
Gibbon, Peter [2003] “The African Growth and Opportunity Act and the Global Commodity Chain for Clothing,” World Development, Vol.31, No.11.
Glick, Peter and François Roubaud [2006] “Export Processing Zone Expansion in Madagascar: What are the Labour market and Gender Impact?”, Journal of African Economies, Vol.15. No.4 Government of Kenya [2000] Interim Poverty Reduction Strategy Paper 2000 – 2003, Nairobi:
Government of Kenya.
Grossman, Gene M. and Elhanan Helpman [1991] Innovation and Growth in the Global Economy, Massachusetts: The MIT Press.
Kaplinsky, Raphael [2000] “Globalisation and Unequalisation: What Can Be Learned from Value Chain Analysis?”, Journal of Development Studies, Vol. 37, No.2, pp.117 – 146.
Lall, Sanjaya ed. [1999] The Technological Response to Import Liberalization in SubSaharan Africa, London; Macmillan Press.
Lall, Sanjaya and Ganeshan Wignaraja [1994] “Foreign Involvement and Garment Exports by Developing Countries,” Asia-Pacific Development Journal, Vol.1, No.2.
Lall, Sanjaya and Carlo Pietobelli [2002] Failing to Compete: Technology Development and
Technology Systems in Africa, Cheltenham, Edward Elgar.
Lall, Sanjaya and Shujiro Urata eds. [2003] Competitiveness, FDI and Technological Activity in East
Asia, Cheltenham; Edward Elgar.
Maminirinarivo, Ralaivelo [2006] “The Textile and Clothing Industry of Madagascar”, in Jauch and Traub-Merz eds., The Future of Textile and Clothing Industry in Sub-Saharan Africa, Bonn: Friedrich-Ebert-Stiftung.
McCormick, Dorothy, Peter Kimuyu, and Mary Njeri Kinyanjui [1999] Institutions and the
Industrialisation Process: A Proposal for a Study of the Textile and Textile Products Industry in Kenya, IDS Working Paper, No.527, Nairobi; University of Nairobi.
Nelson, Richard R. and Edmund S. Phelps [1966] “Investment in Humans, Technological Diffusion, and Economic Growth,” The American Economic Review, Vol.56, No.1/2, pp.69-75.
Ngoc Ca, Tran and Le Dieu Anh [1998] “Technological Dynamism and R&D in the Exports of Manufactures from Viet Nam,” in Ernst et al eds. [1998], pp.266-324.
Nicita, Alessandro [2006] Export Led Growth, Pro Poor or Not?: Evidence from Madagascar’s
Textile and Apparel Industry, World Bank Policy Research Working Paper 3841, Washington
D.C.: World Bank.
Pack, Howard [1993] “Productivity and Industrial Development in Sub-Saharan Africa,” World
Development, Vol.21, No.1, pp.1-16.
Pack, Howard [1987] Productivity, Technology, and Industrial Development: A Case Study in
Textiles, World Bank Research Publication, New York; Oxford University Press.
Pack, Haward and Lally E Westphal [1986] “Industrial Strategy and Technological Change,” Journal
of Development Economics, Vol.22 No. 1, pp.87-128.
Parente, Stephen L. and Edward C. Prescott [2002] Barriers to Riches, Cambridge: The MIT Press. Rhee, Yung Whee and Therese Belot [1989] Export Catalysis in Low-Income Countries, Industry
and Energy Department Working Paper, Industry Series Paper No.5, Washington D.C.; The World Bank.
Rodrik, Dani [2005] “Growth Strategies,” in P. Aghion and S.N. Durlauf eds., Handbook of
Economic Growth, Vol. 1A, Amsterdam; Elsevier.
Rodrik, Dani. [1994] “King Kong Meets Gozilla: The World Bank and The East Asian Miracle”, in A. Fishlow, C. Gwin, S. Haggard, D. Rodrik, R. Wade, Miracle or Design?: Lessons from the
East Asian Experience, Policy Essay No.11, Washington D.C.; Overseas Development Council,
pp. 13-53.
Romer, Paul M [1992] “Two Strategies for Economic Development: Using Ideas and Producing Ideas,” Proceedings of the World Bank Annual Conference on Development Economics 1992, World Bank; Washington D.C.
Sabramanian and Roy [2003] “Who Can Explain the Mauritian Miracle? Meade, Romer, Sachs, or Rodrik?,” in D. Rodrik ed., In Search of Prosperity: Analytic Narratives on Economic Growth, Princeton; Princeton University Press.
UNCTAD (United Nations Conference on Trade and Development) [2002] World Investment Report
2002, New York and Geneva; United Nations.
Wood, Adrian and Jörg Mayer [2001] "Africa's Export Structure in a Comparative Perspective,"
Cambridge Journal of Economics Vol.25 No.3, pp.369-394.
World Bank [2007] World Development Indicators, Washington D.C., World Bank. World Bank [1993] The East Asian Miracle, New York: Oxford University Press. World Bank Institute [2007] Governance Indicators,