Gambling with Liberalization: Smallholder
Livelihoods in Contemporary Rural Malawi
著者
Takane Tsutomu
権利
Copyrights 日本貿易振興機構(ジェトロ)アジア
経済研究所 / Institute of Developing
Economies, Japan External Trade Organization
(IDE-JETRO) http://www.ide.go.jp
journal or
publication title
IDE Discussion Paper
volume
117
year
2007-08-01
INSTITUTE OF DEVELOPING ECONOMIES
IDE Discussion Papers are preliminary materials circulated to stimulate discussions and critical comments
IDE DISCUSSION PAPER No. 117
Gambling with Liberalization:
Smallholder Livelihoods in
Contemporary Rural Malawi
Tsutomu TAKANE*
August 2007
Keywords: Livelihoods, rural development, agriculture, nonfarm income, Malawi, Africa
Abstract
This paper examines the livelihoods of smallholder households in Malawi based on information derived from six villages in various parts of the country. Through detailed analysis of own-farm production and off-farm economic activities, the study explores similarities, diversities, and disparities in rural livelihoods. Liberalization policies and the high risk of crop failure have produced large disparities between those who achieve high income from own-farm production and those who do not. Off-farm income can help to reduce the risk of own-farm production, but is also a source of income disparity and provides little opportunity for upward economic mobility to escape poverty.
The Institute of Developing Economies (IDE) is a semigovernmental, nonpartisan, nonprofit research institute, founded in 1958. The Institute merged with the Japan External Trade Organization (JETRO) on July 1, 1998. The Institute conducts basic and comprehensive studies on economic and related affairs in all developing countries and regions, including Asia, the Middle East, Africa, Latin America, Oceania, and Eastern Europe.
The views expressed in this publication are those of the author(s). Publication does not imply endorsement by the Institute of Developing Economies of any of the views expressed within.
INSTITUTE OF DEVELOPING ECONOMIES (IDE), JETRO 3-2-2, WAKABA,MIHAMA-KU,CHIBA-SHI
CHIBA 261-8545, JAPAN
GAMBLING WITH LIBERALIZATION:
SMALLHOLDER LIVELIHOODS IN CONTEMPORARY RURAL MALAWI
by
Tsutomu TAKANE
(Institute of Developing Economies, Japan)
1. INTRODUCTION
Malawi is one of the poorest countries in the world. Its gross domestic income per capita in 2004 was only 160 dollars, ranking it 201st among the 206 countries from which statistics were available (World Bank 2006). Although the country's economy is largely dependent on agriculture, agricultural production occasionally suffers from unfavorable weather. In the famine of 2001-2002, for example, famine-related mortalities totaled at least 46,000 (Devereux and Tiba, 2007). Crop failure in the 2004/2005 season led to approximately four million Malawians suffering severe food shortages (FEWSNET 2005).
This paper is about livelihood strategies adopted by the Malawian rural population under these difficult conditions. The analytical approach adopted in this study is based on the framework of sustainable rural livelihoods (Carney, 1998; Ellis, 2000; Ellis and Freeman, 2005; Scoones, 1998, Scoones and Wolmer, 2002). Information is drawn from the author’s survey of six villages in various parts of rural Malawi.
The purpose of this study is threefold. The first is to clarify the effects of recent policy changes regarding economic liberalization for smallholder producers. The second is to find common features in the livelihoods of smallholder households across different locations in Malawi. The third is to examine the diversity of livelihood strategies and the disparities among smallholders. Smallholder livelihoods in Malawi are characterized by a lack of mechanization in agriculture, increasing land shortages, limited opportunities for off-farm incomei, and the dependence on and the high risks of rain-fed agriculture. Wealth status, access to resources, and livelihood options differ markedly from household to household. By adopting differentiated analysis across socioeconomic groups, this study highlights both the similarities of livelihood strategies and the factors
of social differentiation among smallholder households.
This paper broadens the scope of existing studies of rural livelihoods in Malawi. First, it provides a comparative perspective of rural livelihoods in different locations. Past literature (Orr and Mwale, 2001; Ellis et al., 2003; Peters, 2006) tended to focus on southern Malawi, and relatively little is known about the livelihoods of other rural areas. This paper uses case studies of six villages with varied socioeconomic situations in northern, central, and southern Malawi to take a wider perspective than the existing literature.
Second, this paper explicitly examines the role of tobacco production. Smallholder burley tobacco production became a new economic opportunity as the result of government liberalization policies in the early 1990s (Jaffee, 2003; Orr, 2000; van Donge, 2002; Hazarika and Alwang, 2003). Despite the importance of smallholder tobacco production in the reduction of poverty, relatively little information is available about the role of tobacco in smallholder livelihoods.ii With this in mind, Jaffee (2003, p.4), in his review of Malawi’s tobacco sector, stated, “some work on this [i.e., the impact of tobacco production on smallholders] was undertaken in the mid-1990s, yet there have been little or no household/community studies done in recent years to expressly examine the impacts....” This information gap led another scholar to argue that “much of the policy debate has taken place in a vacuum with little reference to what is happening to poverty” (Harrigan, 2003, p.858). This paper intends to fill this gap in knowledge.
The third way this paper broadens the scope of existing studies is by contributing to the discussion of nonfarm income’s role in reducing poverty in Africa. Much has been written on the diversification of income sources among African rural households and how this could potentially increase incomes and reduce vulnerability. Less emphasis has been placed on the limitation of the nonfarm income in reducing poverty and its potential effects on widening the economic disparitiesiii. This paper emphasizes the differentiated access to lucrative nonfarm income among rural households and the limited capacity of nonfarm income to stimulate upward economic mobility in rural Malawi.
The paper is organized into eight sections. The next section briefly reviews the history of government policies on smallholder production in Malawi. The third section describes the study’s fieldwork method. The next two sections examine the production of two major crops grown in Malawi, maize and tobacco. This is followed by an
examination of off-farm economic activities. Section seven describes the overall income portfolio of rural households and examines the extent and causes of income disparities. The last section presents the conclusions drawn from this study.
2. GOVERNMENT POLICIES FOR SMALLHOLDER SECTOR
Throughout the colonial and post-colonial periods until the 1980s, government policies mainly supported large-estate agriculture at the cost of the smallholder sector. For example, in response to the rapid growth of smallholder tobacco production in the 1920s, the colonial government founded the Native Tobacco Board (NTB). The NTB restricted smallholder production by registering African growers, limiting the size of their holdings, monopolizing the purchase of tobacco grown by Africans, and excluding smallholders from burley tobacco production. These restrictions discouraged smallholder tobacco production and in turn protected the vested interests of the European estates (McCracken, 1983). In addition, the establishment of the Maize Control Board in 1946 protected European settlers who produced export crops. This was done by supplying relatively large amounts of food to Africans who worked in the large estates, and by discouraging surplus maize production by Africans, which together ensured a stable supply of labor to the estates (Vaughan, 1987).
The end of colonial occupation in 1964 did not change the government's discriminatory policies against the smallholder sector. The independent government continued to support production by large estates owned by politically connected Malawians, while imposing various restrictions on smallholders. Two major institutional arrangements that deterred the development of smallholder production were the Special Crops Act, which forbade the cultivation of major cash crops by smallholders, and the Agricultural Development and Marketing Corporation (ADMARC), which monopolized the inputs and produce marketing of smallholders. These restrictions resulted in the stagnation of smallholder production and forced a large number of the rural population to become a cheap labor source for the estate sector (Kydd and Christiansen, 1982).
After the introduction of structural adjustment programs in the 1980s, the government implemented a series of reforms that brought about major changes in the smallholder sector. These included the deregulation of marketing activities, the reconstruction of input and output price regimes, and the restructuring of state marketing agencies
(Chilowa, 1998; Harrigan, 2003). In the food crop sector, ADMARC ceased to be the sole marketing agent for smallholder produce once licensed private traders were allowed to enter the market in 1987. Although this liberalization merely formalized the informal activities of existing small traders, it also stimulated the emergence of new large-scale private companies in the market. By the mid-1990s, licensing was no longer required to handle the smallholder crops, and the maize price band was abandoned in 2000 (Mvula et al., 2003; Devereux and Tiba, 2007).
The liberalization of produce marketing was followed by further deregulation of agricultural inputs in the 1990s. The marketing of hybrid maize seeds was liberalized in 1993 and subsidies were removed in 1994. Similarly, private companies were allowed to market fertilizer after 1994 and subsidies were removed in 1995 (Smale and Phiri, 1998). The removal of subsidies together with the depreciation of Malawi Kwacha in the 1990s resulted in sharp price increases for seeds and fertilizer, which adversely affected smallholders’ access to agricultural inputs.
Credit institutions for smallholder maize production were also changed. Until the early 1990s, most farmers received improved seeds and fertilizer on credit at subsidized prices and low interest rates from the Smallholder Agricultural Credit Administration (SACA), a governmental institution. Farmers received the inputs through the ADMARC and repaid their loans when they delivered their outputs through the ADMARC. After the collapse of SACA credit institutions in 1994 due to low repayment rates, the SACA was converted into the Malawi Rural Finance Company (MRFC), a limited liability finance company. The MRFC used market-determined interest rates and shifted their loan target to tobacco farmers. As a result, most smallholders faced difficulties in obtaining credit for maize production.
In the tobacco sector, major reforms occurred in the early 1990s when the Special Crops Act of 1972 was amended to allow smallholders to grow burley tobacco under a quota system.iv In 1990/1991, 7,600 smallholders were registered to grow burley tobacco on a pilot basis (Zeller et al., 1998). Initially, farmers were required to sell their tobacco to ADMARC, but later they were organized into clubs and given direct access to auction floors. In 1993/1994, more than 30,000 smallholders were organized under 1,318 clubs (Van Donge, 2002). Thereafter, the number of smallholder tobacco producers increased and smallholder tobacco production expanded dramatically in the 1990s. From 1992 through 1995, smallholders produced, on average, only 23% of the total tobacco crop in Malawi. The share reached 72% in the years 2001–2004v.
According to one estimate (Jaffee, 2003), there were 315,000 to 330,000 smallholders producing tobacco in the early 2000s.
3. FIELDWORK METHODS AND STUDY LOCATIONS
Fieldwork for this study was carried out in six villages in various parts of Malawi (Figure 1): Kachamba (Mchinji District), Belo (Mangochi District), Horo (Phalombe District), Bongololo (Rumphi District), Mulawa (Mzimba District), and Mbila (Kasungu District). Care was taken to choose villages that represent several socioeconomic characteristics, such as location, the predominant ethnic group, the degree of population pressure on the land, variations in access to non-farm activities, and proximity or remoteness from trading centers. The aim of this selection procedure was both to include various socioeconomic situations in which smallholder production is taking place, and to provide a location- and context-specific understanding of livelihood circumstances in various areas of rural Malawi. No claim is made, therefore, that the results of this study represent national patterns in a statistical sense..
Fieldwork in Kachamba and Belo was undertaken between August and October 2004, and data were obtained for the 2003/2004 agricultural season, when agricultural production was normal. In the remaining four villages, data were collected between May and September 2005 for the 2004/05 agricultural season, when a severe crop failure occurred due to erratic rain. A structured questionnaire was used in the survey, and this writer attended, recorded, and reviewed all interviews. In addition, farms operated by sample households were measured using global positioning systems to obtain accurate data on the size of the plots.
The sampling framework comprised all households in each village. The households were divided into two categories: those that had grown tobacco in the previous season and those that had not. Equal numbers of households were randomly selected from both groups. In Kachamba, however, all households were interviewed because the sample frame was small. For the same season, all households in Mulawa, except one, were interviewed.vi In Bongololo, the number of sample households that grew tobacco exceeded those that did not, because there were only six households that did not. The total sample size for all villages was 186 households, which comprised 116 tobacco-growing and 70 non-tobacco-growing households (Table 1).
It is estimated that 64% of total area farmed was allocated to maize production. The second-most important crop in terms of allocated area was tobacco, which was estimated to occupy about 19% of total area farmed. The percentage of tobacco-growing households in the six villages was 59%.
Average farm size varied greatly (Table 1). Households in Belo on average farmed 1.76 hectares, while those in Horo farmed only 0.58 hectare. The average for all households was 1.03 hectares. The differences stem from the unique history of each village and the resultant degree of population pressure on land.
4. MAIZE PRODUCTION
(a) Degree of Household Self Sufficiency
The production of maize in Malawi is largely rain-fed, and the national production level fluctuates widely depending on the weather in a given year. Since the start of the 1990s, Malawi has suffered crop failures in 1991/92, 1993/94, 1996/97, 2000/01, and 2004/05vii. Given such uncertainty, self-sufficiency in maize production is a major priority for most smallholder households. This is not simply because maize is used to make the staple meal of stiff porridge (nsima). In the lean period of January to March, it often becomes very difficult to purchase maize due to supply shortages and high prices. The malfunctioning of food markets causes people's lack of confidence in the markets, inducing the rural households to grow as much maize as possible to secure their consumption needs (Alwang and Siegel, 1999). As the result of this food security concern, maize was cultivated by every sample household.
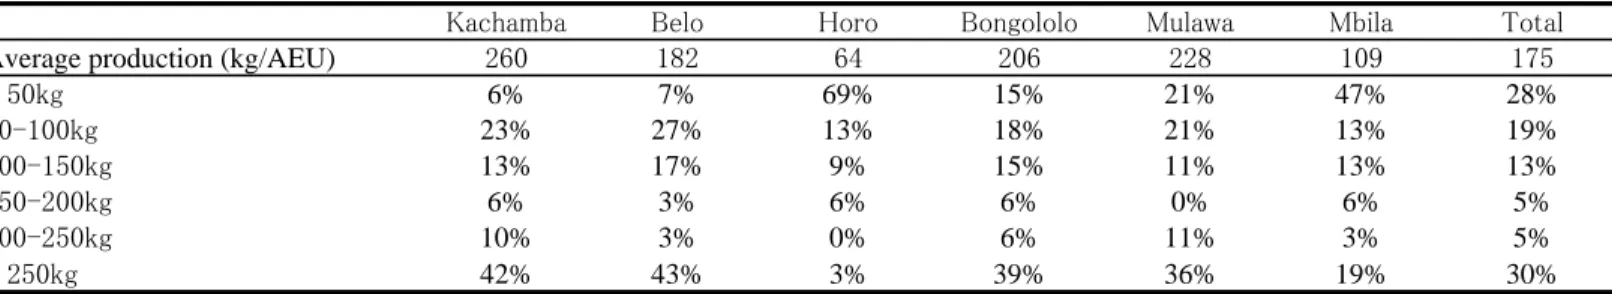
Despite this food security-driven planting pattern, self-sufficiency of maize production among the sample households was far from adequate. Maize production per adult equivalent unit (AEU) in the sample averaged 175 kilograms, falling short of the minimum requirement of 200 kilogramsviii. On average, the sample households were not self sufficient in maize production.
Judging the overall average masks large variations among the villages and households. As Table 2 shows, per-AEU maize production in Kachamba, Bongololo, and Mulawa were above the minimum requirement, while the other three villages were below. Particularly inadequate were Horo and Mbila, where production was severely affected by erratic rain in 2004/05. Horo was the worst hit, averaging only 64 kilograms per AEU, even though fertilizer application had been above the six-village average
(Table 3). Across the sample, 30% of households produced more than 250 kilograms of maize per AEU, which is well above the self-sufficiency level. On the other hand, 28% produced less than 50 kilograms per AEU, falling far below the minimum requirement. Similarly, 20% retained maize stocks until the next harvest (meaning they attained self sufficiency), while 13% exhausted their stocks before October, more than six months prior to the next harvest. These signify the existence of large differences in the degree of maize self-sufficiency among the households.
(b) Production Cost Structure and Income
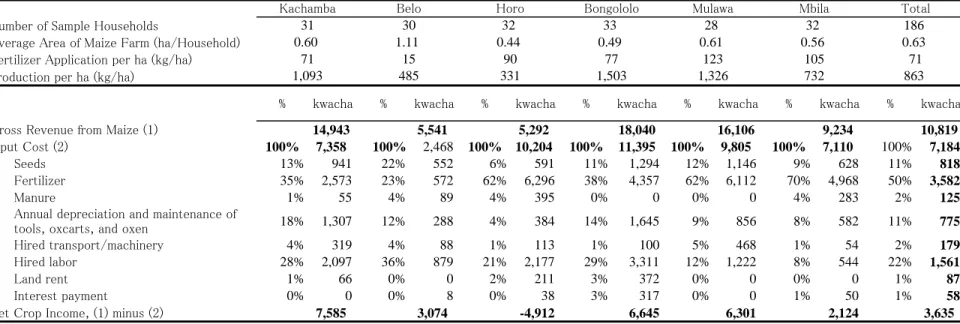
Production cost structures for maize (Table 3) exhibited variations and similarities across the study villages. Large variations were seen in area planted, production per hectare, and crop income (gross revenue minus costs). The variations in area planted with maize can be attributed to varying degrees of land scarcity among the villages. For example, the relatively large maize farms in Belo (1.11 hectares on average) reflected a local abundance of land, while small maize farms in Horo (0.44 hectare) were due to an increasing population.
The variations in the production level and crop income per hectare can be explained by two factors. One was the effect of the erratic rain in the 2004/05 season, which adversely affected production in Horo and Mbila. Another was the level of fertilizer application. Poor production in Belo was mainly due to the low level of fertilizer application. In Belo, poor productivity due to limited use of fertilizer was compensated by large farm sizes.
A major similarity in the production cost structure of maize across the villages was the high cost of fertilizer and hired labor. The most expensive input was fertilizer, which accounted for 50% of total cost, followed by hired labor (22%). An exception was seen in Belo, where the low level of fertilizer use considerably reduced the total cost, but also gross revenue per hectare due to poor production.
Net crop income from maize did not increase as the level of fertilizer (and production) increased. This was because the high gross revenue due to aggressive fertilizing was largely cancelled by the high cost of purchasing fertilizer. The correlation coefficients between maize income and the amount of fertilizer applied were positive but statistically insignificant in two villages, and negative in other villages, of which two were statistically significant. This suggests that the increased application of fertilizer does not increase net crop income. In addition, when production fails due to
bad weather, households that apply more fertilizer may experience higher losses than those who do not, because of the added cost.
Increased maize production through fertilizer application certainly improves the food security situation of households. Given the fact that it often becomes very difficult to purchase maize through markets in lean periods, keeping enough maize stock in household granaries is particularly important. On the other hand, households can achieve food security only by purchasing expensive fertilizer. Those who produced enough maize did so at the expense of having to bear higher production costs.
(c) Limited Green Revolution
The adoption of the improved technology in maize production with the use of fertilizer and modern varieties of seeds has been limited in Malawi (Smale and Phiri, 1998). The major reason has been the cost of purchasing fertilizer and seeds. Although farmers know the advantages of these technologies and desire to adopt them, the cost is more than they can afford. As a result, the average application of fertilizer on maize farm per hectare among the sample households was only 71 kilograms, which was less than one third of the recommended amount of 250 kilograms (Langyintuo, 2004). Even with this small amount of fertilizer applied by the sample households, the cost of fertilizer alone accounted for 50% of the total production cost (Table 3). Assuming that a farmer with the average maize farm among the samples (0.63 hectare) bought the recommended amount of fertilizer and hybrid seeds, they had to spend MK12,159ix for these inputs. This amount is equivalent to more than half of the average annual household income of the sample households. Due to a lack of credit for maize production, most farmers simply cannot afford the recommended inputs.
Adoption of improved technologies is further inhibited by the high risk of agricultural production. Farmers in Malawi occasionally experience production failure caused by erratic rain. Investing in high-cost inputs under such conditions increases the risk of income loss. For example, assuming that the recommended amount of fertilizer and hybrid seeds were purchased and the other production costs were the same as those in Table 3, the minimum breakeven yield is 1.84 tons. This figure is very close to the mean yield of hybrid maize in a drought year (1.9 tons) reported by Smale (1995: p.826, citing Jones and Heisey, 1994), suggesting that adopting new technologies does not guarantee sufficient net maize income in a bad-weather year. Consequently, high cost and high risk have the limited adoption of improved technologies.
5. TOBACCO PRODUCTION
This section reviews certain features of smallholder tobacco production from two perspectives. First, tobacco and maize production are compared in terms of labor use, land allocation, and production cost structure. Second, socioeconomic characteristics of tobacco growers and non-growers are highlighted. These analyses show that not all smallholder farmers can grow tobacco, because some face entry barriers to tobacco production.
(a) Maze and tobacco production
A comparison of tobacco and maize production reveals four distinctive features of tobacco production. First, it requires much more labor than maize production in terms of both tasks and duration of work. The survey found that total labor input per hectare was 4.1 times as much as that for maize, a clear indication of the labor-intensive nature of tobacco production.
Second, tobacco requires more working capital than maize. The labor-intensive nature of tobacco often forces farmers to hire workers to complement family labor. The cost of hired labor on tobacco farms per hectare far (Table 4) exceeded that used on maize farms (MK14,954 and MK1,561, respectively). In addition, tobacco production requires current inputs such as seeds, fertilizer, manure, and materials for barns and bales, which increases the cost of production. As a result, farmers needed 6.1 times more working capital for tobacco than maize. Only farmers who can afford such high production costs can engage in tobacco production.
Third, the net income per hectare from tobacco is high, but the high income is subject to high risks. Table 4 shows that net income per hectare among the sample households was MK14,315, or 3.9 times higher than that for maize. Although high production costs can be compensated by high gross revenue and net income per hectare, tobacco income is subject to risks in terms of both price and production. The average price of tobacco on the auction floor has been declining since 2000 (Table 5), resulting in much lower net income than in the 1990s. There is also the high risk of incurring a loss when a crop fails due to bad weather. This was exactly what happened in Horo and Mbila in the 2004/05 season. Prolonged dry spells in the central and southern regions led to gross revenues that were considerably lower than those in other villages. As a result, the net
income from tobacco in Horo and Mbila was negative. In all six villages, 34 per cents of sampled tobacco growers experienced negative income from the crop. This clearly shows that tobacco is a risky business.
The fourth distinctive feature of tobacco is that households with relatively large farms are more likely to grow tobacco than those with small farms. Households give priority to maize over other crops to secure food for consumption. Therefore, those with limited land do not venture into tobacco production at the expense of maize production. In addition, it is difficult for farmers with small tobacco farms to achieve the minimum production level of one bale (about 100 kilograms) required for sale through the official marketing channel. For these two reasons, the percentage of tobacco-growing household rises as farm size increases (Table 6).
(b) Tobacco growers and non-growers
There are four major differences between tobacco-growing and non-growing households (Table 7). First, tobacco-growing households held more land and operated larger farms. Second, more family labor (household members 15 years old or over) was available in tobacco-growing households. Abundant family labor is an advantage for tobacco production because of its labor-intensive nature. Third, average household income per AEU among the tobacco-growing households was higher. This was because the high net income per hectare of tobacco increased household income. Exceptions to this were seen, however, in Bongololo and Mbila, where abundant nonfarm income opportunities increased the household incomes of non-tobacco growing households (see next section). Fourth, tobacco-growing households applied more fertilizer on maize and achieved higher productivity (yield per hectare and yield per AEU). This probably stems from the fact that higher income from tobacco production enables farmers to purchase productivity-enhancing inputs, such as fertilizer.
These findings suggest that the opportunity for high income from tobacco production is available only to households that possess sufficient capital, land and labor, while those that do not have been excluded from the economic opportunities created with the introduction of burley tobacco production in the early 1990s. But even for those who have managed to venture into tobacco production, it is still a risky business. High production costs may be compensated with a high income when weather and prices are favorable, but unfavorable conditions may result in large losses. For poorer households, tobacco production is an extravagant gamble beyond their means.
6. OFF-FARM INCOME
Off-farm income can be classified into four categories — agricultural wage income, nonagricultural wage income, nonfarm self-employment income, and other income. Agricultural wage income can be earned by working on somebody's farm as a laborer. In the study villages, 44% of the sample households earned agricultural wage income by engaging in contracted casual labor, in which they were remunerated for performing specific farm tasks. As is shown in Table 8, land preparation and weeding/banking were the two main tasks. The average daily income from agricultural wage labor was less than that from other off-farm activities. In addition, the demand for agricultural labor rises only during the peak agricultural season. Therefore, the income smoothening throughout a year cannot be achieved by engaging only in agricultural wage labor. As a result, agricultural wage income accounted for only 5% of overall household income among sample households (Table 9). Moreover, the demand for agricultural wage labor may markedly decrease due to unfavorable weather and resultant crop failure. On the other hand, the peak demand for agricultural wage labor coincides with the period when many households have exhausted their maize stocks. Despite its low and unreliable remuneration, therefore, agricultural wage income constitutes an important strategy to overcome lean periods (Whiteside, 2000).
Non-agricultural wage income can be either on casual or regular basis. Typical non-agricultural wage income includes daily wages from unskilled physical labor, such as construction work. Regular wage income can be earned from skilled jobs, such as a schoolteacher, or unskilled jobs, such as a night watchman. As Table 8 shows, non-agricultural wage income was far less common than agricultural wage labor. Only 13% of the sample households earned non-agricultural wage income, while 44% earned agricultural wage income. Although opportunities for non-agricultural wage labor were limited, daily wages tended to be higher than agricultural wages. Moreover, non-agricultural wage income becomes much higher if one is employed on regular basis. As a result, despite the small number of cases, the contribution of non-agricultural wage income to household income (15%) was much higher than that of agricultural wage income.
Nonfarm self-employment income accounted for the largest share (34%) of total household income. More than half (53%) of the sample households engaged in nonfarm
self-employment. Although activities varied markedly, most were small businesses requiring little startup or working capital. The most common nonfarm self-employment was brewing and selling beer, which was performed mostly by women. Relatively profitable activities included shop ownership, tobacco trading, fish trading, prepared food sales, and brewing/selling beer. Most cases were very small scale, but year-round engagement frequently resulted in high incomes.
7. DIVERSITY AND DISPARITY AMONG SMALLHOLDER HOUSEHOLDS
(a) Income sources
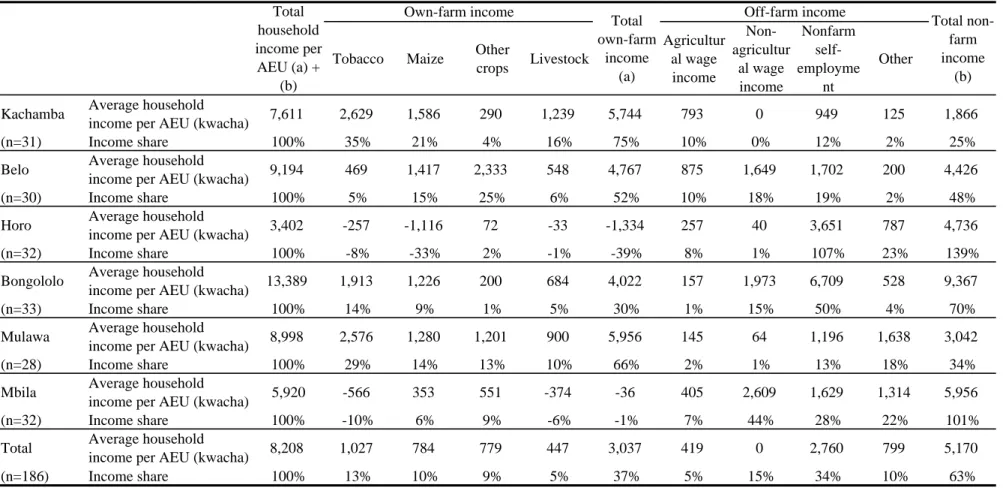
This section examines the overall pattern of income portfolios and economic strategies adopted by smallholder households. Several key points are revealed in Table 9, which presents the average household income per AEU by income source and village. First, the share of own-farm income (37%) is lower than that of off-farm income (63%). This proportion contrasts with the earlier report of a “50:50 split between own-farm income and off-farm or nonfarm income” in the Dedza District in the 2000/01 season (Ellis et al., 2003: p.1504), and a similar ratio reported in the Blantyre Shire Highlands in 1990 (Orr and Mwale, 2001: p.1334). The low proportion of own-farm income found in this study may partly be explained by the crop failures in Horo and Mbila in 2004/05. In any case, de-agrarianization (Bryceson and Jamal, 1997) and the increasing share of nonfarm income (Readon, 1997) highlighted in the literature were found in rural Malawi.
Second, the proportion of own-farm and off-farm income greatly varied across study villages. In Horo and Mbila, households experienced negative own-farm income due to crop failure caused by erratic rains in the 2004/05 season. In Kachamba and Belo, where the survey was conducted in the climatically normal year of 2003/04, more than half of household income was derived from own-farm production. Households in Mulawa enjoyed high income from own-farm production despite unfavorable weather in 2004/05. The high proportion of income from own-farm production in Mulawa (66%) can be explained by two factors. The first is the relative remoteness of the village, which limits opportunities for off-farm activities. The second is the widely practiced cultivation of dimba (dry season gardens in wetlands), which generate additional income. In contrast, households in Bongololo earned 70% of their income from off-farm activities. This is attributed to the wide variety of income-earning opportunities due to
the village’s proximity to town. Thus, the income composition of rural households varies considerably from village to village, depending on diverse factors such as weather, proximity to town, availability of off-farm income sources, and types of economic activities conducted by household members. An oversimplification of household income portfolios would conceal these important differences and the variations in rural livelihoods in Malawi.
Third, off-farm income appeared to be particularly important in the context of uncertainty and risk associated with agricultural production in Malawi. Given that smallholder agriculture is rain-fed, rural households are likely to face sharp drops in own-farm income in bad-weather years, as seen in Horo and Mbila in 2004/05. Households that rely solely on own-farm income are vulnerable to the risk of food insecurity. Engaging in off-farm economic activities can reduce the household vulnerability by securing other income sources when own-farm production fails.. In fact, although households in Horo and Mbila experienced losses in own-farm income, they did not experience a net loss in total household income thanks to off-farm income. Thus, securing off-farm income is an important livelihood strategy both as an ex-ante risk management strategy and as an ex-post coping strategy.
Off-farm income is not available to every household, and even when it is available, the level of income may be far below what is needed to compensate drops in own-farm income. The most accessible off-farm activity for rural households is agricultural wage labor, but wage levels are low, job opportunities are restricted to farming seasons, and the demand for labor is prone to covariate risk of crop failure. Some nonfarm self-employment offer relatively high income, but the opportunities are less open to households residing in remote villages. Full-time nonfarm employment is only available to those residing near towns (night watchmen, low-rank civil servants, etc.) or those with higher education (teachers). In the absence of overall development in the non-agricultural sector and limited opportunities for remunerative income from the nonfarm sector, the smallholder strategy of diversification into nonfarm activities at best can only partially help to secure livelihoods.
(b) Income disparities and livelihood strategies
To examine the variability of household incomes, tables in the appendix present the levels of household income by ranking all sample households in each study village according to income per AEU, and dividing them into four equal groups. The tables
clearly show the wide disparities between the mean per AEU income of the top quartile and that of the bottom quartile.
The livelihood strategies that achieved high income can be classified into three types. The first is the concentration on own-farm production. Households adopting this strategy included those in the upper quartiles of Kachamba, Belo, and Mulawa. These households derived the majority of their incomes from own-farming, and their farm sizes were larger than those in other quartiles. In addition, those in the upper quartile in Kachamba and Mulawa enjoyed high land productivity (Table 10). In the case of Mulawa, income from dimba greatly contributed to high income from own-farm production. Without taking the pathway of de-agrarianization, these households succeeded in advancing their economic status through own-farming.
The second type of strategy that achieved high incomes was the combination of regular salaried jobs and own-farm production. This pattern included seven households in the top quartiles in Belo and Mbila, whose household members were schoolteachers, night watchmen, and low-ranking civil servants. In these households, male heads earned regular salaries while other household members engaged in own-farm production. Because the households had regular income, they were able to purchase productivity-enhancing inputs such as fertilizer for own-farm production. When agricultural production failed due to unfavorable weather, regular salaried income compensated own-farm income, thereby raising household food security while reducing vulnerability to unforeseen variables. However, this type of livelihood strategy was adopted by only a fortunate few. Households engaged in regular salaried jobs accounted for only 6% of the sample, and all but three teachers in Belo were in the two villages (Bongololo and Mbila) that are close to towns. Thus, this strategy was not an option for the majority of rural households.
The third type of livelihood strategy was the combination of own-farm production and high-return nonfarm self-employment. The strategy was adopted by the households in the top quartiles of Horo and Bongololo. In these households, high-return nonfarm self-employment, such as tobacco trading in Horo and beer brewing in Bongololo, improved overall household income. These high-return opportunities were made possible by situations unique to each village. In Horo, its proximity to Mozambique and the existence of informal tobacco trading in the local weekly market enabled some households to engage in profitable trading. In Bongololo, its proximity to town created a year-round demand for local beer, making beer brewing a semi-regular source of
income. Again, these opportunities were village-specific and not always duplicable in other rural areas.
These three types of livelihood strategies were adopted by a minority of households who had the necessary assets (land or education) or access to high-return nonfarm employment. The majority of rural households, however, had no choice but to combine available (low-return) work, usually resulting in low total household incomes. The poorer households typically combine own-farm production, agricultural wage labor, and nonfarm self-employment. Since land productivity in the lower quartiles was much lower than that in the upper quartiles (Table 10), own-farm income was typically low, or often negative (Appendix). To compensate low own-farm income, they engaged in low-return agricultural wage labor and nonfarm self employment, such as very-small-scale trading, but income from these activities only marginally increased total income. While the income diversification strategy adopted by poorer households did provide a means of survival, it did little to enable them to climb the ladder of upward mobility and improve their overall economic situations.
8. CONCLUSION
This paper has analyzed the livelihoods of smallholder households across different locations of rural Malawi. The findings of the study can be summarized as follows. The government's liberalization policies after the 1980s dramatically reduced state control of smallholder production. For farmers with sufficient land, labor and capital, liberalization opened up opportunities for high-return agricultural produce, such as tobacco. In the study villages, some villagers in the top income quartile achieved high household income by investing in high-return crops and productivity-enhancing inputs (fertilizer). On the other hand, the high risks of production failure and falling prices, as well as the high cost of inputs, made agriculture a risky business. As a result, large disparities existed between those who achieved high income from crop production and those who did not. For farmers with limited resources, "gambling" in agriculture by using expensive inputs was beyond their means. Resource-poor smallholders had no choice but to resort to low-input agriculture on their small landholdings and to compensate the resultant low own-farm income with poorly remunerated off-farm employment.
markedly. For example, the importance of own-farm production in overall household livelihood strategies varied between study villages. Although every sample household had its own farm to cultivate, income from own-farm production differed considerably among villages due to many factors, such as weather, opportunities for dimba cultivation, availability of farm inputs, and population pressure on land. In addition, own-farm income varied markedly among the households within a village, influenced by the degree of access to land, availability of family labor, and disparities in farm productivity due to factors such as the level of fertilizer application.
The level and role of off-farm income also varied. Proximity to towns leads to increases in opportunities for nonfarm employment and levels of remuneration. In the drought-hit villages, off-farm income plays an important role in providing ex-post coping strategies for households. Marked disparities in income levels exist between full-time, well-remunerated jobs and poorly paid, casual labor. Regular-salaried jobs, however, are few in number and characterized by entry barriers, such as educational requirements. Off-farm jobs with low entry barriers are often characterized by low wages and ad-hoc hiring, such as agricultural wage labor.
In response to the high risks of agricultural production, many households diversified their activities to secure multiple sources of income. The diversification of income sources has the potential to increase total household income or reduce vulnerability to the risks of crop failure. In the six study villages, a minority of households did actually earn high income from off-farm activities, and also increased their agricultural productivity by reinvesting their off-farm income in own-farm production. But off-farm employment available to the majority of households offered only low-level remuneration and thus only marginal improvements in household economic status; it was inadequate to compensate for low (sometimes negative) own-farm income. Overall, the strategy of livelihood diversification in response to the high risks of agriculture has been only partially successful, and rarely provided opportunities for an escape from poverty.
REFERENCES
Alwang, J. and Siegel, P. B. (1999). Labor Shortages on Small Landholdings in Malawi: Implications for Policy Reforms. World Development, 27(8), 1461-1475.
Household Livelihood Strategies in Rural Africa: Concepts, Dynamics, and Policy Implications. Food Policy, 26(4), 315-331.
Barrett, C. B., Bezuneh, M., Clay, D. C. and Readon, T. (2005). Heterogeneous Constraints, Incentives and Income Diversification Strategies in Rural Africa.
Quarterly Journal of International Agriculture, 44(1), 37-60.
Bryceson, D. F. (2006) Ganyu Casual Labour, Famine and HIV/AIDS in Rural Malawi: Causality and Casualty. Journal of Modern African Studies, 44(2), 173-202. Bryceson, D. F. and Jamal, V. (eds.) (1997). Farewell to Farms: De-agrarianisation and
Employment in Africa, Hampshire: Ashgate
Carney, D. (1998) Implementing the Sustainable Rural Livelihoods Approach. D. Carney. ed., Sustainable Rural Livelihoods: What Contribution Can We Make? London: Department for International Development.
Chilowa, W. (1998). The Impact of Agricultural Liberalisation on Food Security in Malawi. Food Policy, 23(6), 553-569.
Devereux, S. and Tiba, Z. (2007). Malawi's First Famine, 2001-2002. S. Devereux ed.,
The New Faines: Why Famines Persist in an Era of Globalization, London and
New York: Routledge.
van Donge, J. K. (2002). Disordering the Market: The Liberalisation of Burley Tobacco in Malawi in the 1990s. Journal of Southern African Studies, 28(1), 89-115. Ellis, F. (2000). Rural Livelihoods and Diversity in Developing Countries. Oxford:
Oxford University Press.
Ellis, F., Kutengule, M. and Nyasulu, A. (2003). Livelihoods and Rural Poverty Reduction in Malawi. World Development, 31(9), 1495-1510.
Ellis, F. and Freeman. H. A. (eds.) (2005). Rural Livelihoods and Poverty Reduction
Policies, London and New York: Routledge.
Government of Malawi (Various Issues a) Economic Report, Lilongwe: Ministry of Economic Planning and Development.
Government of Malawi (Various Issues b) Statistical Yearbook, Zomba: National Statistical Office.
Gladwin, C. H., Thomson, A. M., Peterson, J. S. and Anderson, A. S. (2001) Addressing Food Security in Africa via Multiple Livelihood Strategies of Women Farmers.
Food Policy, 26(4), 177-207.
Harrigan, J. (2003). U-Turns and Full Circles: Two Decades of Agricultural Reform in Malawi 1981-2000. World Development, 31(5), 847-863.
Hazarika, G. and Alwang, J. (2003). Access to Credit, Plot Size and Cost Inefficiency among Smallholder Tobacco Cultivators in Malawi. Agricultural Economics, 29(1), 99-109.
Jaffee, S. (2003). Malawi's Tobacco Sector: Standing on One Strong Leg is Better than on None. The World Bank Africa Region Working Paper No.55, Washington, D. C.: The World Bank.
Jones, R. B. and Heisey, P. W. (1994). An Agronomic and Economic Analysis of the Results from the MOA/UNDP/FAP Fertilizer Program 1989-1993. Lilongwe: The Rockefeller Foundation.
Kydd, J. and Christiansen, R. (1982). Structural Change in Malawi since Independence: Consequences of a Development Strategy Based on Large-scale Agriculture.
World Development, 10(5), 355-375.
Langyintuo, A. (2004). Malawi Maize Sector Stakeholders Workshop Report. Harare: CIMMYT-Zimbabwe.
McCracken, J. (1983). Planters, Peasants and the Colonial State: the Impact of the Native Tobacco Board in the Central Province of Malawi. Journal of Southern African Studies, 9(2), 172-192.
Mvula, P. M., Chirwa, E. W. and Kadzandira, J. (2003). Poverty and Social Impact Assessment in Malawi: Closure of ADMARC Markets. Report prepared for the World Bank.
Orr, A. (2000). ‘Green Gold’?: Burley Tobacco, Smallholder Agriculture, and Poverty Alleviation in Malawi. World Development, 28(2), 347-363.
Orr, A. and Mwale, B. (2001). Adapting to Adjustment: Smallholder Livelihood Strategies in Southern Malawi. World Development, 29(8), 1325-1343.
Peters, P. E. (2006). Rural Income and Poverty in a Time of Radical Change in Malawi. Journal of Development Studies, 42(2), 322-345.
Reardon, T. (1997). Using Evidence of Household Income Diversification to Inform Study of the Rural Nonfarm Labor Market in Africa. World Development, 25(5), 735-747.
Readon, T. and Taylor, J. E. (1996). Agroclimatic Shock, Income Inequality, and Poverty: Evidence from Burkina Faso. World Development, 24(5), 901-914.
Scoones, I. (1998). Sustainable Rural Livelihoods: A Framework for Analysis. IDS Working Paper No.72, Brighton: Institute of Development Studies.
Livestock and Livelihoods in Mali, Ethiopia and Zimbabwe, Oxford and
Portsmouth: James Currey and Heinemann.
Smale, M. (1995). "Maize if Life": Malawi's Delayed Green Revolution. World
Development, 23(5), 819-831.
Smale, M. and Phiri, A. (1998). Institutional Change and Discontinuities in Farmers' Use of Hybrid Maize Seed and Fertilizer in Malawi: Findings from the 1996-97 CIMMYT/MoALD Survey. CIMMYT (Economics Working Paper 98-01).
Vaughan, M. (1987). The Story of an African famine: Gender and Famine in
Twentieth-century Malawi, Cambridge: Cambridge University Press.
Whiteside, M. (2000). Ganyu Labour in Malawi and its Implications for Livelihood Security Interventions: An Analysis of Recent Literature and Implications for Poverty Alleviation. Agricultural Research and Extension Network Paper No.99, London: Overseas Development Institute.
World Bank (2006) World Development Indicators 2006, Washington, D. C.: The World Bank.
Zeller, M., Diagne, A., and Mataya, C. (1998). Market Access by Smallholder Farmers in Malawi: Implications for Technology Adoption, Agricultural Productivity and Crop Income. Agricultural Economics, (19), 219-229.
NOTES i
In this paper, "farm income" refers to income generated from own-account farming (crop and livestock), while "off-farm income" refers to income from all non-own-account farming sources including agricultural wage income, non-farm wage or salary employment, rental income, and transfers and remittances.
ii
Zeller et al. (1998), Peters (2006) and Orr (2000) are exceptions, though their analyses are based on data obtained in the 1990s.
iii
Notable exceptions are Barrett et al. (2001) and Barrett et al. (2005).
iv
The quota system was later abandoned in favor of full liberalization in 1996/1997.
v
The figures are calculated with the data derived from the Government of Malawi (various issues a; various issues b).
vi
One household was not available for interview at the time of the survey.
vii
Agricultural season in Malawi is from October to September.
viii
The figure is sited by Alwang and Siegel (1999: p.1461) and Gladwin et al. (2001: p.181). Other writers site different figures such as 155 kilograms (Bryceson 2006: p.189) and 165 kilograms (Devereux and Tiba, 2007: p.173, citing FAO).
ix
Exchange rates in 2005 were between 115 and 121 Malawi kwacha (MK) per US dollar. The cost is calculated using the price in Bongololo in 2005.
Figure 1: Study Locations
Bongololo Mzuzu Mulawa Mbila Kachamba Lilongwe Belo Horo Blantyre Study Location Major CityTable 1. Summary of study villages and samples
Study Village Kachamba Belo Horo Bongololo Mulawa Mbila Total Administrative Region Central Central Southern Northern Northern Central -Total Number of Households 31 115 78 69 29 76 398 Number of Sample Households 31 30 32 33 28 32 186 Of Which: Tobacco-growing 23 15 16 27 19 16 116
Non-Tobacco-growing 8 15 16 6 9 16 70
Average Farm Size per Household 0.98 1.76 0.58 0.80 1.18 0.94 1.03 Distance to Trading Centers (km) 38 42 15 1 20 5 -Dominant Ethnic Group Chewa Mixed Lomwe Tumbuka Ngoni Chewa -Availability of Nonfarm Income
Opportunities Few Few Few Many Few Many
-Impact of drought in 2004/05 - - Strong Weak Weak Strong
-Source: Author's survey.
Table 2. Average and distribution of household maize production per AEU* by study village
Kachamba Belo Horo Bongololo Mulawa Mbila Total Average production (kg/AEU) 260 182 64 206 228 109 175
< 50kg 6% 7% 69% 15% 21% 47% 28% 50-100kg 23% 27% 13% 18% 21% 13% 19% 100-150kg 13% 17% 9% 15% 11% 13% 13% 150-200kg 6% 3% 6% 6% 0% 6% 5% 200-250kg 10% 3% 0% 6% 11% 3% 5% > 250kg 42% 43% 3% 39% 36% 19% 30%
* Adult Equivalent Unit (AEU) : male 15 years or older = 1; female 15 years or older = 0.8; male or female 14 years or under = 0.5. Source: Author's survey.
Table 3. Production cost structure of maize (kwacha per hectare)
Number of Sample Households
Average Area of Maize Farm (ha/Household) Fertilizer Application per ha (kg/ha) Production per ha (kg/ha)
% kwacha % kwacha % kwacha % kwacha % kwacha % kwacha % kwacha
Gross Revenue from Maize (1) 14,943 5,541 5,292 18,040 16,106 9,234 10,819
Input Cost (2) 100% 7,358 100% 2,468 100% 10,204 100% 11,395 100% 9,805 100% 7,110 100% 7,184
Seeds 13% 941 22% 552 6% 591 11% 1,294 12% 1,146 9% 628 11% 818
Fertilizer 35% 2,573 23% 572 62% 6,296 38% 4,357 62% 6,112 70% 4,968 50% 3,582
Manure 1% 55 4% 89 4% 395 0% 0 0% 0 4% 283 2% 125
Annual depreciation and maintenance of
tools, oxcarts, and oxen 18% 1,307 12% 288 4% 384 14% 1,645 9% 856 8% 582 11% 775
Hired transport/machinery 4% 319 4% 88 1% 113 1% 100 5% 468 1% 54 2% 179
Hired labor 28% 2,097 36% 879 21% 2,177 29% 3,311 12% 1,222 8% 544 22% 1,561
Land rent 1% 66 0% 0 2% 211 3% 372 0% 0 0% 0 1% 87
Interest payment 0% 0 0% 8 0% 38 3% 317 0% 0 1% 50 1% 58
Net Crop Income, (1) minus (2) 7,585 3,074 -4,912 6,645 6,301 2,124 3,635
(Note) Figures for Kachamba and Belo were converted to 2004/05 prices using rural CPI. Exchange rates in 2005 were between 115 and 121 Malawi kwacha (MK) per US dollar. Source: Author's survey.
71 15 90 77 1,093 485 331 1,503 Kachamba Belo 0.44 32 1.11 30 0.60 31 Horo Bongololo 0.49 33 Mulawa Mbila 28 32 732 1,326 0.61 0.56 123 105 Total 186 0.63 863 71
Table 4. Production cost structure of tobacco by village (kwacha/ha)
Number of Samples
Average Area of Tobacco Farm (ha/household) Production per hectare (kg)
% kwacha % kwacha % kwacha % kwacha % kwacha % kwacha % kwacha Gross Revenue from Tobacco 83,760 54,689 17,596 88,033 76,430 20,004 62,101
Input Costs 100% 48,382 100% 48,283 100% 21,853 100% 70,443 100% 45,704 100% 29,685 100% 47,786
Seeds 1% 645 2% 762 4% 978 1% 737 0% 192 1% 263 1% 569
Fertilizer 22% 10,570 32% 15,225 45% 9,863 42% 29,732 58% 26,288 57% 16,857 41% 19,582
Other chemicals 1% 374 2% 797 3% 751 1% 425 0% 36 0% 0 1% 370
Manure 6% 2,904 1% 600 3% 630 0% 0 0% 0 0% 0 1% 635
Materials for barn and sacks 25% 11,964 11% 5,142 8% 1,652 7% 5,074 11% 5,015 11% 3,174 12% 5,623
Annual depreciation and maintenance of
tools, oxcarts, and oxen 3% 1,644 1% 359 2% 514 2% 1,675 2% 821 2% 592 2% 1,004
Club fees 1% 531 0% 0 0% 66 1% 930 2% 965 1% 192 1% 505
Hired transport/machinery 7% 3,294 9% 4,114 3% 700 3% 2,046 3% 1,313 6% 1,750 5% 2,361
Hired labor 34% 16,158 43% 20,983 23% 5,058 33% 23,280 19% 8,837 22% 6,485 31% 14,954
Land rent 0% 5 0% 0 1% 149 1% 374 0% 0 1% 214 0% 135
Interest payment 1% 293 1% 301 7% 1,492 9% 6,169 5% 2,238 1% 157 4% 2,047
Net Crop Income 35,378 6,406 -4,257 17,590 30,725 -9,680 14,315
(Note) Figures for Kachamba and Belo were converted to 2004/05 prices using rural CPI. Exchange rates in 2005 were between 115 and 121 Malawi kwacha (MK) per US dollar. Source: Author's survey.
607 864 281 1,178 853 319 0.365 0.439 Mulawa Mbila 19 16 27 Kachamba Belo 0.189 16 0.506 749 15 0.289 Total 116 0.350 23 Horo Bongololo 0.347
Table 5. Average auction price of burley tobacco Table 6. Tobacco-growing households across size distribution of farm
Average Price Area Range ofTotal Farm* Kachamba Belo Horo Bongololo Mulawa Mbila Total
(US cents/kg) < 0.5 ha 38% 0% 50% 56% 13% 0% 34%
1994 128.62 0.5 - 1.0 ha 88% 0% 42% 93% 75% 62% 63%
1995 148.18 1.0 -1.5 ha 100% 63% 50% 80% 88% 63% 76%
1996 161.30 > 1.5 ha 100% 67% 100% 100% 100% 75% 84%
1997 152.95
1998 129.65 * Including rented land.
1999 138.06 Source: Author's survey.
2000 101.93 2001 109.77 2002 111.40 2003 113.68 2004 109.02 2005 98.89
Source: Tobacco Control Commission Year
Table 7. Comparison of tobacco-growing and non-growing households Tobacco-growing Households Non-growing Households Tobacco-growing Households Non-growing Households Tobacco-growing Households Non-growing Households Tobacco-growing Households Non-growing Households Tobacco-growing Households Non-growing Households Tobacco-growing Households Non-growing Households Tobacco-growing Households Non-growing Households Number of samples 23 8 15 15 16 16 27 6 19 9 16 16 116 70 Income
Average household income per adult equivalent unit (kwacha)
8,669 4,570 15,341** 6,039** 3,938 2,264 12,775 18,878 9,595 7,445 4,774 6,934 9,449* 6,494* Assets Land holding (ha perhousehold) 0.972*** 0.513*** 2.013 1.180 0.650 0.421 0.746 0.514 1.238*** 0.431*** 1.090 0.974 1.069*** 0.730***
Value of livestock owned 5,079 9 8,117* 1,839* 8,117 1,839 34,337 3,642 21,142 30,156 14,083 2,100 15,642* 7,241* Number of household
members 15 years old or over 2.0 1.8 2.3* 1.8* 2.1 1.6 2.8 2.0 2.7* 1.7* 2.9 2.5 2.5*** 1.9*** Schooling years of household
head 4.7*** 1.1*** 3.6 3.6 4.6 3.8 8.0 6.7 5.7 4.3 5.3 4.6 5.6*** 4.0*** Agriculture Average area farmed (ha) 1.143*** 0.513*** 2.162 1.361 0.675 0.485 0.852 0.557 1.522*** 0.455*** 1.118* 0.760* 1.201*** 0.741***
Maize production per hectare
(kg) 1,086 686 684 491 482*** 151*** 1,604 1,151 1,298 1,072 908 771 1,081*** 631*** Maize production per AEU
(kg) 439 422 271 174 103* 25* 218 287 264 144 134 124 249** 163** Fertilizer application on
maize farm (kg/ha) 80*** 8*** 33 9 124 83 93 122 126 104 148 89 100** 66** Net agricultural income per
hectare (kwacha) 10,675 6,216 9,404 6,682 -3,773 -4,979 18,986 -2,512 16,275 14,258 -3,982 2,415 9,348 3,174 (Note) Figures for Kachamba and Belo were converted to 2004/05 prices using rural CPI.
Exchange rates in 2005 were between 115 and 121 Malawi kwacha (MK) per US dollar.
* indicates 10% significance level, ** indicates 5% significance level, and *** indicates 1% significance level with t-test. Source: Author's survey.
Mulawa Mbila Total Kachamba Belo Horo Bongololo
Table 8. Average daily wages for wage labor by type of employment (six villages)
Type Work Numberof cases Average wage perday (kwacha)
Agricultural wage labor Land preparation 63 119
Weeding/banking 85 109
Harvesting 7 194
Grading/baling of tobacco 5 178
Others 11 187
Non-agricultural wage labor Teacher/civil servant 7 223
(regular basis) Night watchman, private
company, waitress 5 127
Non-agricultural wage labor Construction work 6 235
(casual basis) Others 6 257
Notes: Total number of cases may not equate to numbers of households,
because household members may engage in different activities on different occasions. Average daily wage is wages paid (both cash and in kind) divided by days worked. Figures for Kachamba and Belo were converted to 2004/05 prices using rural CPI. Exchange rates in 2005 were between 115 and 121 Malawi kwacha (MK) per US dollar. Source: Author's survey.
Table 9. Household income per adult equivalent unit by source and village (weighted average)
Tobacco Maize Other
crops Livestock Agricultur al wage income Non-agricultur al wage income Nonfarm self-employme nt Other
Kachamba Average household
income per AEU (kwacha) 7,611 2,629 1,586 290 1,239 5,744 793 0 949 125 1,866 (n=31) Income share 100% 35% 21% 4% 16% 75% 10% 0% 12% 2% 25% Belo Average household
income per AEU (kwacha) 9,194 469 1,417 2,333 548 4,767 875 1,649 1,702 200 4,426 (n=30) Income share 100% 5% 15% 25% 6% 52% 10% 18% 19% 2% 48% Horo Average household
income per AEU (kwacha) 3,402 -257 -1,116 72 -33 -1,334 257 40 3,651 787 4,736 (n=32) Income share 100% -8% -33% 2% -1% -39% 8% 1% 107% 23% 139% Bongololo Average household
income per AEU (kwacha) 13,389 1,913 1,226 200 684 4,022 157 1,973 6,709 528 9,367 (n=33) Income share 100% 14% 9% 1% 5% 30% 1% 15% 50% 4% 70% Mulawa Average household
income per AEU (kwacha) 8,998 2,576 1,280 1,201 900 5,956 145 64 1,196 1,638 3,042 (n=28) Income share 100% 29% 14% 13% 10% 66% 2% 1% 13% 18% 34% Mbila Average household
income per AEU (kwacha) 5,920 -566 353 551 -374 -36 405 2,609 1,629 1,314 5,956 (n=32) Income share 100% -10% 6% 9% -6% -1% 7% 44% 28% 22% 101% Total Average household
income per AEU (kwacha) 8,208 1,027 784 779 447 3,037 419 0 2,760 799 5,170 (n=186) Income share 100% 13% 10% 9% 5% 37% 5% 15% 34% 10% 63%
(Note) Figures for Kachamba and Belo were converted to 2004/05 prices using rural CPI. Exchange rates in 2005 were between 115 and 121 Malawi kwacha (MK) per US dollar.
Adult Equivalent Unit (AEU) : male 15 years or older = 1; female 15 years or older = 0.8; male or female 14 years or under = 0.5. Own-farm income refers to gross revenue from products minus inputs purchased for production.
Hired labor is treated as a purchased input, but family labor is not costed in the calculation.
Subsistence consumption of crops and livestock products is valued at average farm gate prices of each village. Source: Author's survey.
Total non-farm income (b) Total household income per AEU (a) + (b) Off-farm income Own-farm income Total own-farm income (a)
Table 10. Own-farm income per hectare by income quartile (kwacha/ha)
Kachamba Belo Horo Bongololo Mulawa Mbila Total
n=31 n=30 n=32 n=33 n=28 n=32 n=186
Quartile 1 (richest) 33,760 7,847 -7,941 29,353 22,010 2,956 15,101
Quartile 2 9,312 8,467 2,050 10,786 27,429 6,114 10,355
Quartile 3 9,437 10,938 -1,503 26,596 8,165 -3,809 9,268
Quartile 4 -12,861 3,110 -6,445 -731 5,531 -7,102 -1,093
(Note) Figures for Kachamba and Belo were converted to 2004/05 prices using rural CPI. Exchange rates in 2005 were between 115 and 121 Malawi kwacha (MK) per US dollar. Source: Author's survey.
Appendix: Income portfolios by income quartile Six village totals
Income
quartile Tobacco Maize
Other crops Livestock Agricultur al wage income Non-agricultur al wage income Nonfarm self-employme nt Other
Quartile 1 Household income per AEU (kwacha) 20,851 3,341 783 1,729 1,631 7,484 178 3,442 7,959 1,788 13,368 1.351
(n=45) Share 100% 16% 4% 8% 8% 36% 1% 17% 38% 9% 64%
Quartile 2 Household income per AEU (kwacha) 8,561 943 1,158 979 402 3,481 855 1,319 2,252 654 5,079 0.989
(n=46) Share 100% 11% 14% 11% 5% 41% 10% 15% 26% 8% 59%
Quartile 3 Household income per AEU (kwacha) 4,228 793 893 288 301 2,275 271 306 911 465 1,953 0.793
(n=47) Share 100% 19% 21% 7% 7% 54% 6% 7% 22% 11% 46%
Quartile 4 Household income per AEU (kwacha) 331 -248 124 107 -150 -167 128 17 198 155 498 0.992
(n=48) Share 100% -75% 37% 32% -45% -50% 39% 5% 60% 47% 150%
Total Household income per AEU (kwacha) 8,316 1,082 796 786 472 3,136 407 1,217 2,761 795 5,180 1.028
(n=186) Share 100% 13% 10% 9% 6% 38% 5% 15% 33% 10% 62%
Kachamba
Income
quartile Tobacco Maize
Other crops Livestock Agricultur al wage income Non-agricultur al wage income Nonfarm self-employme nt Other
Quartile 1 Household income per AEU (kwacha) 21,064 11,136 3,304 835 4,777 20,053 397 0 569 45 1,011 1.948
(n=7) Share 100% 53% 16% 4% 23% 95% 2% 0% 3% 0% 5%
Quartile 2 Household income per AEU (kwacha) 8,690 1,453 1,326 237 -8 3,008 2,683 0 2,421 578 5,682 0.708
(n=8) Share 100% 17% 15% 3% 0% 35% 31% 0% 28% 7% 65%
Quartile 3 Household income per AEU (kwacha) 4,263 424 2,192 273 188 3,076 468 0 719 0 1,186 0.801
(n=8) Share 100% 10% 51% 6% 4% 72% 11% 0% 17% 0% 28%
Quartile 4 Household income per AEU (kwacha) -1,891 -2,595 -59 -131 -110 -2,895 271 0 732 0 1,003 0.586
(n=8) Share -100% -137% -3% -7% -6% -153% 14% 0% 39% 0% 53%
Total Household income per AEU (kwacha) 7,611 2,633 1,577 291 1,241 5,742 794 0 950 125 1,869 0.98
(n=31) Share 100% 35% 21% 4% 16% 75% 10% 0% 12% 2% 25% Farm size (ha/house hold) Farm size (ha/house hold) Own-farm income Total own-farm income (a) Total non-farm income (b) Total non-farm income (b) Own-farm income Total own-farm income (a) Total household income per AEU (a) + (b) Total household income per AEU (a) + (b) Off-farm income Off-farm income
Belo
Income
quartile Tobacco Maize
Other crops Livestock Agricultur al wage income Non-agricultur al wage income Nonfarm self-employme nt Other
Quartile 1 Household income per AEU (kwacha) 26,300 -3,350 1,463 8,437 1,784 8,334 135 13,451 3,726 655 17,966 1.927
(n=7) Share 100% -13% 6% 32% 7% 32% 1% 51% 14% 2% 68%
Quartile 2 Household income per AEU (kwacha) 10,927 700 1,858 2,733 997 6,288 1,463 0 2,990 187 4,639 2.591
(n=7) Share 100% 6% 17% 25% 9% 58% 13% 0% 27% 2% 42%
Quartile 3 Household income per AEU (kwacha) 5,607 2,819 699 566 153 4,237 190 0 1,180 0 1,371 1.273
(n=8) Share 100% 50% 12% 10% 3% 76% 3% 0% 21% 0% 24%
Quartile 4 Household income per AEU (kwacha) 1,908 0 897 746 -133 1,510 293 0 105 0 398 1.381
(n=8) Share 100% 0% 47% 39% -7% 79% 15% 0% 6% 0% 21%
Total Household income per AEU (kwacha) 10,690 657 1,387 2,779 648 5,470 663 2,307 2,076 174 5,220 1.762
(n=30) Share 100% 6% 13% 26% 6% 51% 6% 22% 19% 2% 49%
Horo
Income
quartile Tobacco Maize
Other crops Livestock Agricultur al wage income Non-agricultur al wage income Nonfarm self-employme nt Other
Quartile 1 Household income per AEU (kwacha) 9,721 -1,027 -2,529 165 27 -3,364 129 115 11,216 1,625 13,086 0.912
(n=8) Share 100% -11% -26% 2% 0% -35% 1% 1% 115% 17% 135%
Quartile 2 Household income per AEU (kwacha) 2,401 527 -11 85 -106 496 426 0 823 656 1,905 0.492
(n=8) Share 100% 22% 0% 4% -4% 21% 18% 0% 34% 27% 79%
Quartile 3 Household income per AEU (kwacha) 745 5 -206 -116 73 -244 257 0 97 634 989 0.376
(n=8) Share 100% 1% -28% -16% 10% -33% 35% 0% 13% 85% 133%
Quartile 4 Household income per AEU (kwacha) -966 -292 -1,710 32 -165 -2,134 126 0 470 572 1,168 0.541
(n=8) Share -100% -30% -177% 3% -17% -221% 13% 0% 49% 59% 121%
Total Household income per AEU (kwacha) 2,975 -183 -994 35 -29 -1,171 221 28 3,053 824 4,126 0.58
(n=32) Share 100% -6% -33% 1% -1% -39% 7% 1% 103% 28% 139% Farm size (ha/house hold) Farm size (ha/house hold) Total non-farm income (b) Own-farm income Total own-farm income (a) Own-farm income Total own-farm income (a) Total non-farm income (b) Total household income per AEU (a) + (b) Total household income per AEU (a) + (b) Off-farm income Off-farm income
Bongololo
Income
quartile Tobacco Maize
Other crops Livestock Agricultur al wage income Non-agricultur al wage income Nonfarm self-employme nt Other
Quartile 1 Household income per AEU (kwacha) 33,952 5,327 -22 161 332 5,799 49 531 27,370 204 28,153 0.558
(n=8) Share 100% 16% 0% 0% 1% 17% 0% 2% 81% 1% 83%
Quartile 2 Household income per AEU (kwacha) 14,313 43 1,274 713 984 3,015 339 6,989 3,254 716 11,299 0.834
(n=8) Share 100% 0% 9% 5% 7% 21% 2% 49% 23% 5% 79%
Quartile 3 Household income per AEU (kwacha) 7,132 2,387 2,106 33 1,011 5,537 127 56 926 487 1,596 0.749
(n=8) Share 100% 33% 30% 0% 14% 78% 2% 1% 13% 7% 22%
Quartile 4 Household income per AEU (kwacha) 1,669 -908 589 50 28 -240 402 43 632 832 1,909 1.024
(n=9) Share 100% -54% 35% 3% 2% -14% 24% 3% 38% 50% 114%
Total Household income per AEU (kwacha) 13,885 1,679 1,093 235 621 3,628 246 1,853 7,554 603 10,256 0.798
(n=33) Share 100% 12% 8% 2% 4% 26% 2% 13% 54% 4% 74%
Mulawa
Income
quartile Tobacco Maize
Other crops Livestock Agricultur al wage income Non-agricultur al wage income Nonfarm self-employme nt Other
Quartile 1 Household income per AEU (kwacha) 18,214 5,519 1,024 2,673 2,954 12,170 0 0 3,167 2,877 6,044 1.607
(n=7) Share 100% 30% 6% 15% 16% 67% 0% 0% 17% 16% 33%
Quartile 2 Household income per AEU (kwacha) 9,828 4,060 2,036 1,291 -35 7,353 80 0 943 1,452 2,475 0.784
(n=7) Share 100% 41% 21% 13% 0% 75% 1% 0% 10% 15% 25%
Quartile 3 Household income per AEU (kwacha) 5,370 119 920 619 414 2,072 491 260 684 1,863 3,299 0.756
(n=7) Share 100% 2% 17% 12% 8% 39% 9% 5% 13% 35% 61%
Quartile 4 Household income per AEU (kwacha) 2,203 409 702 274 252 1,638 24 0 144 397 566 1.570
(n=7) Share 100% 19% 32% 12% 11% 74% 1% 0% 7% 18% 26%
Total Household income per AEU (kwacha) 8,904 2,478 1,254 1,209 900 5,840 149 63 1,202 1,650 3,064 1.179
(n=28) Share 100% 28% 14% 14% 10% 66% 2% 1% 14% 19% 34% Farm size (ha/house hold) Farm size (ha/house hold) Own-farm income Total own-farm income (a) Total non-farm income (b) Own-farm income Total non-farm income (b) Off-farm income Off-farm income Total household income per AEU (a) + (b) Total household income per AEU (a) + (b) Total own-farm income (a)
Mbila
Income
quartile Tobacco Maize
Other crops Livestock Agricultur al wage income Non-agricultur al wage income Nonfarm self-employme nt Other
Quartile 1 Household income per AEU (kwacha) 16,233 -670 923 929 -7 1,175 288 8,842 1,503 4,425 15,058 1.336
(n=8) Share 100% -4% 6% 6% 0% 7% 2% 54% 9% 27% 93%
Quartile 2 Household income per AEU (kwacha) 5,661 -276 581 602 326 1,233 583 420 2,838 587 4,428 0.700
(n=8) Share 100% -5% 10% 11% 6% 22% 10% 7% 50% 10% 78%
Quartile 3 Household income per AEU (kwacha) 2,392 -995 -55 353 -35 -731 249 1,182 1,512 180 3,123 0.800
(n=8) Share 100% -42% -2% 15% -1% -31% 10% 49% 63% 8% 131%
Quartile 4 Household income per AEU (kwacha) -870 -470 -45 372 -2,553 -2,696 704 217 764 142 1,826 0.920
(n=8) Share -100% -54% -5% 43% -293% -310% 81% 25% 88% 16% 210%
Total Household income per AEU (kwacha) 5,854 -606 341 541 -373 -97 409 2,612 1,645 1,284 5,951 0.939
(n=32) Share 100% -10% 6% 9% -6% -2% 7% 45% 28% 22% 102%
(Note) The table shows unweighted average. Figures in Kachamba and Belo were converted to the 2004/05 price using rural CPI. Exchange rates in 2005 were between 115 and 121 Malawi kwacha (MK) per US dollar.
Adult Equivalent Unit (AEU) : male 15 years or older = 1; female 15 years or older = 0.8; male or female 14 years or under = 0.5. Own-farm income refers to gross revenue from products minus inputs purchased for production.
Hired labor is treated as a purchased input, but family labor is not costed in the calculation.
Subsistence consumption of crops and livestock products is valued at average farm gate prices of each village.
Income quartiles were obtained by ranking all sample households in each study village according to income per adult equivalent unit (AEU), and dividing them into four equal groups.
Source: Author's survey.
Farm size (ha/house hold) Own-farm income Total own-farm income (a) Total non-farm income (b) Off-farm income Total household income per AEU (a) + (b)