Outward FDI from and intraregional FDI in
ASEAN : trends and drivers
著者
Hiratsuka Daisuke
権利
Copyrights 日本貿易振興機構(ジェトロ)アジア
経済研究所 / Institute of Developing
Economies, Japan External Trade Organization
(IDE-JETRO) http://www.ide.go.jp
journal or
publication title
IDE Discussion Paper
volume
77
year
2006-11-01
INSTITUTE OF DEVELOPING ECONOMIES
Discussion Papers are preliminary materials circulated to stimulate discussions and critical comments
Keywords: economic integration, FDI JEL classification: F15, F23, O53
* The original paper was presented at the ASEAN-UNCTAD Annual Seminar on Key Issues of FDI: Outward FDI from Asia, organized by United Nations Conference on Trade and Development, and Association of South East Asian Nations, in Chiang Mai, Thailand, on April10, 2006. The author wishes to express thank for ASEAN Secretary and the UNCTAD giving opportunity to study the issue on outward FDI from
developing countries.
**Director General, Development Studies Center, IDE ([email protected])
DISCUSSION PAPER No. 77
Outward FDI from and Intraregional
FDI in ASEAN:
Trends and Drivers
*
Daisuke Hiratsuka**
November 2006
Abstract
Developing-country transnational corporations (TNCs) are increasing in importance in the global economy. Outward FDI from developing countries is a proxy indicator to measure how much of an important role enterprises of developing countries have played in the world market and how they benefit from globalization where border barriers are reduced. This study finds that ASEAN enterprises have extended their business activities within ASEAN, East Asia, and then to the world, as both regional and global players.
The Institute of Developing Economies (IDE) is a semigovernmental, nonpartisan, nonprofit research institute, founded in 1958. The Institute merged with the Japan External Trade Organization (JETRO) on July 1, 1998. The Institute conducts basic and comprehensive studies on economic and related affairs in all developing countries and regions, including Asia, the Middle East, Africa, Latin America, Oceania, and Eastern Europe.
The views expressed in this publication are those of the author(s). Publication does not imply endorsement by the Institute of Developing Economies of any of the views expressed within.
INSTITUTE OF DEVELOPING ECONOMIES (IDE), JETRO 3-2-2, WAKABA,MIHAMA-KU,CHIBA-SHI
CHIBA 261-8545, JAPAN
1. INTRODUCTION
Developing-country transnational corporations (TNCs) are increasing in importance in the global economy. Foreign direct investment (FDI) from developing countries has become remarkable. Particularly, those enterprises from Asia are emerging sources of FDI; in 2004 Asia and Oceania contributed more than four-fifths of outward FDI from developing countries (UNCTAD 2005, pp71). This phenomenon reflects that developing country Asian enterprises have succeeded in global market places, and have elevated their status from domestic market players to become global ones. Among East Asian developing economies, South Korea (Republic of Korea) and Taiwan have been major sources of outward FDI, and in recent years, Chinese firms are extending their production and sales networks to overseas. These facts show that the enterprises of North-East Asian countries are innovative. ASEAN is not an exception to this phenomenon. In particular, Singapore-based enterprises are expanding their business opportunities to the global market. Malaysia follows this trend, increasing its presence remarkably not only in ASEAN but also in the rest of the world. ASEAN country TNCs are expanding their wings beyond their borders; first to neighboring countries of ASEAN and then, to the rest of the world. Advancing abroad, just like Japanese and South Korea enterprises did in the past, many local of these local enterprises become global players.
Whether developing country enterprises can go hand in hand with those of other countries in the process of economic integration is of great concern to us. Outward FDI from developing countries is one of the measures to indicate the performance and capability of developing country enterprises in economic integration where border barriers are eliminated. Reduction of border barriers provides enterprises with the opportunity to reorganize their economic activities on various geographical scales. Developing country enterprises are expected to expand their business to neighboring countries, organizing production and distribution networks on sub-region and region wide scales. This paper aims to study whether ASEAN country enterprises are extending their business activities to overseas markets within a situation of economic integration where ASEAN country markets are being integrated through the ASEAN free trade area (AFTA), and with external countries such as China, Japan, South Korea,
Australia and New Zealand through FTA. Section 2 will discuss why developing country TNCs are increasing remarkable in the context of location theory. “Market-seeking” and “efficiency-seeking” forces of FDI are discussed incorporating the concepts of the home market effect and transport costs (broadly defined)* respectively. Section 3 presents the status quo of outward FDI from ASEAN. Section 4 will give special attention to intra-regional FDI in ASEAN, and show that intra-industry FDIs are growing in ASEAN and that ASEAN country TNCs have spread to the least developed countries (LDC) of Laos, Cambodia, and Myanmar. The last section summarizes this study and argues policy implications.
2. WHAT DETERMINES OUTWARD FDI? 2.1 Transport Costs
What determines outward FDI? FDI is an issue related to the location of industry by firm. Geography and Trade (Krugman, 1991a) gives us an insight into the trade and investment activities of firms. Krugman (1991a) argues that the interaction of market, transport costs, and fixed investment costs determines the location of industry. This hypothesis is supported by a field survey I conducted. I asked the managing director of Soode Johor, a Japanese affiliate, which produces hard drive parts, in Johor, Malaysia, what response he would take to the growing hard disc drive production in Shinzen China. At that time, his major customer, Hitachi Global Storage Technologies, was planning to start hard disc drive production in Shinzen in early 2006 and was requesting its suppliers to come there. He replied to me that, to make a decision to expand into Shinzen or not, he would need to consider the expected market/production size in China, transport costs from Johor to Shenzhen, and the difference in cost between a new fixed investment in Shinzen and an expansion of investment in Johor.
Krugman’s hypothesis regarding the location of industry is based on the gravity framework that economic size (market) and geographical distance (as a proxy of
* Broadly defined transport costs include freight costs as well as border related costs
transport costs) plays a significant role in trade and investment. Geographical distance determines trade and investment through transport costs (broadly defined). As Anderson and Wincoop (2004) defined, transport costs include all costs incurred in getting a good to a final user other than the marginal costs of producing the good itself†. For purposes of estimation based on the gravity model, they divided transport costs into narrowly defined transport costs (both freight costs and shipping time costs), policy barriers (tariff and non-tariff barriers), other border-related barriers such as institutional, language and currency barriers, and domestic distribution costs.
Transport costs (broadly defined) do play a significant role in determining the location of industry. If the transport costs of goods are too high, the industry will locate to the nearest large market, because firms wish to have lower transport costs. The presence of transport costs gives rise to the “home market effect” where suppliers located near a large market can attain economies of scale and export the goods. In Krugman’s words, a “country will tend to export those kinds of products for which they have relatively large domestic market demand” (Krugman 1980). The supposition is that when export expands until total transport costs become large, suppliers will move their production facilities to a nearby overseas market, in order to reduce operating costs. Otherwise, suppliers would lose their market due to global competition. This can be interpreted that international trade can be partly substituted with “market-seeking” FDI.
When transport costs (broadly defined) fall, what consequences on production location can then be expected? Krugman and Venables (1995) argue that when transport costs fall enough so that the advantage of low wages in the “periphery” (unindustrialized economy) offsets disadvantages in being remote from markets and suppliers of the “core” (industrialized economy), manufacturing in the core will move to the “periphery”. This argument can be applied to outward FDI, explaining “efficiency-seeking” FDI when transport costs fall until lower wages offset the disadvantages of other conditions.
However, the industry concentrates on specific countries/cities. In a world where transport costs were zero, firms could locate anywhere they wished. However, even in
† Anderson and Wincoop (2004) use the term “trade cost” which is favored by trade
economists of international trade instead of “transport cost” which a geographical economist would generally use. Both concepts are the same.
this case, in reality, industries tend to concentrate in some specific cities in order to share externalities such as skilled human resources. For instance, software design is such an industry in which transport costs are substantially zero, since software engineers can exchange information mutually and deliver products to the head office via the Internet immediately. Nevertheless, the industry chose cities where there is a location advantage in terms of human resources. Specifically speaking, the industry-specific TNCs will outsource some processes to developing countries where there exist location advantages.
2.2 Driving Forces and Types of FDI
What are the driving forces of outward FDI? Roughly speaking, there are two primary drivers of outward FDI in the context of transport cost and home market:
1. Driving force 1 : to take advantage of low wage rates (and, more generally, low factor prices) in host countries (efficiency-seeking FDI);
2. Driving force 2 : to have better access to the markets of host countries and nearby countries (market-seeking FDI)
In addition, another driving force, that is, “resource-seeking” FDI, can be derived from traditional trade theory. “Efficiency-seeking” FDI can be regarded as one type of “resource-seeking” FDI since it seeks abundant labor resources. However, since “efficiency-seeking” FDI has special implications for the location of industry which differ from other “resource-seeking” FDI, the two are distinguished here.
When developed country TNCs set up their overseas production plants in developed countries where markets are large, the “market seeking” force works. A typical case is the European Union (EU) country TNCs that seek markets within the region.
On the contrary, when developed country TNCs set up their overseas production plants in developing countries, “efficiency seeking” forces are mainly at work because there is a large difference in wage rates between developed and developing countries. Strategic functions such as head quarters, research & development (R&D), and highly capital intensive manufacturing processes are located in the home country where high-skilled workers are available, while most of the manufacturing activities are located in host countries where wage rates are low.
“efficiency-seeking” and “market-seeking” work together so that developed country TNCs locate production in the host country (Fujita 2006). A typical example is China where markets are large and wage rates are low, attracting both “efficiency-seeking” and “market-seeking” FDIs from developed countries. “Market-seeking” FDIs are taken in goods for which transport costs are high due to high tariff rates.
These are cases of outward FDI from developed countries. However, our concern lies in outward FDI from developing countries, specifically speaking, from ASEAN countries. It seems there is no difference between developed country and developing country TNCs, In the following subsection, each type of FDI from ASEAN countries will be discussed.
2.3 “Market-seeking” FDI from ASEAN
“Market-seeking” forces work very strong for ASEAN TNCs. Thanks to the “home market effect”, giant ASEAN firms are very active in taking “marketing-seeking” FDI. A striking example of market-seeking FDI is Proton. Proton is launching a global strategy. In 2002, Proton acquired a British automobile company which has acted as an R&D center and has import and distribution centers of cars and parts in Australia and the United Kingdom as well as an assembly line in Indonesia.
Other giant ASEAN firms are extending their business wings also. A Philippine giant, San Miguel, has expanded its business to overseas. San Miguel operates a brewery in Vietnam, Australia and Indonesia and maintains four breweries in China, including Hong Kong. Overseas packaging facilities include a glass plant and metals-crown plants in China and Vietnam as well as plastics plants in China and Indonesia. The Charoen Pokphand (CP) Group, a leading Thai agro-based company, expanded into Bangladesh, Cambodia, China, Hong Kong, India, Indonesia, Malaysia, Myanmar, Singapore, Taiwan, Turkey, and Vietnam. The CP Group started seeds businesses, then through vertical integration, moved into feed mills, poultry, swine, duck breeding and processing. As opportunities developed, the CP Group extended its reach, first in Asia, then in the rest of the world, focusing on the development needs of the people, expanding not only its selection of foods but also the logistics and retail distribution links, like convenience stores, supermarkets and hypermarkets as well as
casual dining outlets, introducing its products on an international level"‡.
Not only big businesses but also small family businesses have succeeded in global market places, serving customers in Asia-Pacific and world wide. LKT, a semiconductor business equipment solution company, based in Penang, Malaysia, has opened a production facility in Thailand and service support centers in China, Costa Rica, Singapore, Thailand, and the United States. Pentmaster, a semiconductor manufacturing automation solution company in Penang, has opened offices in Ireland, Germany, and the United States to support customers and distributors in China, Taiwan, the Philippines, and Singapore.
These ASEAN TNCs, whether they be big businesses or SMEs, are expanding their businesses beyond their national boundaries, to ASEAN, then to China, the Unites States, Australia, and the United Kingdom – wherever they can find markets.
2.4 “Efficiency-seeking” FDI from ASEAN
ASEAN country TNCs are expanding their overseas business by “efficiency-seeking” FDI as developed country firms have done. Indeed, a large number of Singapore TNCs went to Malaysia where wage rates are low and businessmen can commute by car from Singapore. Singapore and Malaysia TNCs advanced to Thailand, Indonesia, and China.
Felda and KL Kepong, both Malaysian firms with objectives to attain economies of scale, went to Indonesia where labor and land are cheap to cultivate palm trees and import them back to Malaysia. Those products are mainly exported to China and other countries through their international distribution networks. Correspondingly, Thai sugar refinery TNCs cultivate and refine sugarcane in Laos where wages are lower, and additionally, language and culture are similar. Refined sugar is imported back to Thailand to distribute all over the world. Usually these FDI host countries provide cheaper labor than source countries. However, for “efficiency-seeking” purposes, ASEAN TNC usually had overseas operation facilities in neighboring ASEAN countries and did not go to African countries because transport and communication costs would be high due to geographical distance.
‡
2.5 “Supplier Following Assembler” FDI and Other New Types of FDI
FDI in intermediate goods is one of the characteristics of FDI in East Asia where manufacturing processes are split and located across borders within the region, and in other words, so-called production fragmentation has developed. When developed country TNCs expand production seeking to explore new frontiers of lower wage countries, local suppliers in the host countries follow foreign assemblers, moving to the new frontier. This type of FDI can be called “supplier following assembler” FDI, which has both aspects of “efficiency-seeking” and “market-seeking” FDI in intermediate goods, which reflects a close linkage between foreign assemblers and domestic suppliers.
In ASEAN, communication equipment is an industry with a developed international production network. Figure 1 shows the international procurement of hard disc drive assembler, Hitachi Global Storage of Thailand (HGST). HGST purchases various parts and components from overseas. ASEAN local suppliers have participated in the production networks, although most of their first tier suppliers are Japanese affiliates operating in East Asia, mainly in the ASEAN countries. The ASEAN local suppliers instance, Engtek, a component manufacturer for the disc drive industry, based in Penang, established factories in Dongguan in 1996, the Philippines in 1997, and Thailand in 1998 in order to meet the demands of its largest customer, Fujitsu, which has been aggressively expanding its market. Eventually, Engtek has elevated its status from a mid-size Malaysian company to become global player. (ENG Teknologi Holding, 2000). 2.6 “Function Seeking” FDI
TNCs, both developed ones and developing ones, have explored location-specific advantages, which are different country by country, and more precisely, city by city. Singapore has offered strong financial service skills and excellent infrastructure and targets leading-edge offshore functions such as remote robotics management, healthcare and genetic diagnostics (A.T. Kearney 2004). It has become one of the key hubs for regional headquarters (UNCTAD 2004, pp204). In fact, Malaysian, Thai, and other ASEAN TNCs went to Singapore, and some to Hong Kong, to set up functions for international trade and financing.
phenomenon. Developing-country firms are also setting up R&D activities abroad to access these foreign markets and centers of excellence (UNCTAD, 2005, pp189). Singapore plays a role as a regional design center and Penang a training center for ASEAN countries where training costs are cheaper than Singapore. Some ASEAN country TNCs went to the United States and India where knowledgeable human resources are available.
3. PATTERN OF OUTWARD FDI FROM ASEAN
3.1 Outward FDI Pattern
What features does outward FDI from ASEAN have? In answer to this question, first of all, outward FDI patterns are examined as compared to inward FDI.
Figure 2 shows outward and inward FDI patterns of EU15, NAFTA, East Asia, developing economies, and ASEAN. The large marks indicate figures in 2004 and the small ones 2000, respectively. Interestingly, EU’s outward FDI stock was larger than its inward FDI stock and increased rapidly from 2000 to 2004. Outward FDI stock of EU in 2000 was larger than that of NAFTA in 2004, while the inward FDI of both regions were at a similar level. The large EU outward FDI was due to intra-regional FDI. Intra- regional FDI in the EU amounted to 66% of total EU FDI inflows in 2004, which was the same figure as intra-regional trade.
How can the high intra-regional FDI be explained? The gravity model, in which location is determined by economic size (or market) and geographical distance (as a proxy of broadly defined transport costs), tells us that the EU would be the largest trade and FDI area because it has the second largest market in the world, and transport costs between the EU nations are low due to geographical proximity and reduction of border barriers in trade and investment, as well as the well developed highway networks. NAFTA has a larger economic size than the EU. However there are only three countries, and therefore both intra regional trade and FDI flows of NAFTA are smaller compared to those of the EU. Looking at NAFTA, in 2000, its outward FDI was smaller than inward FDI. However, in 2004, its outward FDI became larger than its inward FDI.
These facts indicate outward FDI increases inward FDI as industrialization advances. This law seems to be applied to the ASEAN countries. For instance, Singapore is the largest FDI source country, followed by Malaysia (Figure 3). However, the rest of the ASEAN countries are still minor sources of FDI. Outward FDI from Thailand and the Philippines is increasing but still very small (Figure 4).
3.2 Geographical Distribution of Outward FDI from ASEAN
What geographical distribution patterns are observed for outward FDI from ASEAN? The geographical distribution pattern is subject to the gravity framework that market and geographical distance determine trade and investment. Figure 5 shows the share of FDI stock abroad from Malaysia by geographical destination and the total trade values of the destination country, which is a proxy of economic size. Malaysia took FDI to Singapore, 15.1% of its total outward FDI, higher than that to the United States, which made up 14.1% of the total. The same figure to Indonesia and Thailand is larger than those figures to Taiwan and Canada where their trade sizes are larger than Indonesia and Thailand.
These evidences support that gravity forces, that is, geographical distance and market, are a crucial determinant of outward FDI. In particular, geographical distance plays a significant role in the geographical distribution of outward FDI.
Thailand provides another good example of developing country TNCs going to neighboring countries. Outward FDI from Thailand to ASEAN countries amounted to 35% of the total outward FDI of Thailand in 2004 (see Figure 6). Among them, FDI to Singapore accounted for 14.3%, followed by the Philippines 7.1%, Vietnam 4.9%, Indonesia 3.5%, Cambodia 2.0%, Myanmar 1.5%, Laos 1.4%, and Malaysia 0.8%.
These evidences indicate that, due to geographical proximity, ASEAN TNCs expanded to neighboring countries where they have a comparative advantage in finding a market and in doing cheap labor operations, due to low transport and communication costs with the geographical proximity and similar language, culture and customs. This is the same reason that Japanese FDI went to Taiwan first, then to South Korea and Hong Kong in the 1960s and the 1970s for “efficiency-seeking” and “market-seeking”: geographical proximity and the same language. Many Koreans, Hong Kongers, and Taiwanese spoke Japanese at that time. It was in the late 1970s that Japanese firms
expanded production facilities to Singapore where American semiconductors operated at that time and suppliers were concentrated.
More importantly, Thai TNCs have extended their business to East Asian (ASEAN, China, and Hong Kong) countries. Thailand’s outward FDI directed to East Asia increased from 52% of its total outward FDI in 1995 to more than 62% in 2004. On the other hand, the share to the United States decreased from 23% in 1995 to 13% in 2004, and the share to the EU decreased slightly from 10% to 7%. That 60% of outward FDI from East Asia went to East Asia means that Thailand TNCs are doing business considering space on a regional scale of East Asia. This is also true for Malaysia and Singapore as will be discussed later.
3.3 Diversification of Geographical Distribution
Outward FDI flow from Malaysia, more advanced than Thailand, shows a slightly different pattern than that from Thailand. The share of outward FDI from Malaysia to ASEAN decreased remarkably from 32.3% in 1995 to 23.2% in 2004, and its share to East Asia also decreased from 58.8% in 1995 to 34.2% in 2004. On the other hand, the same figure to the United States increased from 9.1% to 14.1% in the same years. In addition, outward FDI from Malaysia to Africa grew from 1.2% to 4.5%.
The decrease of outward FDI to ASEAN and East Asia is seen in Singapore also. Share of outward FDI from Singapore to ASEAN decreased from 32.2% in 1994 to 21.9% in 2003, and the same figure to East Asia decreased from 56.4% to 47.0%. Diversification in direction of outward FDI in Malaysia and Singapore implies that developing country TNCs expand their business on a regional scale, but extend more on a global scale as they grow.
There is a good example at the firm level: Ingenuity Solutions (Malaysia) has targeted the knowledge base of developed countries such as the United States when investing in R&D abroad (UNCTAD, 2005, pp182). The company has located its software development center in India, and its representative office in the United States makes it possible to respond to the needs of customers in the United States.
4. INTRA-REGONAL FDI IN ASEAN
ASEAN has launched the AFTA which, through a Common Effective Preferential Tariff (CEPT) scheme, is designed to attract foreign direct investment (FDI) from abroad through improvement of the trade and investment environment in ASEAN. By the beginning of 2003, the ASEAN 6, that is, the original six member states (Brunei, Indonesia, Malaysia, the Philippines, Singapore and Thailand) applied AFTA’s tariff level of 0–5 % to 98.4 % of a total of 44,060 products. ASEAN has determined to reduce the tariff level to 0% by 2010. Vietnam is expected to achieve 0-5 AFTA compliance in 2006, Laos and Myanmar in 2008, and Cambodia in 2010, and these four new members will eliminate all imported duties by 2012.
The question then arises, can ASEAN country enterprises expand their business wings beyond their home countries to within the ASEAN region? What country can be source and host, and in what industries are ASEAN country enterprises furthering their integration?
4.1 Who are Sources and Hosts?
Intra-regional FDI in ASEAN is not a new phenomenon. As discussed in the previous section, ASEAN TNCs have moved into neighboring ASEAN countries. The question then arises, what country is the source and what country is the host of intra-regional FDI? In other words, what patterns does intra-regional FDI in ASEAN have?
Table 1, 2 and 3 summarize cross border FDI, balance of payment base, within ASEAN countries between 1995 and 2003, compiled from ASEAN Secretary FDI data, Statistics of Foreign Direct Investment in ASEAN Seventh Edition, 2005.
Singapore was the largest FDI source and host country of intra-ASEAN FDI. 63.7% of source FDI was from Singapore. More than 34% of outward FDI from Singapore was directed to Malaysia, followed by Thailand, 32%; Vietnam, 10%; and Indonesia, 8%. Singapore’s intra-regional FDI in ASEAN was concentrated in these four countries.
Malaysia, Indonesia and Thailand were the second (15.2%), third (13.2%) and fourth (5.0%) largest source of intra-ASEAN FDI, respectively. Interestingly, 66.8% of
outward FDI from Malaysia and 85.5% from Indonesia was directed at Singapore. On the other hand, outward FDI from Thailand was directed at various countries: 27.4% to Vietnam, 21.8% to Singapore, 13.9% to Myanmar, 13.4% to Malaysia, 10.9% to Laos, 10.1% to Indonesia, and so on.
Why have Malaysian and Indonesian enterprises sent so much FDI to Singapore? Singapore performs a function of intermediary trade where goods are transported from neighboring countries to Singapore for trade and then shipped all over the world. Foreign trade payments are carried out in Singapore, and surplus dollars are operated there. For this function, neighboring country enterprises have had international trade offices in Singapore. In recent years, Singapore has also taken on functions of R&D and design centers. In particular, Malaysian firms have set up center of excellences functions there. For instance, Bogasari International (Indonesia, food processing) chose Singapore, in part due to the country’s favorable R&D incentive schemes for foreign investors (UNCTAD 2005, pp182). Malaysia’s labor force is on par with Singapore, so it has functioned as a training center for ASEAN as training costs are cheaper there than in Singapore.
4.2 What Industries Are Taking Intra-ASEAN FDI?
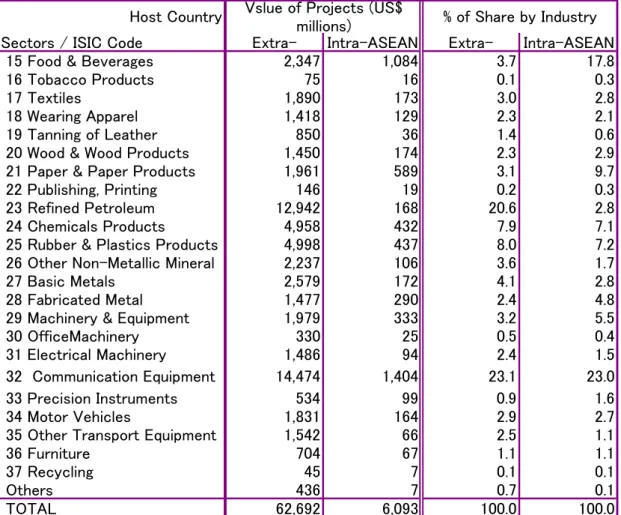
What industries take in intra-ASEAN FDI? Table 4 compares approval-based FDI inflows to ASEAN in the manufacturing industry from extra- and intra-ASEAN by industrial sector during the period between 1999 and 2003, provided by the ASEAN Secretary. Unfortunately, the figures for Singapore are excluded due to the lack of available data.
ASEAN’s intra-regional FDI has been characterized by “efficiency-seeking” FDI, or more precisely, “supplier following assembler” FDI in intermediate goods. A typical example is communication equipment. The communication equipment industry dominated the largest share of intra-ASEAN FDI inflows, accounting for 23% of total intra-ASEAN FDI inflows. Coincidentally, the share is the same as FDI inflow from the extra-ASEAN region. Many developed country TNCs in the communication equipment industry had moved production sites to Singapore first and then to Malaysia, Thailand, the Philippines, and China, seeking cheap labor. Foreign assemblers moved small parts of manufacturing processes first, and then gradually moved other processes, finally
moving the assembly process into Malaysia, Thailand, and the Philippines. Not only foreign suppliers but also local suppliers in the communication equipment industry have followed their customers to expand into those countries, in order to respond quickly to the needs of customers.
Why did the communication equipment industry send the largest amount FDI to the ASEAN countries? Communication equipment has a characteristic of low transport costs. Transport costs in parts and components related to communication equipment are only 2-3% of purchased goods by air§, which is lower than any other industries, since the cubic measurement and weight are very small. On the other hand, the sales prices of communication devices fall about 1.5% every month. Considering that sales prices fall about 1.5% every month, transport costs amounting to 2-3% of purchased part costs are not high. Interestingly, a low transport cost industry, such as the communication equipment industry, produces not only large international trade but also a large amount of FDI. This evidence may suggest that FDI substitutes partly for trade.
ASEAN firms in machinery & equipment and fabricated metal, which are backward linkage industries for communication equipment, are aggressively advancing to beyond borders within the region, seeking cheap labor and markets with suppliers following assemblers.
The food and beverage industry is a mixture of “efficiency-seeking” and “market-seeking”. Palm oil and sugar are typical “efficiency-seeking” products, but the beverage industry is “market-seeking”. The food and beverage industry of intra-ASEAN FDI reached 1,084 million US dollars and accounted for 18% of total intra-ASEAN FDI. Intra-ASEAN FDI in the food and beverage industry concentrated in Indonesia at 56%; Malaysia, 29%; Vietnam, 15%; and Thailand, 5% (see Table 5).
The motor vehicle industry is one of typical “market seeking” FDI. In particular, Malaysian automobile industries have spread to abroad due to the “home market effect”. Proton, a Malaysian automobile assembler, expanded to Indonesia. Malaysian automobile part supplier Ingress Autoventures has established a joint-venture company with Japan-based Katayama Kogyo Co. Ltd. in Thailand. Beginning with two facilities in Rayong in 2003, a third facility in Ayutthaya began operations in 2005. In order to
expand and diversify the Group’s operations, PT Ingress Malindo (IMV), a Malaysian automobile supplier, was formed in Indonesia in August 2003. The plant is located on the Jababeka Industrial Estate, a location prominent in this industry in the Cikarang Selatan area. Malaysian automobile supplier Auto Parts Holdings Sdn Bhd, a wholly-owned subsidiary of APM Automotive, signed a joint-venture agreement with P.T. Mekar Armada Jaya to manufacture and distribute automotive bus and train seating products in Indonesia in 2001 and entered into a joint venture with Hefei Winking Asset Co.Ltd. in 2002 to produce and distribute automotive seats, interior parts and metal components in China. Thai automobile supplier Thai Summit Group expanded into Malaysia. Thai motor cycle supplier New Chip Xeng moved into Laos in 1991.
4.3 Two-Way Intra-Industry FDI in ASEAN
Looking at approval base FDI inflow data cross tabulation by industry and by country, it can be observed that two way intra-industry FDI has emerged in ASEAN. ASEAN TNCs in the communication equipment industry have mutually invested. Malaysia advanced to Thailand, Indonesia, and the Philippines; meanwhile Thailand expanded to Malaysia, and the Philippines, thus, two-way intra-industry FDI between Malaysia and Thailand has arisen just like between the EU countries.
Two-way intra-industry FDI has developed well in the food industry where local suppliers have developed: between Malaysia and Thailand, between Indonesia and Malaysia, between Indonesia and Thailand, and between Thailand and the Philippines. Two-way intra-industry FDI has observed in automobile industry between Thailand and Malaysia.
This intra-ASEAN FDI suggests that ASEAN country enterprises explore the markets of other countries in ASEAN and make use of the relative advantages of each location, such as labor force, resources, infrastructure, parts supplier or agglomeration of industries and investor friendly measures like corporate tax exemptions.. It can be said that there is a high possibility of further development of intra-industry FDI in industries in which indigenous firms are developing if transport costs (broadly, including government procedures) continue to decline and capacity building for manufacturing is further enhanced.
4.4 FDI to ASEAN LDCS
ASEAN enterprises have expanded into the ASEAN LDC countries. For instance, Thailand invested 151 million US dollars in Laos, which amounted to 10.9% of intra-ASEAN outward FDI from Thailand, and 58.2% of intra-ASEAN FDI into Laos between 1999 and 2003 (Table2 and 3). Thailand invested 191 million US dollars during the same years.
The ASEAN apparel industry went to Cambodia, Laos, and Vietnam for purposes of exporting to third countries. The food industry went to Cambodia, Laos, Vietnam and Malaysia for export to third countries and home markets. Similar language and culture, and geographical proximities are very important (see Figure 5).
Vietnam is increasing FDI since the Laos-Viet Nam Joint Venture established in 2000 to extend loans to invest by Vietnam’s firms in Laos. Vietnam is increasing FDI in Laos. Nine projects have been carried out in Laos so far.
5. CONCLUSION AND POLICY IMPLICATIONS
Outward FDI from developing countries is a proxy indicator to measure how important a role developing country enterprises have played in the world market, and how they benefit from globalization where border barriers are reduced.
This study finds that ASEAN enterprises have extended their business activities to East Asia, being regional and global players. First, Singapore has taken a lead, followed by Malaysia and Indonesia, although most of their FDI is directed at Singapore. Second, ASEAN country TNCs went to neighboring countries at first, resulting in a high share of outward FDI within ASEAN and East Asia, and then to large markets such as the United States as they grew. They seem to take a step up from being local players, then ASEAN regional players, and finally global players. Through overseas production, even small players have grown to be global players. Third, there is a variety in outward FDI from ASEAN: “market seeking”, “efficiency-seeking”, and “resource seeking” FDI. The most developed type is “efficiency-seeking” FDI where ASEAN TNCs sought after countries with cheap labor and lands. They followed their customers when the
customers expanded their facilities to lower wage countries, a phenomenon which can be called “supplier following assembler” FDI. The communication equipment industry is a typical industry in which ASEAN suppliers followed multinational corporations. Fourth, thanks to the home market effect, some ASEAN enterprises become global players. Food and agro-based industries are typical cases of this.
ASEAN enterprises have been very dynamic in seeking cheap labor and markets overseas. ASEAN local TNCs can develop together with foreign multinational firms. It may depend on the following two things: first, whether ASEAN can really establish a seamless production area or not. In this regard, tariff barriers are designed to be eliminated for substantially all goods, and border barriers will be reduced if e-custom clearance and single window inspection are completely implemented in all member countries by 2012 as scheduled, which will make it possible to apply and get approval for export and import procedures from custom offices and other related agencies. The elimination of trade barriers, particularly in the lower income countries of Cambodia, Laos, Myanmar, and Vietnam, would provide business opportunities for not only multinational firms but also local ASEAN ones. Second is whether the low wage countries of Cambodia, Laos, Myanmar, and Vietnam can implement investment friendly measures with a view to attractiveness for FDI**. Production costs and transport costs can be reduced by enhancing capacity building in infrastructure (road, sea and air ports, communication, and so on), institutions (streamlining procedures for trade, investment and registration, deregulation of capital participation, tax privileges and other investment facilitation measures), human resources (skill labor training centre, laboratory, and university) and so on. The most important thing is the service spirit of government officers who approve certificates. These favorable measures for FDI will increase the number of ASEAN TNCs expanding into the LDC countries and enhance regionalization in investment as well as trade.
** The success of some Asian economies is no coincidence. Active and coherent policies
References
Anderson, James E. and Eric van Wiocoop. 2004. “Trade Costs,” Journal of Economic Literature, Vol. XLII, pp. 691-751.
A.T. Kearney (2004). A.T. Kearney’s 2004 Offshore Location Attractiveness Index: Making Offshore Decision (Chicago: A.T. Kearney)
ENG Teknologi Holding. 2000. SMI Globalization: 25 Years of Engtek Growth. Malaysia.
Fujita, Masahisa. 2006. “Formation and Growth of Economic Agglomerations and Industrial Clusters: A Theoretical Framework From the Viewpoint of Spatial Economics” (forthcoming).
Fujita, Masahisa, Paul Krugman and Anthony.J.. Venables. 1999. The Spatial Economy. Cities,
Countries and International Trade. Cambridge: MA: MIT Press.
Fouquin, Micjel., Daisuke Hiratsuka, and Fukunari Kimura. 2006. “Introduction: De Facto Economic Integration in East Asia” in Hiratsuka eds., East Asia’s De Facto
Economic Integration, London: Palgrave Macmillan.
Krugman, Paul. 1979. “A Model of Innovation, Technology Transfer, and the World Distribution of Income,” The Journal of Political Economy, Vol.187, No2 (April): 253-266.
________. 1980. Scale economies, production differentiation and the pattern of trade, the American Economic Review 70. 950-959.
________. 1991a. Geography and Trade. Cambridge: The MIT Press.
________.1991b. “Increasing Returns and Economic Geography” The Journal of
Political Economy, Vol. 99, No3 (Jun.): 483-499.
Krugman, Paul. and Anthony J. Venables. 1995. “Globalization and the Inequity of Nations,” the Quarterly Journal of Economics, Vol.110, No4 (November), 857-880.
METI, 2005, "Senkuteki Kamotsu Toushi Kankyou Seibi Jitushi Jigyou.
UNCTAD. 2004. World Investment Report 2005: The Shift Towards Services, United Nations, New York and Geneva, 2005
________.2005. World Investment Report 2005: Transnational Corporations and the Internationalization of R&D, United Nations, New York and Geneva, 2005
COVER: NHK DISK:HOYA SCREW: KATAYAMA SEAL: KOKOKU, TOKAI RAMP: DAICHI TOP CLAMP: BPI, SOODE LATCH: NOK PLATECASE: BRIDGESTONE LABEL: SANSAI FILTER: SSRETEK PCBA: SSCI SUSPENSION: NHK Japan SPNDLE MOTOR: NIDEC, NMB BASE: WEARNS CARRIAGE: FUJIKURA, SANEI FLEX CABLE: NOK PIVOT: NMB SEAL: KOKOKU VCM: SMT,TDK TOP COVER: NOK, NHK PCBA: SSCI HGA:UTC HAS:UTC Thailand BASE: KENSEISHA PIVOT: NSK SPACER:KENSEISHA VCM:SHINETSU BASE:ASAHI CARD:SCI, CELESTICA TOP CLAMP: SCL, CELESTICA, SOODE DISK: KOMAG COVER: KURODA, CHEUNGWOH SCREW:TIORMAC, SPURWAY PIVOT: NSK PC ADP: JST DISC: HOYA Singapore PCBA:GBM,SSCI CARRIAGE:TDK HGA: HSPC BASE: BPI HEAD: HGST SUSPENSION:NHK
DAMPING PLATE: IMEAS COIL SUPPORT: TOTOKU PCBA: IONIX TOP CLAMP: GML DISK: HGST HEAD: HGST SUSPENSION:HTI USA FILTER CAP: GML W.SUSPENSION: SUMITOMO VCM: SHINETSU PCBA: SOLECTION
Malaysia Hong Kong
Taiwan Philippines Indonesia China HEAD: GDL Mexico
East Asia NAFTA
EU 15 ASEAN10 0 2,000 4,000 6,000 0 2,000 4,000 6,000
Outward Stocks US$ billion
In war d Sto c ks U S$ billio n
Figure 1 Parts Procurement of a Hard disc Drive Assembler Located in Thailand
Source: Compiled by author, based on interview at Hitachi Global Storage Technology (Thailand) in August 2005.
Figure 2. FDI Inward and Outward Stock by Region (2004, US$ billion)
Source: UNCTAD FDI Online (http://stats.unctad.org/FDI/TableViewer/tableView.aspx). Note: East Asia includes ASEAN10, China, Japan, Korea, Hong Kong, and Taiwan.
Malaysia Singapore Indonesia Philippines Thailand Viet Nam 0 30 60 90 120 150 180 0 30 60 90 120 150 180
Outward FDI in 2004, US$ billion
TI nw ar d FD I Sto c ks in 2004 、 US$ bil lion
Source: UNCTAD FDI Online
(http://stats.unctad.org/FDI/TableViewer/tableView.aspx).
Figure 4. Outward FDI Flows of the ASEAN Countries, US$ million
-2,000 0 2,000 4,000 6,000 8,000 10,000 12,000
Indonesia Malaysia Philippines Singapore Thailand
U S$ mill ion 1980 1990 2000 2002 2004
Source: UNCTAD FDI Online (http://stats.unctad.org/FDI/TableViewer/tableView.aspx)
Figure 3. Inward and Outward FDI Stocks of the ASEAN countries (2004, US$ billion)
Figure 5. Share of FDI Stock Abroad from Malaysia by Geographical Destination Canada China Hong Kong, Taiwan Indonesia Singapore Thailand United States Japan Viet Nam ĭ 2. 4. 6. 8. 10. 12. 14. 16. 0 500 1000 1500 2000 2500
total Trade, US$ billion in 2004
Share of F D I sto c ks abr oad , by geo g raphical de st in atio n, % in 200 4
Source: FDI data from UNCTAD and trade data from IMF, Direction of Trade, CDROM 2005.
Figure 6 Share of FDI Stock Abroad from Thailand by Geographical Destination, 1995-2004, % European Union, 6.8 United States, 12.8 ASEAN, 35.4 East Asia, 62.0 0.0 10.0 20.0 30.0 40.0 50.0 60.0 70.0 1995 1996 1997 1998 1999 2000 2001 2002 2003 2004 % Source: UNCTAD.
Figure 7. Share of FDI Stock Abroad from Malaysia by Geographical Destination, 1995-2004 (%) European Union United States Africa Latin America ASEAN East Asia 0.0 10.0 20.0 30.0 40.0 50.0 60.0 70.0 1995 1996 1997 1998 1999 2000 2001 2002 2003 2004 % Source: UNCTAD.
Table 1. Intra-ASEAN FDI Flows by Source and Host Country (1995-2003, US $ million)
Host country BRN CAM INE LAO MAL MYA PHL SIG THL VET Total Source country Brunei (BRN) - - -27 - 298 - - 176 0 - 448 Cambodia (CAM) - - 0 0 3 - - 5 9 1 17 Indonesia (INE) 55 - 1 - 309 30 39 3157 43 59 3691 Laos (LAO) - - 0 - 0 - - 1 5 6 12 Malaysia (MAL) 205 - 328 95 0 65 85 2830 134 492 4234 Myanmar (MYA) - - 0 0 0 - - 45 2 - 48 Philippines (PHL) 4 - 13 - 92 4 - 43 29 49 234 Singapore (SIG) 1109 - 1401 10 6082 746 1086 0 5616 1708 17760 Thailand (THL) 8 - 140 151 186 194 29 303 0 382 1393 Vietanm (VET) 0 - 0 4 38 - - 13 3 - 58 Total 1380 - 1857 261 7009 1039 1239 6575 5840 2696 27894
Source: Compiled by author from ASEAN Secretary FDI Data, "Statistics of Foreign Direct Investment in ASEAN Seventh Edition”, 2005.
Table 2. Share of Intra-ASEAN FDI Flows by Source Country (1995-2003, %)
Host country BRN CAM INE LAO MAL MYA PHL SIG THL VET Total Source country Brunei (BRN) - - -1.4 - 4.3 - - 2.7 0.0 - 1.6 Cambodia (CAM) - - 0.0 0.0 0.0 - - 0.1 0.2 0.0 0.1 Indonesia (INE) 4.0 - 0.1 - 4.4 2.9 3.1 48.0 0.7 2.2 13.2 Laos (LAO) - - 0.0 - 0.0 - - 0.0 0.1 0.2 0.0 Malaysia (MAL) 14.8 - 17.7 36.4 0.0 6.3 6.9 43.0 2.3 18.3 15.2 Myanmar (MYA) - - 0.0 0.0 0.0 - - 0.7 0.0 - 0.2 Philippines (PHL) 0.3 - 0.7 - 1.3 0.4 - 0.7 0.5 1.8 0.8 Singapore (SIG) 80.4 - 75.5 3.9 86.8 71.8 87.7 0.0 96.2 63.4 63.7 Thailand (THL) 0.5 - 7.6 58.1 2.7 18.7 2.3 4.6 0.0 14.2 5.0 Vietanm (VET) 0.0 - 0.0 1.6 0.5 - - 0.2 0.0 - 0.2 Total 100.0 - 100.0 100.0 100.0 100.0 100.0 100.0 100.0 100.0 100.0
Table 3. Share of Intra-ASEAN FDI Flows by Host Country (1995-2003, %)
Host country BRN CAM INE LAO MAL MYA PHL SIG THL VET Total Source country Brunei (BRN) - - -6.0 - 66.7 - - 39.3 0.0 - 100.0 Cambodia (CAM) - - 0.0 0.2 15.8 - - 28.1 52.3 3.6 100.0 Indonesia (INE) 1.5 - 0.0 - 8.4 0.8 1.0 85.5 1.2 1.6 100.0 Laos (LAO) - - 0.0 - 1.3 - - 11.2 39.4 48.1 100.0 Malaysia (MAL) 4.8 - 7.7 2.2 0.0 1.5 2.0 66.8 3.2 11.6 100.0 Myanmar (MYA) - - 0.0 0.1 1.0 - - 95.4 3.5 - 100.0 Philippines (PHL) 1.5 - 5.7 - 39.5 1.6 - 18.6 12.3 20.9 100.0 Singapore (SIG) 6.2 - 7.9 0.1 34.2 4.2 6.1 0.0 31.6 9.6 100.0 Thailand (THL) 0.5 - 10.1 10.9 13.4 13.9 2.0 21.8 0.0 27.4 100.0 Vietanm (VET) 0.3 - 0.0 7.4 65.5 - - 22.4 4.4 - 100.0 Total 4.9 - 6.7 0.9 25.1 3.7 4.4 23.6 20.9 9.7 100.0
Table 4. FDI Inflow from Extra- and Intra- ASEAN in Manufacturing Industry (approved base) by Industrial Sector (1999-2003)
Host Country
Sectors / ISIC Code Extra- Intra-ASEAN Extra- Intra-ASEAN
15 Food & Beverages 2,347 1,084 3.7 17.8
16 Tobacco Products 75 16 0.1 0.3
17 Textiles 1,890 173 3.0 2.8
18 Wearing Apparel 1,418 129 2.3 2.1
19 Tanning of Leather 850 36 1.4 0.6
20 Wood & Wood Products 1,450 174 2.3 2.9
21 Paper & Paper Products 1,961 589 3.1 9.7
22 Publishing, Printing 146 19 0.2 0.3
23 Refined Petroleum 12,942 168 20.6 2.8
24 Chemicals Products 4,958 432 7.9 7.1
25 Rubber & Plastics Products 4,998 437 8.0 7.2
26 Other Non-Metallic Mineral 2,237 106 3.6 1.7
27 Basic Metals 2,579 172 4.1 2.8
28 Fabricated Metal 1,477 290 2.4 4.8
29 Machinery & Equipment 1,979 333 3.2 5.5
30 OfficeMachinery 330 25 0.5 0.4
31 Electrical Machinery 1,486 94 2.4 1.5
32 Communication Equipment 14,474 1,404 23.1 23.0
33 Precision Instruments 534 99 0.9 1.6
34 Motor Vehicles 1,831 164 2.9 2.7
35 Other Transport Equipment 1,542 66 2.5 1.1
36 Furniture 704 67 1.1 1.1
37 Recycling 45 7 0.1 0.1
Others 436 7 0.7 0.1
TOTAL 62,692 6,093 100.0 100.0
Vslue of Projects (US$
millions) % of Share by Industry
Source: Compiled by author from ASEAN Secretary FDI data, "Statistics of Foreign Direct Investment in ASEAN Seventh Edition”, 2005.
Table 5. Share of Intra-ASEAN FDI Flows in Manufacturing Industry (approved base) by Industrial Sector (1999-2003)
Host Country Sectors / ISIC Code
15 Food & Beverages 0.2 0.3 56.3 0.6 22.9 0.0 0.0 4.9 14.6 100.0 16 Tobacco Products 0.0 0.0 11.7 0.0 82.2 0.0 0.0 0.0 0.0 100.0 17 Textiles 0.0 0.0 68.8 0.0 22.8 0.3 0.6 4.9 2.6 100.0 18 Wearing Apparel 6.4 0.0 25.8 0.2 15.9 5.4 2.1 5.4 20.3 100.0 19 Tanning of Leather 0.0 0.0 29.8 2.5 6.8 0.0 2.4 19.6 38.9 100.0 20 Wood & Wood Products 0.0 0.0 37.1 2.2 32.2 2.0 9.3 2.4 14.8 100.0 21 Paper & Paper Products 0.0 0.0 83.7 0.1 3.0 1.4 3.0 2.7 5.5 100.0 22 Publishing, Printing 0.9 0.0 10.0 2.1 47.7 0.0 0.1 19.7 15.2 100.0 23 Refined Petroleum 0.0 0.0 20.5 1.5 78.0 0.0 0.0 0.0 0.0 100.0 24 Chemicals Products 0.0 0.0 12.0 0.1 31.9 0.0 1.7 48.4 5.8 100.0 25 Rubber & Plastics Products 0.1 0.0 20.9 0.3 22.2 0.0 1.0 46.6 8.5 100.0 26 Other Non-Metallic Mineral 2.0 0.0 1.7 0.6 50.6 0.0 16.7 5.5 22.9 100.0 27 Basic Metals 0.4 0.0 27.6 0.0 30.6 0.0 2.1 25.4 13.9 100.0 28 Fabricated Metal 0.9 0.0 10.2 0.1 44.3 0.1 2.7 26.1 15.6 100.0 29 Machinery & Equipment 0.0 0.0 9.0 0.0 30.7 0.0 0.2 54.3 5.8 100.0 30 OfficeMachinery 0.0 0.0 27.9 3.0 0.0 0.0 45.2 0.0 23.9 100.0 31 Electrical Machinery 0.0 0.0 6.8 0.4 55.7 0.0 4.5 13.3 19.4 100.0 32 Communication Equipment 0.0 0.0 4.7 0.0 55.5 0.0 10.8 28.6 0.4 100.0 33 Precision Instruments 0.0 0.0 28.3 2.2 60.4 0.0 6.6 2.6 0.0 100.0 34 Motor Vehicles 0.0 0.0 37.7 0.2 0.1 0.0 2.4 27.7 31.9 100.0 35 Other Transport Equipment 0.0 0.0 59.5 0.8 28.8 0.0 0.0 8.4 2.4 100.0 36 Furniture 0.5 0.0 16.8 2.5 33.5 5.2 2.1 5.1 34.3 100.0 37 Recycling 0.0 0.0 0.0 3.7 0.0 0.0 30.7 65.5 0.0 100.0
Others 0.0 0.0 0.0 0.0 46.6 0.0 1.5 0.0 0.0 100.0
TOTAL 0.3 0.0 30.2 0.4 33.6 0.4 4.3 21.2 9.0 100.0
Indonesia Lao PDR Malaysia Myanmar Philippines Thailand Viet Nam ASEAN Brunei
DarussalaCambodia
Source: Same as Table 4 Note: Singapore is excluded.