博 士 学 位 論 文
日 本 人 2 型 糖 尿 病 患 者 に お け る 高 用 量
メ ト ホ ル ミ ン の 投 与 量・ 投 与 回 数 が
有効性・安全性に及ぼす影響
貫
戸
幸
星
日本人 2型糖尿病患者における高用量メトホルミンの投与量・投与回数が有効性・安全性に及ぼす影響 貫 戸 幸 星近 畿 大 学 大 学 院
医 学 研 究 科 医 学 系 専 攻
Doctoral Dissertation
Effects of dosage and dosing frequency on the efficacy
and safety of high-dose metformin in Japanese patients
with type 2 diabetes mellitus
Kousei Kanto
November 2017
Department of Endocrinology, Metabolism and Diabetes, Major in Medical Sciences
Kindai University Graduate School of Medical Sciences
Effects of dosage and dosing frequency on the efficacy and safety of
high-dose metformin in Japanese patients with type 2 diabetes mellitus
Kousei Kanto, Hiroyuki Ito, Shinsuke Noso, Naru Babaya, Yoshihisa Hiromine, Yasunori Taketomo, Junko Toma, Fumimaru Niwano, Sara Yasutake, Yumiko Kawabata, Hiroshi Ikegami
Department of Endocrinology, Metabolism and Diabetes, Kindai University Faculty of Medicine
ABSTRACT
Aims/Introduction:Differences in the efficacy and safety of antidiabetic drugs among different ethnic groups are well documented. Metformin is widely used in the treatment of type 2 diabetes in Western countries, but high doses of metformin have been approved only recently for clinical use in Japan. The aim of the present study was to investigate the effects of dosage and dosing frequency on the efficacy and safety of high-dose metformin in Japanese patients.
Materials and Methods:A total of 71 Japanese patients with type 2 diabetes were prospectively studied for the effects of dosage and dosing frequency on the efficacy and safety of metformin during hospitalization. Dose effects were studied in 27 patients treated with 0, 500, 1,000, 1,500 and 2,250 mg/day of metformin. The effect of dosing frequency was compared in 56 patients with 1,500 mg/day of metformin administered either twice or three times per day.
Results:Significant dose-dependent improvement in daily profiles of blood glucose was observed with metformin dosages up to 1,500 mg/day, with a trend towards further improvement observed at 2,250 mg/ day. The efficacy of 1,500 mg of metformin was comparable when the drug was administered either two or three times per day. The most frequently reported side-effects were gastrointestinal symptoms, which were not affected by the dosage or dosing frequency of metformin.
Conclusions:These results show that the efficacy of high-dose metformin is dose-dependent in Japanese patients. The efficacy and safety of metformin were similar when the drug was administered either two or three times per day.
INTRODUCTION
Differences in the efficacy and safety of antidiabetic drugs among different ethnic groups are well
documented1, leading to differences in recommendations and guidelines for the treatment of type 2 diabetes
between East Asian and Western countries2, 3. Metformin has been used as an oral antidiabetic drug for more
than 50 years. The guidelines for the treatment of type 2 diabetes mellitus-consensus statements established by the American Diabetes Association and European Association of the Study of Diabetes-recommend the
use of metformin as an initial treatment2. Prospective studies, such as the Multicenter Metformin Study4 and
the United Kingdom Prospective Diabetes Study5, have provided evidence for beneficial effects of metformin,
including cardiovascular protection and safety, in the treatment of type 2 diabetes mellitus, leading to an increase in the use of metformin not only in Europe and the USA but also in Japan. Although the usual
dosage of metformin is over 2,000 mg/day in Europe and the USA6, the maximum dose allowed for clinical
use in Japan has long been limited to 750 mg/day, which is less than half that of Western countries. In addition, the recommended prescription of the maximum dose of metformin in Japan (750 mg/day) has been through 250-mg tablets administered three times per day. In contrast, treatment with metformin in
the United Kingdom Prospective Diabtes Study5 started with one 850-mg tablet per day, then 850 mg twice
daily and ultimately 1,700 mg in the morning and 850 mg with the evening meal. These differences in dosage and dosing frequency of metformin between Japan and Western countries have made it difficult to translate the results of clinical trials in Western countries to Japanese patients. Recently, the maximum allowed dose of metformin in Japan was increased to 2,250 mg/day, a comparable dose with those in Western countries. It is still unknown, however, whether high-dose metformin shows the same efficacy and safety in Japanese patients as in European and USA patients. To address these questions, we studied the dose dependence of the efficacy and safety of high-dose metformin for the treatment of type 2 diabetes in Japanese patients. We also compared the efficacy and safety of the same daily dose of metformin when the drug was administered either two or three times per day.
METHODS
Participants and study design
This was a prospective open-label, non-randomized study carried out in a single hospital. The study design is summarized in Figures S1 and S2. Participants were recruited between August 2011 and October 2016. A total of 71 patients with type 2 diabetes were studied (Table 1). To minimize confounding factors, such as diet and exercise, all studies were carried out during hospitalization at the Department of Endocrinology, Metabolism and Diabetes of Kindai University Hospital. All patients were provided standard meals for patients with diabetes as recommended by the Japan Diabetes Society (25–30 kcal/ideal bodyweight kg, 50–60% carbohydrate, 15–20% protein and 20–25% fat). Treatment with metformin was not started until fasting plasma glucose reached at least < 11.0mmol/l to minimize the confounding effect of initial
improvement in glycemic control as a result of hospitalization. To study potential dose-dependent changes in the efficacy and safety of metformin, 27 patients who were newly prescribed metformin were selected (study 1; Figure S1). To study the effects of dosing frequency on the efficacy and safety of metformin, 56 patients who were prescribed 1,500 mg/day of metformin were selected (study 2; Figure S2). Among 56 patients in study 2, 12 patients were studied in both study 1 and study 2. These patients were included in study 2 because they did not agree to increase doses from 1,500 mg to 2,250 mg in study 1, but agreed to change dosing frequency.
Table 1. Clinical characteristics of patients at baseline
Study 1 (Dose dependence)
Study 2
(Dosing frequency) Total* (n = 27) (n = 56) (n = 71) Sex (male/female) 16 / 11 31 / 25 39 / 32 Age (years) 57.9 ± 13.4 60.8 ± 12.0 60.6 ± 12.0 Median 64 64 64 Range 21-77 21-84 21-84 BMI (kg/m2) 25.6 ± 4.4 27.2 ± 6.4 27.0 ± 5.9 Duration of diabetes (years) 6.5 ± 8.7 8.4 ± 7.4 8.4 ± 8.0 Family history ( − / + ) 14 / 13 29 / 27 36 / 35 Diabetic retinopathy (NDR, SDR, PrePDR, PDR) 21 / 3 / 3 / 0 44 / 9 / 1 / 2 55 / 10 / 4 / 2 Diabetic nephropathy (stage 1, 2, 3, 4, 5) 24 / 3 / 0 / 0 / 0 47 / 7 / 2 / 0 / 0 59 / 10 / 2 / 0 / 0 Fasting plasma glucose (mmol/L) 8.6 ± 3.0 7.2 ± 2.3 7.5 ± 2.4 Glycated hemoglobin (%) 10.5 ± 2.4 9.7 ± 2.0 9.9 ± 2.1 Creatinine (µmol/L) 64.9 ± 17.8 66.1±18.2 65.3 ± 17.9 eGFR (mL/min/1.73 m2) 80.9 ± 20.3 77.3 ± 19.3 78.3 ± 19.5 Aspartate amino transferase (IU/L) 28.6 ± 15.3 25.7 ± 12.9 26.4 ± 14.0 Alanine amino transferase (IU/L) 35.8 ± 23.6 31.7 ± 21.8 32.3 ± 21.8 Fasting C-peptide (nmol/L) 0.7 ± 0.4 0.7 ± 0.3 0.7 ± 0.3 Lactic acid (mmol/L) 1.1 ± 0.3 1.2 ± 0.5 1.2 ± 0.4
Data are expressed as the mean ± standard deviation or number. Median and range are also shown for age. *A total of 12 participants were studied in both study 1 and study 2, resulting in a total of 71 patients. BMI, body mass index; NDR, no diabetic retinopathy; SDR, simple diabetic retinopathy; PrePDR, pre-prolif-erative diabetic retinopathy; PDR, prolifpre-prolif-erative diabetic retinopathy; eGFR, estimated glomerular filtration rate.
Inclusion criteria was no contraindications for metformin, age ≥20 years, fasting plasma C-peptide immunoreactivity > 0.20nmol/L and no acute illness or serious conditions other than diabetes. Patients were excluded if they had contraindications for metformin, including impaired renal function (serum creatinine > 114.9 μmol/L for men, > 106.1 μmol/L for women); impaired liver function (serum transaminases > 100 IU/ L); congestive heart failure; respiratory diseases with hypoxia, history of lactic acidosis; presence of acute or chronic metabolic acidosis; including diabetic ketoacidosis with or without coma; or a known hypersensitivity to metformin. A total of 14 patients were treated with metformin only, whereas the others were administered metformin as an add-on therapy to other anti-diabetic medications (Table S1). During both study periods, doses of concomitant medications were not changed (Tables S1, S2). Insulin doses were also fixed, except for a minimal reduction of insulin dose when the patients suffered from hypoglycemia.
This study was approved by the institutional ethics committee of Kindai University Faculty of Medicine and was registered with the University Hospital Medical Information Network Clinical Trial Registry
Figure S2. Study design of dosing frequency (Study 2).
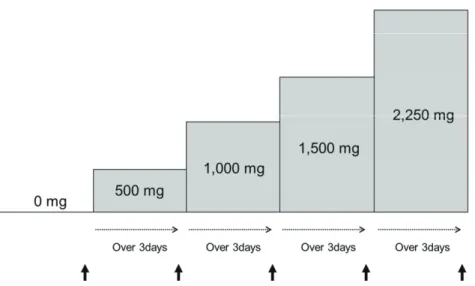
Figure S1. Study design to evaluate dose-dependent effects (Study 1). Arrow indicates timing for daily profiles of blood glucose and blood sampling.
(registration no. UMIN000011626). All participants provided written informed consent to participate in this study, which was carried out in accordance with the Declaration of Helsinki.
Table S1. Anti-diabetic medications concomitantly used with metformin Study 1 (Dose dependence)
(n=27)
Study 2 (Dosing frequency) (n=56) Total* (n=71) Insulin 18 (66.7%) 35 (62.5%) 45 (63.3%) DPP-4 inhibitor 3 (11.1%) 7 (12.5%) 8 (11.3%) GLP-1 receptor agonist 0 (0%) 5 (8.6%) 5 (7.0%) Sulfonyl urea 0 (0%) 3 (5.4%) 3 (4.2%) α-Glucosidase inhibitor 1 (3.7%) 0 (0%) 1 (1.4%) None 7 (25.9%) 10 (17.9%) 14 (19.7%)
Data are presented as number with % in parentheses.
*Twelve participants were studied in both study 1 and study 2, resulting in a total of 71 patients.
Table S2. Medications other than anti-diabetic drugs that potentially affect glucose levels Study 1 (Dose dependence)
(n=27)
Study 2 (Dosing frequency) (n=56) Total* (n=71) Statins 10 (37.0%) 26 (46.4%) 31 (43.6%) Fibrates 2 (7.4%) 5 (8.9%) 7 (9.9%) ARB 4 (14.8%) 24 (42.9%) 25 (35.2%) ACE 0 (0%) 1 (1.8%) 1 (1.4%) CCB 5 (18.5%) 15 (26.8%) 19 (26.8%) β-blocker 1 (3.7%) 1 (1.8%) 2 (2.8%) Loop diuretic 0 (0%) 1 (1.8%) 1 (1.4%) Hydrochlorothiazide 1 (3.7%) 5 (8.9%) 5 (7.0%)
Data are presented as number with % in parentheses.
ARB: Angiotensin receptor blocker, ACE: Angiotensin-converting enzyme inhibitor, CCB: Calcium channel blocker
Study 1: dose-dependent effects
The effect of metformin dosage on the efficacy of glycemic control was studied in 27 patients with type 2 diabetes with increasing doses of metformin, including 0, 500, 1,000, 1,500 and 2,250 mg daily (Figure S1). To normalize dosing frequency, metformin was administered twice daily after breakfast and dinner for all doses up to 1,500 mg/day. A subset of the patients (n=11) who did not reach optimal glycemic control (blood glucose < 6.7 mmol/L before each meal and at bedtime) with 1,500 mg/day and agreed to further increases in dose were treated with the maximum dose of 2,250 mg/day by adding 750 mg after lunch, resulting in 750 mg of metformin three times a day. Dosages of metformin were increased after at least 3 days of treatment with the previous dosage.
The efficacy of metformin was evaluated by daily profiles of blood glucose measured by a blood glucose meter for self-monitoring of blood glucose. Daily profiles of nine-point blood glucose was monitored before and 2 h after meals, at bedtime, at 0.00 hours and at 3.00 hours by patients under the supervision of medical staff. Study 2: dosing frequency
The effect of dosing frequency on the efficacy and safety of high-dose metformin was studied in a total of 56 patients with type 2 diabetes who were treated with 1,500 mg of metformin daily. Two groups of patients were studied (Figure S2). One group included patients who were treated with 500 mg of metformin three times per day and switched to 750 mg twice daily. The other group included patients who were treated with 750 mg of metformin twice daily and switched to 500 mg three times per day. Efficacy regarding glycemic control was evaluated by nine-point daily profiles as described in Study 1. Dosing frequency was changed after at least 3 days of treatment with the previous frequency.
To compare the differences in plasma concentrations of metformin between twice daily and three times daily administration, blood samples were collected before and 2 h after meals and at bedtime. The plasma concentrations of metformin were measured by high-performance liquid chromatography with tandem mass spectrometry analysis (Sumika Chemical Analysis Service, Osaka, Japan). The lower and upper limits of metformin concentration were 10.0 and 5,000.0 ng/ml, respectively.
Safety and tolerability
Patients were carefully monitored for adverse events. If gastrointestinal symptoms such as diarrhea, nausea, vomiting and appetite loss occurred after increases in dosage, patients were asked whether these were within a tolerable range. If symptoms were not tolerable, then the patients were asked to reduce the dosage to the previous level, and further studies with increases in dosage were terminated. All 27 patients successfully increased their dose of metformin up to 1,500 mg. All 11 patients who agreed to further increase their dosage up to the maximum of 2,250 mg also tolerated this dosage.
Ltd, Tokyo, Japan). The lower and upper limits of quantification for lactic acid were 0.02 and 17.8 mmol/L, respectively.
Among all medications concomitantly prescribed with metformin, medications shown to inhibit organic cation transporter 1 (OCT1) activity in vitro were evaluated because of the possible contribution of these
drugs to adverse effects7. OCT1-inhibiting medications included tricyclic antidepressants, proton pump
inhibitors, diltiazem, doxazosin, spironolactone and clopidogrel7. There were no prescriptions for other
OCT1-inhibiting drugs. Statistical analysis
The data are presented as the means ± standard deviation unless otherwise stated. A paired t-test was used to analyze differences in daily profiles of blood glucose levels and plasma levels of lactic acid. Categorical
variables were compared using X2− tests or Fisher’s exact probability tests (as in the case where a number
in a category was < 5). RESULTS
Clinical characteristics
The baseline characteristics of the participants are summarized in Table 1. The anti-glutamic acid decar-boxylase antibody was negative and fasting plasma C-peptide levels were > 0.20 nmol/L in all participants. Dose-dependent effects
Figure 1A and Figure S3 show daily profiles of glucose levels when treated with different doses of met-formin. Significant decreases in blood glucose were observed with increasing doses of metformin (Figures 1A, S3). Areas under the curve of nine-point daily profiles of blood glucose also significantly decreased with increasing dosages of metformin up to 1,500 mg/day (Figure 1B) and tended to decrease with further increases in metformin from 1,500 to 2,250 mg/day (Figure S4). Dose-dependent improvement in glycemic control were similarly observed in metformin monotherapy group (Figures S5), metformin add-on groups with insulin (Figure S6) and without insulin (Figure S7).
Dosing Frequency
Figure 2 shows the nine-point blood glucose levels in the twice-daily and the three times-daily treatment groups. Blood glucose levels were comparable between the two groups, except for a slightly higher blood glucose level before dinner in the twice-daily group than in the three times-daily group (6.9 ±1.7 vs. 6.3 ± 1.3 mmol/L, P=0.02). A similar tendency was observed in metformin monotherapy group (Figure S8), metformin add-on groups with and without insulin (Figure S9).
glu-cose profiles between the twice and three times-daily treatment groups, the plasma concentrations of met-formin were measured in 8 patients (Figure 3). Plasma concentrations of metmet-formin were significantly lower after lunch (1,010.5 ± 420.6 vs. 1,440.9 ± 371.2 ng/ml, P=0.04) and before dinner (823.6 ± 350.8 vs. 1,255.6 ± 584.0 ng/ml, P=0.009) in the twice-daily group than in the three times-daily group.
Figure 2. Effect of dosing frequency on daily profile of blood glucose in patients with type 2 diabetes. Data are presented as the mean ± standard error of the mean. *P < 0.05. AB, after breakfast; AD, after dinner; AL, after lunch; BB, before breakfast; BD, before dinner; BL, before lunch; BS, before sleep.
Figure 1. Effect of increasing dosages of metformin on (a) daily profiles of blood glucose and (b) areas under the curve (AUC) in patients with type 2 diabetes mellitus.
Nine-point daily profiles of blood glucose in 27 patients with type 2 diabetes mellitus treated with metformin: 0 mg (open circle), 500 mg (closed square), 1,000 mg (open triangle) and 1,500 mg (closed diamond) daily doses are shown. Data are presented as the mean ± standard error of the mean. *P < 0.05, **P < 0.01, ***P < 0.001,
****P < 0.0001: 0 mg versus 500 mg; †P < 0.05, ††P < 0.01, †††P < 0.001, ††††
P < 0.0001: 500 mg versus 1,000 mg; ¶P < 0.05, ¶¶P < 0.01, ¶¶¶P < 0.001, ¶¶¶
¶
P < 0.0001: 1,000 mg versus 1,500 mg. AB, after breakfast; AD, after dinner; AL, after lunch; BB, before breakfast; BD, before dinner; BL, before lunch; BS, before sleep.
Figure 3. Plasma concentration of metformin in patients treated with 1,500 mg metformin daily, administered either twice per day (solid line) or three times per day (broken line). Data are presented as the mean ± standard error of the mean. *P < 0.05, **P < 0.01. AB, after breakfast; AD, after dinner; AL, after lunch; BB, before break-fast; BD, before dinner; BL, before lunch; BS, before sleep.
Figure S3. Effect of increasing dosage of metformin on 9-point daily profiles of blood glucose in 11 patients with type 2 diabetes mellitus treated with up to a maximum dose of 2,250 mg metformin daily: 0 mg (open circle), 500 mg (closed square), 1,000 mg (open triangle), 1,500 mg (closed diamond) and 2,250 mg (open diamond).
Data are expressed as the mean ± SEM.
BB, before breakfast; AB, after breakfast; BL, before lunch; AL, after lunch; BD, before dinner; AD, after dinner; BS, before sleep.
*P<0.05, **P<0.01, ***P<0.001, ****P<0.0001: 0 mg vs. 500 mg,
†
P<0.05, † † P<0.01, † † † P<0.001, † † † † P<0.0001: 500 mg vs. 1,000 mg,
¶
Figure S4. Effect of increasing dosages of metformin on areas under the curve (AUC) of 9-point daily profiles of blood glucose in 11 patients with type 2 diabetes mellitus treated with the maximum dose of 2,250 mg metformin daily.
Figure S5. Effect of increasing dosages of metformin on daily profiles of blood glucose (A) and
areas under the curve (AUC) (B) in metformin monotherapy group.
9-point daily profiles of blood glucose in 7 patients with type 2 diabetes mellitus treated with metformin monotherapy: 0 mg (open circle), 500 mg (closed square), 1,000 mg (open triangle) and 1,500 mg (closed diamond) daily doses are shown. Data are presented as the mean ± SEM.
BB, before breakfast; AB, after breakfast; BL, before lunch; AL, after lunch; BD, before dinner; AD, after dinner; BS, before sleep.
*P<0.05, **P<0.01: 0 mg vs. 500 mg,
†
P<0.05: 500 mg vs. 1,000 mg,
¶
Figure S6. Effect of increasing dosages of metformin on daily profiles of blood glucose (A) and areas
under the curve (AUC) (B) in add-on therapy group with insulin (insulin user).
9-point daily profiles of blood glucose in 18 patients with type 2 diabetes mellitus treated with metformin add-on therapy to insulin: 0 mg (open circle), 500 mg (closed square), 1,000 mg (open triangle) and 1,500 mg (closed diamond) daily doses are shown. Data are pre-sented as the mean ± SEM.
BB, before breakfast; AB, after breakfast; BL, before lunch; AL, after lunch; BD, before dinner; AD, after dinner; BS, before sleep.
*P<0.05, **P<0.01, ***P<0.001: 0 mg vs. 500 mg,
†
P<0.05, † † P<0.01, † † † P<0.001: 500 mg vs. 1,000 mg,
¶
P<0.05, ¶ ¶ P<0.01, ¶¶¶ P<0.001: 1,000 mg vs 1,500 mg
Figure S7. Effect of increasing dosages of metformin on daily profiles of blood glucose (A) and areas
under the curve (AUC) (B) in add-on therapy group without insulin (non-insulin user).
9-point daily profiles of blood glucose in 9 patients with type 2 diabetes mellitus treated with metformin add-on to other anti-diabetic medications, but not with insulin: 0 mg (open circle), 500 mg (closed square), 1,000 mg (open triangle) and 1,500 mg (closed diamond) daily doses are shown. Data are presented as the mean ± SEM.
BB, before breakfast; AB, after breakfast; BL, before lunch; AL, after lunch; BD, before dinner; AD, after dinner; BS, before sleep.
*P<0.05, **P<0.01: 0 mg vs. 500 mg,
†
P<0.05, † † P<0.01: 500 mg vs. 1,000 mg,
¶
Figure S8. Effect of dosing frequency on daily profile of blood glucose in 10 patients with type 2 diabetes mellitus treated with metformin monotherapy.
Data are presented as the mean ± SEM. * P < 0.05
BB; before breakfast, AB; after breakfast, BL; before lunch, AL; after lunch, BD; before dinner, AD; after dinner, BS; before sleep.
Figure S9. Effect of dosing frequency on daily profile of blood glucose in patients with type 2 diabetes mellitus treated with metformin add-on to other anti-diabetic medications. A: insulin user (n=35); B: non-insulin user (n=21).
Data are presented as the mean ± SEM. * P < 0.05
BB; before breakfast, AB; after breakfast, BL; before lunch, AL; after lunch, BD; before dinner, AD; after dinner, BS; before sleep.
Safety and tolerability
The most common treatment-related adverse events were gastrointestinal symptoms, such as diarrhea, nausea and appetite loss. No serious adverse events occurred during the study. The frequencies of adverse events are shown in Table S3. Gastrointestinal symptoms were observed in 29.6% (8/27) and 30.3% (17/56) of patients in study 1 and study 2, respectively. Frequencies of gastrointestinal symptoms were not significantly different between the different dosage groups or between the twice-daily and the three times-daily treatment groups. No significant difference between patients with and without gastrointestinal symptoms was observed with the concomitant use of OCT1-inhibiting drugs (Table S4). The plasma concentration of lactic acid was not significantly different between the different dosage groups or between the twice- and three times-daily treatment groups (Table S5).
Table S3. Frequencies of adverse events with metformin. A. Study 1: Dose dependence
Adverse events (AE) (n=27)500 mg (n=27)1,000 mg (n=27)1,500 mg (n=11)2,250 mg
Diarrhea 2 1 2 0
Nausea 1 0 1 0
Appetite loss 0 1 0 0
Total events 3 2 3 0
Patients with AE 3 (11.1%) 2 (7.4%) 3 (11.1%) 0 (0%)
B. Study 2: Dosing frequency
Adverse events (AE) Three times daily(n=56) Twice daily(n=56) P value
Diarrhea 10 11 NS
Nausea 3 4 NS
Total events 13 15 NS
Patients with AE 11 (19.6%) 14 (25.0%) NS
Table S4. The numbers of patients treated concomitantly with different OCT1-inhibiting drugs
Drug/Drug Class Patients with adverse events(n=22) Patients with no adverse events(n=49) P value*
Overall 4 (18.1%) 12 (24.5%) NS
Tricyclic antidepressants 0 (0.0%) 1 (2.0%) NS
Proton pump inhibitors 4 (18.1%) 8 (16.3%) NS
Diltiazem 0 (0.0%) 1 (2.0%) NS
Doxazosin 0 (0.0%) 1 (2.0%) NS
Spironolactone 0 (0.0%) 2 (4.1%) NS
Clopidogrel 0 (0.0%) 2
(4.1%)
NS
*Fisher’s exact probability test, NS: not significant (P > 0.05)
Table S5. Plasma concentration of lactic acid in patients treated with different dosages (A) and dosing frequency (B) of metformin.
A. Study 1: Dose dependence
0 mg 500 mg 1,000 mg 1,500 mg 2,250 mg
Lactic acid (mmol/L) 1.1±0.5 1.0±0.3 1.0±0.4 1.1±0.3 1.0±0.2
Data are expressed as the mean ± SD
B. Study 2: Dosing frequency
Twice daily Three times daily
Lactic acid (mmol/L) 1.2±0.5 1.2±0.5
DISCUSSION
Metformin is widely used as an oral antidiabetic drug in Western countries, as well as in East Asian countries, including Japan. Marked differences, however, in maximum dosage, dosing frequency and dose of each tablet exist in Japan compared to Western countries. The maximum daily dose has long been limited to 750 mg, the dosage of the most commonly used tablet has been 250 mg, and the usual dosing frequency for a maximum daily dose of 750 mg has been three times per day in Japan. The maximum maintenance dose of metformin in Japan was recently increased to 1,500 mg, and further increases up to 2,250 mg are now permissible if required, making the dosage of metformin in Japan comparable to Western countries. We have previously reported the efficacy and safety of metformin within the lower dose range allowed for use
in Japan8. The efficacy and safety of high doses of metformin, however, are largely unknown in Japanese
patients with type 2 diabetes. We therefore studied the effects of dosage and dosing frequency on the efficacy and safety of high doses of metformin in Japanese patients with type 2 diabetes.
Dose-dependent effects were clearly observed in the efficacy of metformin up to 1,500 mg per day, as shown by significant improvement in glycemic control in both blood glucose levels and areas under the curve of 24-h daily profiles (Figure 1). A tendency towards further improvement was also observed with a maximum dose of metformin of 2,250 mg per day (Figures S3 and S4). A previous study in the USA on the dose response of metformin efficacy reported a dose-dependent improvement in glycated hemoglobin, with
the greatest decrease at doses of 2,000 mg9.
Effects of dosing frequency on the efficacy and safety of metformin have not previously been studied in detail, most likely because of a limited range of dosing frequency, once or twice daily at most in Western countries. In contrast, the recommended dosing frequency of metformin in Japan is commonly three, or at least two, times per day. This is likely due to the smaller maximum dose of metformin previously allowed for clinical use in Japan, leading to more frequent administration to maintain effective plasma levels of the drug
throughout the day. In the United Kingdom Prospective Diabetes Study5, initial treatment with metformin
was started with an 850-mg tablet once daily, which was more than three times larger than the 250-mg tablet commonly used in Japan. Another reason for more frequent administration in Japan may be gastrointestinal side effects, which may increase with increasing doses of metformin. As a higher dose is now allowed for clinical use in Japan, we compared the effects of dosing frequency on the efficacy and safety of high-dose metformin by comparing three times-daily and twice-daily administration. The daily profiles of blood glucose and their areas under the curve were comparable between the twice-daily and the three times-daily treatment groups, indicating that dosing frequency had little effect on the efficacy of 1,500-mg metformin in Japanese patients with type 2 diabetes. The only difference between the two groups was a slightly higher blood glucose level in the twice-daily group before dinner (Figure 2). According to pharmacokinetic data, peak concentrations of plasma metformin after oral administration are reached after approximately 2-4 hours,
study the possible contribution of pharmacokinetics of metformin on the difference in blood glucose levels between the twice-daily and the three times-daily treatment groups, plasma concentrations of metformin were compared between the two groups. Plasma concentrations of metformin were significantly lower after lunch and before dinner in the twice-daily treatment group compared to the three times-daily treatment group, suggesting that the higher level of blood glucose before dinner in the twice-daily group was likely as lower concentrations of metformin in the afternoon.
In addition to plasma concentration, the distribution and concentration of metformin in target organs might affect the efficacy and safety of this drug. Metformin is transported into the liver and other target organs
by organic cation transporters, mainly OCT-1, to exert its metabolic effects7, 10. Comparable effects despite
significant differences in plasma concentrations of metformin between the two groups might be a result of reduced differences in metformin concentrations in the target organs compared with the blood. Altogether, the data in the present study suggest that twice-daily administration can be used as an alternative to three times-daily administration in prescribing high doses of metformin, especially in patients with poor adherence to frequent dosing of the drug.
The most common side effects of metformin in the present study were gastrointestinal disturbances,
including diarrhea, nausea, and appetite loss (Table S3), as reported previously2, 7, 11, 12. The frequency of
gastrointestinal symptoms observed in the present study is comparable with 20% frequencies reported
previously4, 7, 9, 12. No significant influence of the dosage or dosing frequency of metformin was observed on
gastrointestinal symptoms (Table S3), suggesting that dosage and dosing frequency have little effect on gastrointestinal symptoms. Gastrointestinal symptoms have been suggested to be correlated with metformin
concentrations in the intestine7, which is affected by absorption of metformin from the intestinal lumen by
the transporter OCT1. Concomitant use of OCT1-inhibiting drugs has been reported to increase metformin
intolerance7. However, no significant differences were observed in the frequencies of concomitant use of
OCT1-inhibiting drugs between patients with or without gastrointestinal symptoms (Table S4). The plasma concentration of lactic acid was not different with different dosages of metformin or between the twice- and three times-daily treatment groups (Table S5).
The present study had a few limitations. First, the present study was carried out as open label, single arm and non-controlled design. Second, the effect of initial improvement as a result of hospitalization might have modified the efficacy of metformin, although we tried to minimize this by delaying metformin treatment until glycemic control reached to certain level. Third, the sample size for the treatment with highest dose of metformin (2,250mg) was rather small, which may have resulted in no significant difference between 1,500 mg and 2,250 mg of metformin. Further studies with larger number of participants are needed to clarify this point. In conclusion, the results of the present study show that the efficacy of high-dose metformin is dose -dependent in Japanese patients with type 2 diabetes. The efficacy and safety of metformin were similar when taken either twice daily or three times daily.
ACKNOWLEDGMENTS
We thank Drs. Sawa Yoshida, Koji Sueyoshi, Keisuke Monobe, Mamoru Ikeda, Tatsuro Minohara and Yukako Makutani for taking care of the patients during the study and Ms. Shie Hayase, Ms. Youko Yamano and Ms. Mariko Shiota for their skillful technical assistance.
DISCLOSURE
Hiroshi Ikegami has received clinical research grants from Astellas, AstraZeneca, Boehringer-Ingelheim, Daiichi-Sankyo, Johnson & Johnson, Kowa, Kyowa Hakko-Kirin, Novo Nordisk, Ono, Otsuka, Sanofi, Sanwa Kagaku Kenkyusho, Sumitomo Dainippon Pharma, Takeda and Tanabe Mitsubishi, and has received lecture honoraria from Kowa, Novo Nordisk and Sumitomo Dainippon Pharma. The other authors declare no conflict of interest.
REFERENCES
1.Seino Y, Kuwata H, Yabe D. Incretin-based drugs for type 2 diabetes :Focus on East Asian perspectives. J Diabetes Investig 2016;7:102-109.
2.Inzucchi SE, Bergenstal RM, Buse JB, et al. Management of hyperglycemia in type 2 diabetes, 2015:A patient-centered approach. Update to a position statement of the American Diabetes Association and the European Association for the Study of Diabetes. Diabetes Care 2015;38:140-149.
3.Japan Diabetes Society. Treatment guide for diabetes 2014-2015. Bunkodo, Tokyo 2014.(In Japanese)
4.DeFronzo RA, Goodman AM. Efficacy of metformin in patients with non-insulin-dependent diabetes mellitus. The Multicenter Metformin Study Group. N Engl J Med 1995;333:541-549.
5.UK prospective Diabetes Study(UKPDS)Group :Effect of intensive blood-glucose control with metformin on complications in overweight patients with type 2 diabetes(UKPDS 34). Lancet 1998;352:854-865.
6.Bailey CJ, Turner RC. Metformin. N Engl J Med 1996;334:574-579.
7.Dujic T, Zhou K, Donnelly LA, et al. Association of organic cation transporter 1 with intolerance to metformin in type 2 diabetes:A GoDARTS Study. Diabetes 2015;64:1786-1793.
8.Ito H, Ohno Y, Yamauchi T, et al. Efficacy and safety of metformin for treatment of type 2 diabetes in elderly Japanese patients. Geriatr Gerontol Int 2011;11 :55-62.
9.Garber AJ, Duncan TG, Goodman AM, et al. Efficacy of metformin in type II diabetes:results of a double-blind, placebo-controlled, dose-response trial. Am J Med 1997;103:491-497.
10.Graham GG, Punt J, Arora M, et al. Clinical pharmacokinetics of metformin. Clin Pharmacokinet 2011;50:81-98.
11.Dandona P, Fonseca V, Mier A, et al. Diarrhea and metformin in a diabetic clinic. Diabetes Care 1983;6:472-474.