Diurnal Rhythm of Metabolic and Activity Rates
in Juvenile Atlantic Salmon, Salmo salar
LINNAEUS
著者
HIRATA Hachiro
journal or
publication title
鹿児島大学水産学部紀要=Memoirs of Faculty of
Fisheries Kagoshima University
volume
22
number
1
page range
73-93
別言語のタイトル
大西洋サケの呼吸と活動の日周期について
Mem. Fac. Fish., kagoshima Univ. Vol. 22 No. 1, pp. 73~93 (1973)
Diurnal Rhythm of Metabolic and Activity Rates in
Juvenile Atlantic Salmon, Salmo salar Linnaeus
Hachiro HlRATA*
Introduction
It is reasonable to assume that all organisms have a diurnal, tidal, seasonal, or annual rhythm in their physiological and ecologicalaspects. Considering only the case of diurnal rhythm, herein, the study of the rhythm is a very important fundamental field in order to control animals and
plants.
For instance, since we have found out that time of fertilization of rice and wheat occurs about
two hours before sunrise, the techniques of cross-breeding have been making rapid progress. Re cently, we have recognized how important this research could be to the human being. Studying of the diurnal rhythm of our body temperature, pulse, blood pressure, metabolism and kidney
mechanisms contributes to the early diagnosis of disease (Reinberg and Ghata, 1957).
There has been recently a revival of interest in the study of diurnal rhythm amongst zoolo gists, physiologists, psychologists and botanists. Most interesting points among biologists who
have been working in the field of diurnal rhytm of animal are : 1) what is the rhythm pattern (viz. diurnal, nocturnal, twilight or non-rhythm)? 2) Is the rhythm shown by the animal exogenous or endogenous? and 3) what is the mechanism of the rhythm? (Harker, 1958). Additionally, in 1960, Hirata has expressed a formula of the rhythm strength and emphasized that rate of the strength is also one of the most important phenomena for studying of rhythm in life.
There are only two reports on the diurnal rhyhm of Atlantic salmon. However, they did not deal with all the problems mentioned above. In 1942, Hoar observed the feeding activity at
several times of day and reported that the fish feed more actively during the day than at night.
Recently, Ali (1961) has studied the position of retinal cones and pigment under constant condi tions of light and dark, and stated that while in light neither the cones nor pigment show a rhythm, the later shows 24 hour rhythm in dark.
In this study the metabolism, activity and feeding rates of yearling Atlantic salmon under
various conditions have been studied. The purpose has been to find out whether any of these show an inherent rhythm or are influenced by light alone. An attempt will be made to correlate results from the various conditions.
The author wishes to express thanks to Dr. S. Kobayashi, Emeritus Professor of Hokkaido University, Dr. M. A. Ali, Professor of University of Montreal and Dr. R. Kawashima, Profes sor of Hokkaido University, for their constant advice during the experiment and reading the
manuscript.
Review of literature
1. General
The generalaspects of diurnalrhythm in the animalkingdom have been reviewed by Harker
(1958). She divided 24-hour rhythm into two types; (a) exogenous : those which are under
the immediatecontrol of the environments ; (b) endogenous : those which persist in any contant
environmental conditions due to inherent factors.
Mori (1947) discussed the diurnal rhythm of physiological aspects in invertebrate animals. These are the daily, tidal, monthly and annual cycles. He termed these phenomena "rireki gen-sho" (Biological clocks). Later, such phenomena were recognized by Kobayashi and Watabe (1958) in pearl oyster. Rhythms covering periods longer than 24 hours have also been investiga ted by Brown (1957,1959), who has describedaccurate tidal and lunar rhythms in a number of
animals.
From the view point of applied biology, Reinberg and Ghata (1957) reviewed the diurnal rhythm and cycle of medical aspects in human beings. They pointed out that studying of diurnal rhythm of body temperature, pulse, blood pressure, standard metabolism and kidney mechanism
contributes to the early diagnosis of disease. 2. Diurnal rhythm of oxygen consumption in fish
There are a few reports on the diurnal rhythm of oxygen consumption in fish. Tamura (1935) designed the open system chamber for measurement of fish respiration. Later (1937,1939,1940, 1944, 1956) he studied the relation between metabolic rate and environmental factors in many fish, and pointed out that metabolism of the fish showed a diurnal rhythm. However, he has not observed the rate of metabolism in any Salmonoid. Clausen (1936) studied oxygen consumption in eight species of fish and determined that in the species which inhabit relatively quiet water
(Huro salmoids, Ameiurus melas, Pomosix annularis, Notemigonus crysoleucas, and Erimysan
sucetta) the fluctuations tend to fall into a rhythm that is characteristic for each species. No defi
nite rhythm was found in the oxygen consumption of fish (Campostoma anomalum, Lusilus
cornutus and Ethoeostoma blennioides) which inhabit rapid flowing water. Before beginning the
experiment, he acclimatized the fish for 12 hours to a respiratory chamber. His observations lasted for only a day. As pointed out by Tamura (1935), Kawamoto (1957)and Hirata (1960b), it is necessary that an experiment must last longer than a day in order to provide reliable results. 3. Feeding
The feeding activity of animals is one of the most important factors to maintan their life. So,
many reports have been published on this problem. However, all of them are based on qualitative analysis of the stomach content without considering the time factor. From this point of view,
Hoar (1942) studied on diurnal variations in feeding activity of young Atlantic salmon and trout
(Salmo salar and Salvelinus fontinalis), and reported that they always feed somewhat less
avidly from 1 to 2 hours after sunset until 2 to 3 hours after sunrise. In addition, feeding activity is frequently depressed during the middle of the day. The nightly depression in feeding is not entirely due to temperature. Also, salmon and trout are not entirely dependent on light receptors
HlRATA : Diurnal Rhythm of Metabolic and Activity Rates in Juvenile Atlantic Salmon 75
to locate their food, as shown by the fact that they take food readily if fed in darkness during
the daytime. Rather it seems that salmon and trout are habituated to sleep during the hours of
darkness when food is less likely to be available, and that feeding gradually resumed during the
morning hours. The slackening in feeding at mid-day is due primarily to rising temperature,
although strong light is a possible associated factor.
Another investigation of quantitative and persistentanalysis of fish feeding has beencarried out recently by Kobayashi and his associates (Kobayashi and Hirata, 1957 a, b ; Hirata, 1957,
1958, 1960 a, b; Hirata and Kobayashi, 1959; Terao, 1959; Nishiyama, 1960). Their ex periments were conducted with the aid of an automatic feeding recorder (Kobayashi, Yuki and Hirata, 1956).
Among their investigations, the idea of the inflection point, d2Tldt2, of water temperature was applied to an analysis of the correlation between the feeding activity of goldfish and the changing rate of temperature (Hirata, 1960 a). In both autumn and spring months, the maxi mum feeding was often found to occur just at the time of the inflection point of temperature. Especially, in late autumn as the temperature fell, the peak of the feeding frequency was found
to correspond clearly with the time of the inflection point. In summer months, however, such
a tendency was found to be very rare. From these results he concluded that when the fish were
acclimatized to a relatively high temperature, the effect of change of temperature on fish feeding
was rather inconspicuous, but when the fish were adapted to low temperature such as in late
autumn, they became more sensitive even to a slight change in the water temperature.
Hirata (1960 b) also studied the diurnal rhythm of some species of fish, and expressed the formula of coefficient of rhythm (CR)* in order to determine the strength of rhythm pattern.
The results showed that the migratory fish (Oncorhyncus and Salmo) show lower coefficients
and non-migratory fish (Carpio and Carassius) show higher coefficients. On the other hand, he examined the rhythm strength of some subspecies (Funa, Funao, Wakin, Ryukin and Demekin)
of Carassius auratus, and found that the rhythm strength is closelyrelated to "rate of wildness'\
That is, wild fish show low coefficient of the rhythm strength and fish of a higher rate of
wildness have a high coefficient value. 4. Activity
Spencer (1939) found a 24-hour rhythm of activity in goldfish which persists in continuous light. Spoor (1948) and Hirata (1957, 1958, 1960 a) also obtained similar result. However, in the case of diurnal rhythm of movement activity in Salmonoid, the reports are many and con flicting. Sano (1955), Kobayashi et al. (1956) and Kobayashi (1958) reported that Oncorhyncus
keta fry showthe twilightrhythm. That is, the fish are active at lateevening and early morning.
Ii et al. (1952) stated that Salmoirideus has a diurnal rhythm and is more active in the daytime. Neave (1942) reported that adult fish (O. tschawytscha and O. kisutch) migrated to the upstream
mainly during daylight. No correlation was found between diurnal fluctuations in number of
migrants and volume or temperature of the river water. Light seemed the determining factor. Nishiyama (1959) recognized that the rhythm patterns of Salmonoid show change according
to their stage. He pointed out that their seaward migration occurs at nighttime and upstream
migration occurs at daytime. Hirata (1955) found that O. keta fry has two behaviours of both
schooling and milling. Schooling behaviour was found during the daytime in order to feed the
bait and milling occurred at nighttime during seaward migration.
Material and Methods 1. Material
The experimenents described herein were carried out in the Fish Research Laboratory of the
Memorial University of Newfoundland during the period of September 1960 to February 1S61.
Yearling Atlantic salmon (Salmo salar) obtained from the Margaree Hatchery, Maritimes Area, Canada Department of Fisheries were used. They were fed on a diet of raw ground beef liver once a day.
Body weights of the fish ranged from 7 to 13 grams. Water temperature ranged from 4 to 16°C during the period this investigation lasted.
2. Methods
A. Oxygen consumption
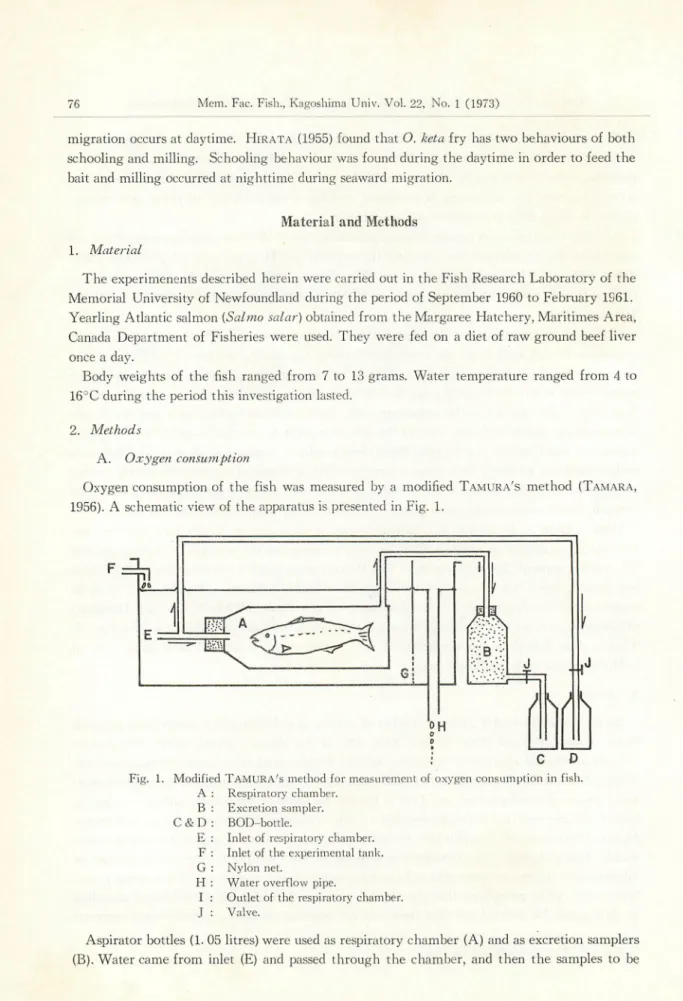
Oxygen consumption of the fish was measured by a modified Tamura's method (Tamara,
1956). A schematic view of the apparatus is presented in Fig. 1.
Fig. 1. Modified TAMURA's method for measurement of oxygen consumption in fish.
A B C&D E F G H I J Respiratory chamber. Excretion sampler. BOD-bottle.
Inlet of respiratory chamber. Inlet of the experimental tank. Nylon net.
Water overflow pipe.
Outlet of the respiratory chamber.
Valve.
Aspirator bottles (1. 05 litres) were used as respiratory chamber (A) and as excretion samplers
HIRATA : Diurnal Rhythm of Metabolic and Activity Rates in Juvenile Atlantic Salmon 77
tested were introduced into the BOD-bottle (C&D). The rate of the water flow was kept cons
tant at approximately 95 ml/min. The sand in the excretion sampler was changed every day. Three chambers, each containing one fish, were placed in the experimental tank (90x45x30 cm) with running water. Water samples of both inlet (E) and outlet (I) wete taken simultaneously every six hours (2 a. m., 8 a. m., 2 p. m., 8 p. m.). The oxygen content of the samples was measured by the Winkler's method. The difference in the oxygen content, between the inlet and the outlet yielded the amount consumed by the fish.
For the sake of brevity, the experiments will be referred to as follows in this paper. Ordinary condition in the hatchery "control"
Continuous light condition "light" Continuous dark condition "dark" Alternating light and dark every six hours "6-hour" Alternating light and dark every twelve hours "12-hour"
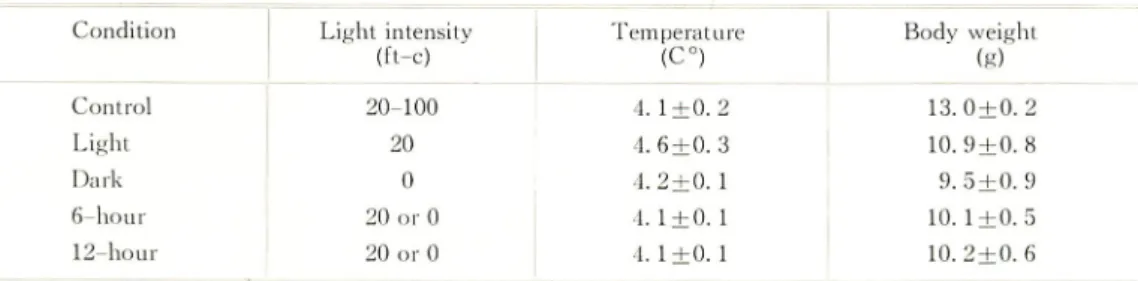
Light intensities and temperature during the experiment and the body weights of fish used
are shown in Table 1. In the case of "control", the amount of light varied with the duration
Table 1. Experimental conditions of oxygen consumption, (three fish used in each condition).
Condition Light intensity (ft-c) Temperature (C°) Body weight (g) Control 20-100 4. 1+0. 2 13.0 + 0.2 Light 20 •1.6 + 0.3 10. 9 + 0. 8 Dark 0 4.2 + 0. 1 9. 5 + 0.9 6 hour 20 or 0 1. 1+0. 1 10. 1+0.5 12-hour 20 or 0 1. 1+0. 1 10. 2 + 0. fi
and amount of sunshine, and ranged from 20 to 100 ft-c. in t he daytime. A 20 watt fluorescent
lamp was used to produce "light" condition. The intensity on the surface of the water was 20
ft-c. In the case of continuous dark, the experimental tank was covered with a wooden plate and black cloth. Alternating light-dark (6-or 12-hour) conditions were produced by manually turning on and off a 60 watt lamp. In this ease intensity of light at the water surface was about 20 ft-c.
Prior to beginning each experiment the fish were not fed for five days. Sampling started three hours after the fish were put in the respiratory chambers, and lasted for four or five days. Care was taken not to disturb the fish during water sampling and to keep water temperature constant (Table 1).
B, Activity
a. Feeding
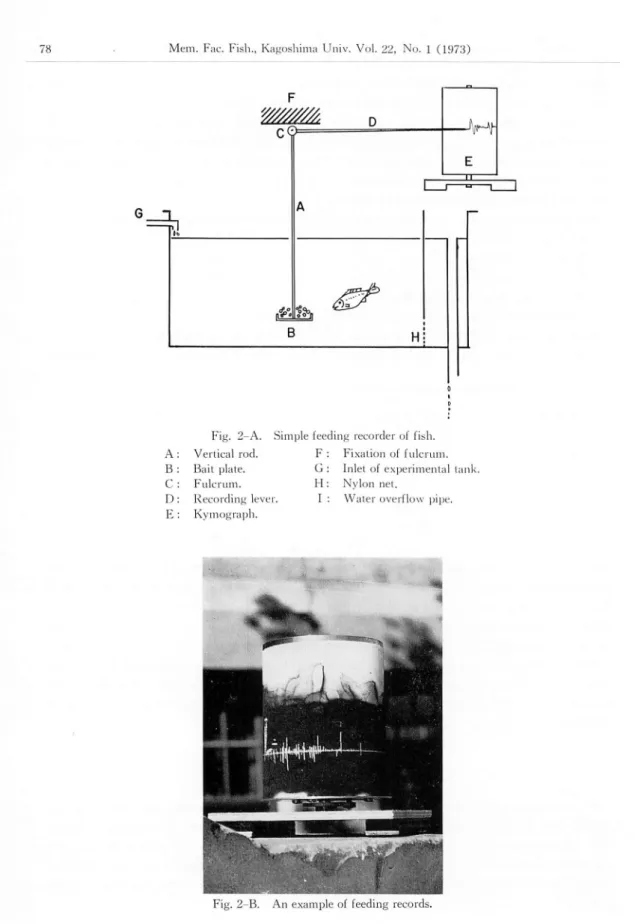
The feeding activity of the fish was recorded with the simple feeding recorder (Hirata, 1960a). Fig. 2-A shows the recorder used. Vertical rod (A), bait plate (B), fulcrum (C), recording lever (D) and kymograph (E) are the main parts of the recorder. The bait plate of the recorder was set in about the center of the experimental tank (90x45x35cm). Feeding was recorded directly on the kymograph when the fish pecked the bait. An example of the recorded is shown
G I
Fig. 2-A. Simple feeding recordei" ol lish.
A Vertical rod. F Fixation of fulcrum.
B Bail plate. G Inlet ol experimental tan
C Fulcrum. 11 Nylon net.
D Recording lever. I Water overflow pipe.
E Kymograph.
HlRATA : Diurnal Rhythm of Metabolic and Activity Rates in Juvenile Atlantic Salmon
Every time the fish pecked at the bait the pecking left a vertical trace on the smoked drum of
kymograph. Small movements of the fish also caused fluctuations of the recorder but these re cordings did not exceed 2 mm, therefore only the traces longer than 2 mm were counted. Each trace was counted as one attempt at feeding. For example, 3 vertical traces are seen in Fig. 2-B
which shows the record of feeding on October 19 between 4 and 5 a. m. This is taken to indicate
3 attempts by the fish to feed. Although the magnitude of the trace was relatd also to the fact that whether the fish just pecked at the bail or pressed the bait down after pecking, the attempt
was still considered to be one only.
Ten fish, approximately of the same size (9 to 11 gram), were selected and kept together in the tank of running water (Fig. 2-A). The bait of the recorder was changed once every nine
hours. The experiment to record feeding rates was carried out under "control" condition and lasted for five days. Care was taken not to disturb the fish exeept for the changing of bait in the
feeding recorder, and to keep water temperature constant as far as possible.
b. Movement
Fig. 3-A shows the aerograph (Hirata, 1960 b) used for the recordingof the fish activity
(movement). Elecric counter (C) made by Hattori Co., Tokyo, was used as recorder. Its maximum recording efficiency is 100 frequencies per minute. As shown in the figure, the recorder was
A C E&F
H
Fig. 3-A. Simple fish actograph.
Fulcrum. B&B' Electric counter. D
Stalk of plastic paddle. G Outlet of aquarjpm, f
Electric contact.
Plastic paddle. Inlet of aquarium. Activity chamber.
connected with wire to fulcrum (A) and to the fixed side of the electric contact (B'). The fulcrum supports the stalk (E & F ) of plastic paddle (D). Upper part of the stalk (E) was charged with electricity through the fulcrum. A glass aquarium (30x34x24 cm) was used as an activity cham ber. A small water flow was maintained through an inlet (G) at the bottom of the chamber. An outlet maintained the water level constant. Movement of the fish caused the plastic paddle to swing like a pendulum. The activity was recorded by the closing of the circuit, B-B'.
Movements of the fish were recorded as steps on the recorder of the actograph. one closing of the circuit was recorded as one step on the recording paper. If fish was very active, the circuit closed often, and more steps were recorded. Therefore, the steps were recorded in proportion to rates of fish movements. The number of steps per hour is counted as the rate of monvement
activity.
Three fish were kept together in the activity chamber. Their weight ranged from 8. 0 to 10. 4 grams. Prior to beginning the recording, the fish were left in the actograph for two days so that they could acclimatize themselves to it. The recording was carried out in the hatchery under "control" condition and lasted for four days. The fish were not fed during the experiment. Every care was taken not to disturb the fish during the experiment and to keep the water temperature
almost constant.
C. Calculations
a. Metabolic rates
The amount of oxygen consumption was calculated by the following expression (Tamura,
1956) :
~ • / in /i x (Inlet 02-content—Outlet 02-content)XWater flow
Oxygen consumption (ml/kg/hr) =
Body weight
02-content ml/1
Rate of water flow ml/hr
Body weight kg
b. Percentage of saturation of oxygen content
Percentage of saturation of oxygen content in the experimental tank was calculated by the
following expression (Japanese Scientific Society of Oceanography, 1956) :
_, , A . , ln/. (amount of oxygen content in the tank) X100
Percentage of saturation of oxygen content (96) = I0. 291-0.2809T+0.006009T*-0.000063T*
Oxygen content ml/1
T (water temperature) C°
c. Coefficient of rhythm strength
In order to determine the strength of rhythm pattern, coefficient of rhythm strength (RS)
was calculated by the following expression :
K n rTl
Zj Zj xij 7,~
JDC _ _*_^l_jNl Rtl F^<b{n>k(n—X}
n,k(n—l) degree of freedom
T2 each total of both day and night
xij each value
HlRATA : Diurnal Rhythm of Metabolic and Activity Rates in Juvenile Atlantic Salmon 81
than one, it is regarded as being statistically significant. Because Fo.os^i,^) were obtained from
F-table.
Results
1. Oxygen consumption
A. Control
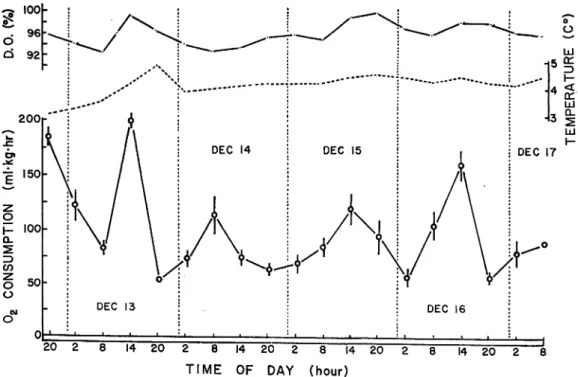
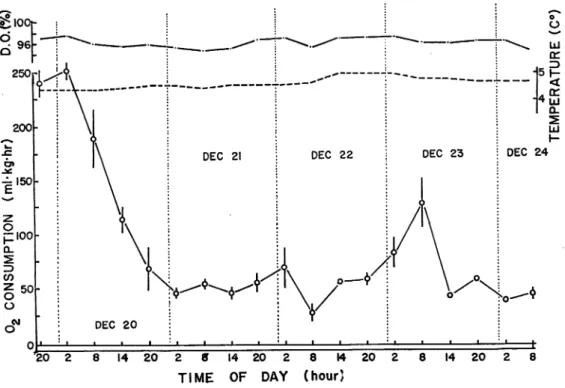
The mean rates of oxygen consumption of the three fish (Table 1) used in the experiment, at
various times of day and night, are shown in Fig. 4. Vertical bars at each point represent the
standard error, Where no bars are given, standard error was negligible. Temperature and oxygen
content of the water during the period of this experiment lasted are also presented in (Fig. 4).
It is observed that these factors do not show much variation except on the first day (temperature
and oxygen content) and the third day (oxygen content only).
During the experiment, average rate ofoxygen consumption was 94. 2+9. 8ml/kg/hr. Stand
ard metabolism was seen in the night and the value was approximately 71ml/kg/hr. The coeffi
cient of the rhythm strength (RS) was 1. 121.
The rates of oxygen consumption at various times show a variation that may be related to
day and night. It is to be observed that the rate of consumption during the day is generally
greater than that during the night. Thepeaks ofthe daily variation of the consumption occurred
£ 150 z o H 100 o l 2 3 CO z O 50 O 2 8 14 20" 2 8 [4
TIME OF DAY (hour)
Fig. 4. Diurnal variation ofoxygen consumption under the ordinary condition in the hatchery ('control'). Vertical bar at each point represents the standard error. Where no bars are
at 2p. m. except in the case of December 14 in which the peak occurred at 8a. m. Considerable fluctuation with significant difference among the means is observed during the first 24 hours of the experiment.
It is alsosurprising that the first value in the graph, viz. 8 p. m. of December 12,shows a high
rate of oxygen consumption (195ml/kg/hr). After the first 24 hours, however, the fluctuation becomes more orderly and indicates a regular diurnal rhythm in the rates of oxygen consump tion (50 to 120ml/kg/hr). It is also to be pointed out that samples taken at 8p. m. and 2a. m. of
the 2nd, 3rd, and 4 th days of the expriment show values that are lower than those of samples taken at 8 a. m. or 2 p. m. these days. An exception, however, is seen in the case of December 15 where the mean of the 2 p. m. is not significantly different from it. However, the trend is well
marked.
B. Continuous light
The daily variations of the oxygen consumption are shown in Fig. 5 in the same way as in the case of control. The temperature and oxygen content show very little variation, and ranged 4. 4 to 5.0 °C and 94 to 9796, respectively.
During this experiment, average rate of oxygen consumption was 80.7 ±13. 3 ml/kg/hr. The coefficient of rhythm strength (RS) was 0. Therefore, in general, there was no diurnal rhythm
in the rate of oxygen consmption in continuous light.
Considerable fluctuation, with significant decrease in the means, is observed during the first 30
£:i00f-"20 14 20 2 0 14 20 2 8 14
TIME OF DAY (hour)
Fig. 5. Diurnal variation of rate of oxygen consumption under the continuous lightcondition ('light').
Vertical bar at each point represents the standard error. Where no bars are given, standard error was negligilbe.
HlRATA : Diurnal Rhythm of Metabolic and Activity Rates in Juvenile Atlantic Salmon 83 hours of the experiment. The values of the first and second samples, viz. 8 p. m. of December 19 and 2 a. m. of December 20, show very high rates of oxygen consumption (approxmately 250
ml/kg/hr), but decrease to 50 ml/kg/hr towards the end of this period. It is to be observed that the rate of consumption on the 2nd and 3rd days of the experiment shows almost no
variation. Only peak of the rate of consumpion during the period of this experiment is found at 8 a. m. of the 4th day (December 23), while the lowest rate of the consumption shows at 8 a. m. of the 3 rd day. Since the fluctuation in the rates of consumption can not be related to day and
night periods, it may be concluded that in continuous light the metabolic rate does not exhibit a diurnal rhythm.
C. Continuous dark
The daily variations of the oxygen consumpton are shown in Fig. 6 with the water tempera ture and oxygen content in the experimental tank. Temperature and oxygen content of the water were almost constant, (4. 1 to 4. 3°C and 91 to 94. 5%, respectively).
During the experiment, average rates of oxygen consumption was 50. 6 ±9.0 ml/kg/hr. A diurnal rhythm in the rate of oxygen consumption similar to that seen in the case of control is found only on the first day on the experiment (January 10). The lowest rate of the consumpsion (66ml/kg/hr) occurred at 8 a. m., and the peak of the consumption occurred at 2 p. m. (150ml/kg /hr) on that day. On the 2nd day, however, there was no rhyhm in the rate of consumption. The lower rate of consumption continued on the next day (January 12). Small increase in
con-Fig. 6.
2 8 14 20 2 8 14
TIME OF DAY (hour)
Diurnal variation of rate of oxygen consumption under continuous dark
condition ('dark'). Vertical bar at each point represents the standard error. Where no bars are given, standard error was negligibile.
JAN 12 JAN 13 *—<>. •o—$ ga«*a*gnaKPagEBaai5Han»gisaragaMg^^ 20 8 14
5 §
UJ UJsumption (50 ml/kg/hr) occurred at 2 p. m. on the 3rd day. That small peak decreased again to 16 ml/kg/hr. Thereafter the consumption increased gradually to 80 ml/kg/hr on January 13, the 4th day of the experiment.
The amount of oxygen consumption was lower in this experiment than in the case of the
control and light experiments. There is generally no evident rhythm in this condition. Coefficient of the rhythm strength was. 0.643.
D. 12 hour alternating light and dark
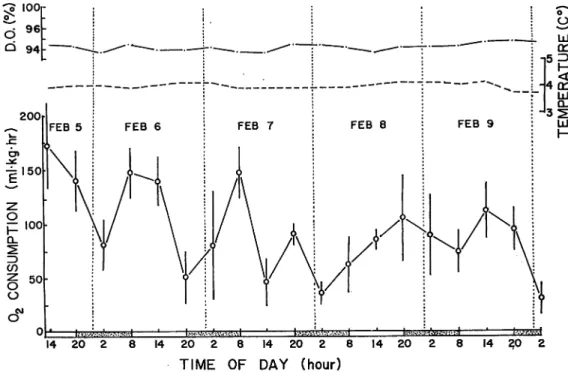
The data obtained from the experiment in 12-hour alternating light and dark are presented in
Fig. 7. The water temperature and the oxygen content in the experimental tank were almost
constant throughout the experiment.
During the experiment, average rate of oxygen consumption was 97.3±8.6 ml/kg/hr. The experiment began under light condition on February 5. The amount of oxygen consumed in that condition was 172 and 140 ml/kg/hr. When the light was turned off, the rate of consump
tion decreased to 79 ml/kg/hr at 2 a. m. on February 6. At 8 a. m., while the dark condition still
continued, the rate of consumption increased to about 150 ml/kg/hr. Then, the light was turned on, the rate of consumption was 140 ml/kg/hr at 2 p. m., but was 50 ml/kg/hr at 8 p. m. In the second period of darkness (February 6-7), the consumption increased from 50 to 147 ml/kg/hr.
On February 7, 6 hours after the light was turned on (2 p. m.), the rates of consumption decreased suddenly to 45 ml/kg/hr. After 12 hours of light (8 p. m.), the rate of consumption increased to
TIME OF DAY (hour)
Fig. 7. Diurnal variation of rate of oxygen consumption under alternating light and dark every twelve hour ('12-hour'). Vertical bar at each point represents the standard error. Where no
HlRATA : Diurnal Rhythm of Metabolic and Activity Rates in Juvenile Atlantic Salmon 85
90 ml/kg/hr.
During the first two or three days, as mentioned above, the rates of oxygen consumption fluctuated independently of the light or darkness. Thereafter, the rate of the consumption dec reased in dark and increased in light. For instance, at 8 a. m. on February 8, when light was
turned on, the rate of oxygen consumption increased gradually from 62 to 85 or 104 ml/kg/hr. Then the light was turned off, the rate decreased graduallyto 89 and 74ml/kg/hr. At 2p. m. on that day, six hours after the light was turned on, the consumption increased to 113 ml/kg/hr.
Then, with the light off, the oxygen consumptiondecreased again from about 100to 35 ml/kg/hr (February 10).
In 12-hour alternating light and dark, oxygen consumption shows a 24-hour rhythm. It is observed that the rhythm shown during this experimental period can be divided into two cases.
The rhythm in the first case (Februany 5-7) doesnot depend upon light. The second is the latter
half (February 7 to 10). During this period, the rhythm depends upon light. It is also observed that the amount of oxygen consumed during the experimental period is not so variable, and
ranges from 50 to about 125ml/kg/hr in each day. Coefficient of the rhythm strength was
1. 265, and it is regarded as being statistically significant.
E. 6 hour alternating light and dark
The mean rates of oxygen consumption of the three fish (Table 1) used in the experiment, at various times of day and night are shown in Fig. 8, in the same way as in the case of control.
Fig. 8, FEB 8 ±1 FEB 9 lW,.y:.| o UJ UJ UJ teEHSfc 8 ±1 l>W«l 14 20 2 8 14 20 2
TIME OF DAY (hour)
Diurnal variation of rate of oxygen consumption under alternating light and dark every six hours ('6-hour'). Vertical bar at each point represents the standard error. Where no bars are given, standard error was negligible.
Experimental conditions such as water temperature and oxygen content in the tank are the same as in the previous experiment (Fig. 7, '12-hour'). Thsse factors were almost constant throughout
the experiment.
During the first two days, the amount of oxygen consumeddecreasedfrom 193to 47 ml/kg/hr without showing any rhythmic pattern. Thereafter, however, the rate of consumption depended upon light. That is, the rate of oxygen consumption increased from 47 to 88 ml/kg/hr at 2 a. m. on February 7 (light-on). Then, when the light was turned off, rate of consumption decreased suddenly to a minimum of 8 ml/kg/hr (the lowest throughout this investigation). Again when the light was on, oxygen consumption increasedto 99 ml/kg/hr at 2p. m. on that day. The typical example of this event was found between 8 a. m. on February 8 to 2 a. m. on February 9. During this period, the rate of oxygen consumption increased in light and decreased in dark, and showed
as 12-hour rhythm.
In the latter half of the expermental period, the amount of oxygen consumed increased gradu ally from 8 (8 a. m., February 7) to 97 ml/kg/hr (2 p. m., February 9). During the latter part of the experiment, the variation in the rate of oxygen consumption depended upon the presence or
absence of light. In general, coefficient of the rhythm strength in this experiment was 0. 846. 2. Activity
A. Feeding
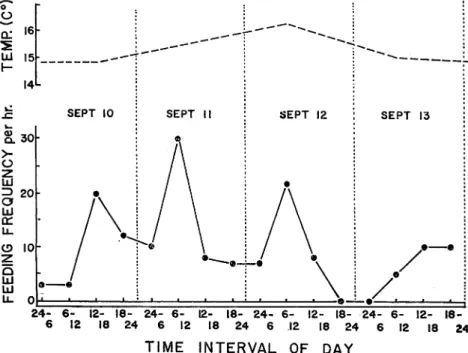
The rates of the feeding activity of ten fish which were kept together in the same tank under 'control' condition are shown in Fig. 9. To analyse the pattern of rhythm, feeding frequency
(per hour) of each day was divided into four parts (viz. midnight to 6 a. m., 6 a. m. to noon,
24- 6- 12- 18- 24- 6- 12- 18- 24- 6- 12- 18- 24- 6- 12-
18-6 12 18 24 6 12 18 24 6 12 18 24 6 12 18 24
TIME INTERVAL OF DAY
Fig. 9. Diurnal variation of rate of feeding activity under 'control' condition in the
HlRATA : Diurnal Rhythm of Metabolic and Activity Rates in Juvenile Atlantic Salmon 87
noon to 6 p.m., and 6 p.m. to midnight). The water temperature in the experimental tank
ranged from 14.1 to 15. 4 C° throughout this experiment (Fig. 9).
The rates of feeding activity of the fish show a variation that may be related to day and
night. It is to be observed that rate of feeding during the day is generally greater than that
during the night. Especially, the trend is well marked on the 2nd and 3rd days of the experi
ment. During these days, a diurnal rhythm is seen. The peaks of the feeding frepuency occur at 8 a. m., and lowest rates of feeding occur in the night. On September 10 (1st day of the experi ment), peak of the feeding activity occurs between noon and 6 p.m. An exception, however, is seen in the case of September 13, when only 10 frequencies per hour were recorded between
noon and midnight. Coefficient of the rhythm strength in the fish feeding was 0. 847 during the
experiment.B. Movement.
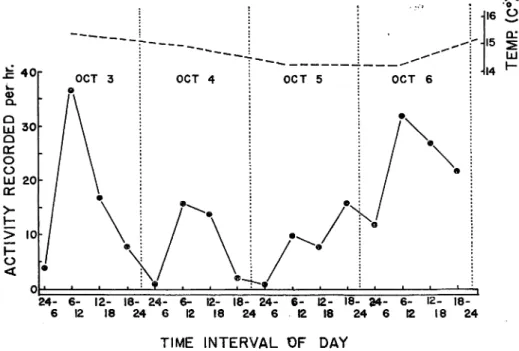
Diurnal variations in the rates of movement (activity) of three fish which were kept together
in the activity chamber under control conditions are shown in Fig. 10, in the same way as in the case of feeding activity. The water temperature in the experimental tank ranged from 14. 1 tol5.4C°.
The movement activity showed a clear diurnal rhythm during the first two days: Higher
rates of movement were found in the daytime (6 a. m. to 6 p. m.) than at night (6 p. m. to 6 a. m.), during those days. However, there appears to be no diurnal rhythm at the latter half of the experimental period. The movements increased gradually from 1 (between midnight to 6 a. m.
on October 5) to 32 (between 6 a. m. to noon on October 6) frequencies per hour, and did not
24- 6- 12- 18- 24- 6- 12- 18- 24- 6- 12- 18- fc4- 6- 12-
18-6 12 18 24 6 12 18 24 6 12 18 24 6 12 18 24
TIME INTERVAL OF DAY
Fig. 10. Diurnal variation of rate of movement under ordinary condition in the hatchery
show any diurnal rhythm. On October 6, much frequency (22 to 32 per hour) was found during both day-and night-time, but a peak in the frequency of movement occurred in the morning.
Discussion
1. Rhythm patterns.
A. Oxygen consumption in different condition
In each condition, the rates of oxygen consumption during the first one or two days are
fluctuative (viz. 'control', '12-hour') and on the decrease (viz. 'light', 'dark', '6-hour'). There
after, the fluctuations become to be a regular ('control', '12-hour', '6-hour'), or no rhythm
('light', 'dark'), which depend upon the light. It is considered that this event is due to the fish adaptation to the experimental condition. Especially, in the cases of continuous light and dark, it is also presumed that the decrease or non-fluctuation of the rates of oxygen consumption is
due to physiological fatigue (Mori, 1948) which was caused while constant condition lasted.
On the other hand, the interesting point in the study of rhythmic aspects is whether the fish show an exogenous or endogenous rhythm. In general, typical diurnal rhythm of oxygen con sumption was found in the cases of 'control' and '12-hour' conditions. In these cases, the rates of consumption increased in the daytime or light-on condition, and decreased in the nighttime or light-off condition. The rate of oxygen consumption in '6-hour' condition showed a 12-hour
rhythm (like twilight rhythm) according to the light-on or -off, but there was no diurnal rhythm.
On the contrary, the diurnal variation of the oxygen consumption did not show any rhythm in the cases of 'light' and 'dark'. From the results, it is concluded that the rate of the oxygen consumption in fish shows an exogenous rhythm which occurs as immediate responses to light change. Fig. 11. witf LU 40 3 _1 30 < > 20 LU 10 O < 0 K UJ 40 > < 30 U. o 20 LU 10 O < 0 h-Z 40 UJ 30 UJ 20 Q-10
Lilli,
2 Consumption Feeding Movement 2 8 14 20 TIME OF DAYIvylhm patterns of oxygen consumption, feeding and movement percentage of the variations in average at various times of day.
HlRATA : Diurnal Rhythm of Metabolic and Activity Rates in Juvenile Atlantic Salmon 89
B. Relationship bet-ween the rates of oxygen consumption and of feeding and movement
To facilitate comparison between rhythm patterns of oxygen consumption, feeding and move ment, the histograms of average variation at various times in percentage are shown in Fig. 11. When considering the histograms, peaks of rhythm are different between oxygen consumption and both feeding and movement. That is, a clear peak of oxygen consumption occurs at 2 p.m., while the peaks of feeding and movement occur in the morning. It is to be considered that this event is originated from "biological hysterisys" (Mori, 1948, Kobayashi and Watabe, 1958) and due to the specific dynamic action SDA (Shirai, 1950) which is well known in the field of energy metabolism. That is, a lot of oxygen is consumed by the animals a few hours after feeding, in order to digest the food. In this conneotion, Hirata (1960 b) has also observed in the relation between feeding and respiration in goldfish.
2. Effect of light duration on the oxygen consumption
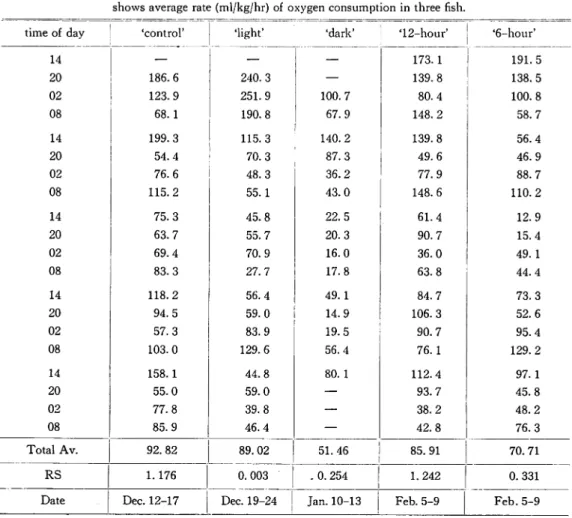
Table 2 shows the influence of light duration upon the amount of oxygen consumption. In the control, average amount of oxygen consumption was 92. 8 ml/kg/hr, and this value was the
Table 2. Rates of oxygen consumption under different light duration. Each value shows average rate (ml/kg/hr) of oxygen consumption in three fish.
time of day 'control' •light' 'dark' '12-hour' '6-hour'
14 — — — 173.1 191.5 20 186.6 240.3 — 139.8 138.5 02 123.9 251.9 100.7 80.4 100.8 08 68.1 190.8 67.9 148.2 58.7 14 199.3 115.3 140.2 139.8 56.4 20 54.4 70.3 87.3 49.6 46.9 02 76.6 48.3 36.2 77.9 88.7 08 115.2 55.1 43.0 148.6 110.2 14 75.3 45.8 22.5 61.4 12.9 20 63.7 55.7 20.3 90.7 15.4 02 69.4 70.9 16.0 36.0 49.1 08 83.3 27.7 17.8 63.8 44.4 14 118.2 56.4 49.1 84.7 73.3 20 94.5 59.0 14.9 106.3 52.6 02 57.3 83.9 19.5 90.7 95.4 08 103.0 129.6 56.4 76.1 129.2 14 158.1 44.8 80.1 112.4 97.1 20 55.0 59.0 — 93.7 45.8 02 77.8 39.8 — 38.2 48.2 08 85.9 46.4 — 42.8 76.3 Total Av. 92.82 89.02 51.46 85.91 70.71 RS 1.176 0.003 - 0. 254 1.242 0.331
greatest among five light conditions. The lowest rate of oxygen consumption was found in the case of continuous dark condition (50. 6 ml/kg/hr).
Statistical analyses show that there is no significant difference between control and 12-hour at the 95^ confidence level. Also when comparing the control-light, -dark and -6-hour, the first two groups show significant difference, (t: 0.01 and 0. 05), while in the last group the di fference from control and dark condition is highly significant.
From these results, it is found out that prolonged light or dark conditions cause injurious influence on the oxygen consumption. While the t12-hour> condition is similar to the control, the ^-hour' condition is considerable different.
On the other hand, daily amount of oxygen consumption is also influenced by different light
Table 3. Daily variation of the amount of oxygen consumed (ml/kg/hr)
by three fish in each condition.
day after
exp. start control 12-hour 6-hour dark light
1 2 3 4 5 144.5 79.9 83.7 103.2 72.9 135.4 104.0 63.0 89.5 70.3 122.4 75.6 30.5 87.6 66.9 101.3 30.5 27.8 52.0 199.6 54.9 52.7 45.2 45.2 coef. of variation 0.269 0.281 0.389 0.558 0.670
duration. The daily variation of the amount in each condition is shown in Table 3. The lowest
variation of 0. 269 was found in the case of the control, while continuous light condition shows the highest variation of 0. 67 (Table 3). To explain in more detail, one may classify the coeff-cient of variation into two categories from this table. That is, the first category contains control,
12-hour and 6-hour (0. 269, 0. 281 and 0. 389). The second category contains dark and light (0. 558 and 0. 670). When comparing the decreasing rate of oxygen consumption for the first two days, the value of the first category shows a gradual decrease while that of the second category shows a sharper decrease than the first one.
Therefore, it is also said that control and alternating light or dark conditions are different from continuous conditions. That is, continuous conditions resulted in decreased oxygen con sumption when compared with alternating conditions. Namely, it is concluded that considerable daily variations of environmental factors are very important for their respiration.
Hirata (1960 a) has emphasized that the inflection point of temperature changes, d2T\dt2, (here, T: temperature and t: time) is one of the important factors for the goldfish feeding and growth as a stimulus. From the present investigation, it is also considered that d2L\dt2 (here,
L: light and t: time) is an important factor for the salmon metabolism being similar to d2Tjdt2
in the case of goldfish feeding. It is able to suggest that d2Tjdt2 and d2L\dt2 are effective factors for both warmer (viz. Carpio) and colder (Salmonoid) fish.
HlRATA : Diurnal Rhythm of Metabolic and Activity Retes in Juvenile Atlantic Salmon 91
Summary
1. The experiments on the diunral rhythm in young Atlantic salmon were carried out in the hatchery during September to February. The oxygen consumptions of three fish were measured
at several times (2 a. m., 8 a. m., 2 p. m., 8 p. m.) by modified Tamura's method under the condi tions of 'control', 'light', '12-hour' and '6-hour\ Rates of feeding (ten fish) and movement (three fish) were recorded with simple feeding recorder and actographer under just 'control' condition. Each experiment lasted for four or five days. Temperature and oxygen content in the water were kept almost constant during each experiment.
2. In the cases of oxygen consumption, considerable fluctuations ('control', '12-hour, '6-hour') or decreases ('light', 'dark') of the rates are observed during the first one or two days of each experiment. Later, the fluctuations or decreases become to be a regular ('control', '12-hour', '6-hour) or no rhythm ('light', 'dark'). From the events, it is considered that the fish take one or two days to adapt to the experimental condition due to the physiological fatigue.
3. The rate of oxygen consumption in the 'control' shows a variation that may be related to day and night. Higher rates of consumption show in the daytime, generally, and lower rates were seen during the nighttime. On the contrary, there is no diurnal rhythm in the cases of continuous light and dark conditions. After two or three days, the rates of oxygen consumption
in the cases of alternating every 12-hour and 6-hour depend upon the light-on or -off, and
show 24-hour-rhythm and 12-hour-rhythm, respectively. It is to be presumed from the results
that the daily variation of the rate of oxygen consumption shows an exogenous rhythm from
those which are under the control of light factor.
4. The rates of feeding and movement show a diurnal rhythm like a rate of oxygen con sumption. Only one point of difference between oxygen consumption and both feeding and movement is generally found in the time of their peak occurrence. That is, the peak of rate of oxygen consumption occurs at 2 p. m. while the peaks of both feeding and movement occur in
the morning on the whole. It is to be considered that the maximum rate of oxygen consumption is due to the specific dynamic action (SDA) which occurred a few hours after their feeding and
caused by the food digestion.
5. Daily amount of oxygen consumed is influenced by different light duration. In the control, average amount of oxygen consumed was 92. 8±9. 8 ml/kg/hr, and was the greatest among
the conditions. The lowest rate of oxygen consumption was found in the case of continuous dark
condition (51. 5 ml/kg/hr). The coefficient of daily variation of the amount is divided into two categories. That is, the first category contains control, 12-hour and 6-hour. The second category contains dark and light conditions. When compared with the decreasing rate of oxygen con sumption for the first two days in each experiment, the first category shows gradual decreases while the second category shows sharper decrease. Therefore, continuous light or dark con dition caused more injurious influence on the oxygen consumption than under the alternating
condition.
LITERATURE CITED
ALI, M. A. Histological studies on the juvenile Atlantic salmon (Salmo salar) retina. II. Responses to light
BROWN, F. A. Jr. (1957) : Biological chronometry. Amer. Nat., 91,129-133. BROWN, F. A. Jr. (1959) : Living clocks. Sci, 130,1535-1544.
CLAUSEN, R. G. (1936) : Oxygen consumption in fresh water fishes. Ecol., 17 (2), 216-226. HARKER,J. E. (1958) : Diurnal rhythms in the animal kingdom. Biol. Rev., 33 (1), 1-52.
HIRATA, H. (1955) : Behaviour of chum salmon (Oncorhyncus keta) fry during their seaward migration.
B. Thesis, Univ. Hokkaido, (in Japanese).
HlRATA, H. (1957) : Diurnal rhythm of feeding activity of goldfish in winter and early spring. Bull. Fac. Fish., Hokkaido, Univ. 8, 96-107.
HlRATA, H. (1958) : Diurnal rhythm of feeding activity of goldfish and water temperature. Aqui-culture,
5, 46-50, (in Japanese).
HlRATA, H. (1960 a) : Diurnal rhythm of the feeding activity of goldfish with special reference to the in flection point of temperature changes. Bull. Japan. Soc. Sci Fish., 27 (8), 783-791.
HlRATA, H. (1960 b) : Diurnal rhythm of fish. Dr. Thesis, Hokkaido, Univ, (in Japanese).
HlRATA, H. and S. KOBAYASHI (1956) : Diurnal rhythm of the feeding activity of goldfish in autumn and early winter. Bull. Fac. Fish., Hokkaido, Univ. 6, 235-248.
HOAR, W. S. (1942) : Diurnal variations in feeding activity of young salmon and trout. J. Fish. Res. Bd. Can., 6 (1), 90-101.
II, K., K. INOUE, H. TSUGE, R. OGAWA, and K. UCHIHASHI (1952) : Studies on nocturnal rhythm in fish. Bull. Japan. Soc. Sic. Fish. 17 (3), 307-355, (in Japanese),
KAWAMOTO, N. (1957) : "FishPhysiology', (Ishizakishobo, Tokyo), (in Japanese).
KOBAYASHI, S. and H. HlRATA (1957 a) : Fffects of X-irradiation upon rainbow trout (Salmo irideus).
I. Influence on the feeding activity in rainbow trout fry. Bull. Fac. Fish., Hokkaido, Univ. 8,23-35. KOBAYASHI, S. and H. HlRATA (1957 b) : How should the time of food supply be controlled in fish
culture? Rept. 7 th Meeting of Indo Pad. Fish. Council, Special No. 43.
KOBAYASHI, S., R. YUKI, and H. HlRATA (1956) : A preliminary test for recording the feeding activity
in fish. Bull. Fac. Fish., Hokkaido, Univ. 6. 235-238.
KOBAYASHI, S. and T. WATABE (1959) : "Studies on the pearl", (Giho-do, Toko), (in Japanese). KOBAYASHI, T. (1958) : Ecological study of chum salmon (Oncorhyncus keta) fry. V. Behaviour of
seaward migration. Bull. Fish. Res. Hokkaido, 12,21-30, (in Japanese).
KOBAYASHI, T., A. OZAKI, AND Y. ITO (1956) : Ecological study of chum salmon (Oncorhyncus) keta) fry. VI. Bull. Fish. Res. Hokkaido, 11,1-5, (in Japanese).
MORI, S. (1945 a) : General study of relation between diurnal rhythm of animal and environmental
factors. Physiol. Ecol., Univ. Kyoto, 39, 1-42, (in Japanese).
MORI, S. (1945 b) : Originated diurnal rhythm of individuals. Physiol. Ecol., Univ. Kyoto, 18, 1-10, (in Japanese).
MORI, S. (1957) : "Diurnal rhythm of animals', (Hopposhuppan-sha, Sapporo, Hokkaido), (in Japanese). NEAVE, F. (1942) : Diurnal fluctuations in the upstream migration of coho and spring salmon. J. Fish.
Res. Bd. Can., 6 (2), 158-168.
NISHIYAMA, T. (1957) : Feeding, digestion and exeretion of goldfish (Carassius auratus). B. Thesis, Univ.
Hokkaido, (in Japanese).
NISHIYAMA, T. Brain waves in Salmonoid. Bull. Fac. Fish., Hokkaido, Univ. (in press).
REINBERG and H. J. GHATA (1957) : "Rythmes et CyclesBiologiques\ (Que sais-ju? No. 734, Press. Univ.
France).
SHIRAI, I. (1953) : "Energy Metabolism/'lfroc/tfm. Handbook, (Gho-do, Tokyo), (in Japanese).
SPENCER, W. P. (1939) : Diurnal activity rhythms in fresh water fishes. Ohio J. Sci., 39, 119-132.
SPOOR, W. A. (1946) : A quantitative study of the relationships between the activity and oxygen con
sumption of the goldfish. Biol. Bull, 91, 312-325.
TAMURA, T. (1935) : A method of oxygen consumption in fish. Bull. Japan. Soc. Sci. Fish. 38 65-70, (in Japanese).
TAMURA, T. (1939) : Effects of environmental factros upon the metabolism in fish. II, Bull. Japan. Soc,
HlRATA : Diurnal Rhythm of Metabolic and Activity Rates in Juvenile Atlantic Salmon 93
TAMURA, T. (1940 a) : Fffects of environmental factors upon the metabolism in fish. III. Bull. Japan. Soc.
Sci. Fish., 46,12-26.
TAMURA, T. (1940 b) : Effects of environmental factors upon the metabolism in fish. IV. Ibid. 47. 55-66. TAMURA, T. (1943) : Effects of environmental factors upon the metabolism in fish. V. Ibid., 51, 61-71.
TAMURA, T. (1944) : Effects of environmetal factors upon the metabolism in fish. VIII. Ibid. 52, 50-63.
TAMURA, T. (1949) : Effects of environmental factors upon the metabolism in fish. IX. Ibid. 54, 40-47. TAMURA, T. (1950) : Effects of environmental factors upon the metabolism in fish. XL Ibid. 57,78-93. TAMURA, T. (1956) : "Fish Cultivating Biology", (Kigen-sha, Tokyo).