Original paper (regular paper)
1. Introduction
Physiologically active bacteria are only a part of the diverse bacterial populations present in natural environ-ments1,3,16,27). Determining the bacterial growth activity in
natural environments is important for understanding bacte-rial habitats, survival, and growth conditions. Respiration, enzymatic activity, and incorporation of specifi c substances have been used as indicators of bacterial physiology or growth activity12,19,22,25,29). The rate of incorporation of thymidine,
leucine, or their analogs is widely used for the measurement of bacterial growth rate in environments7,8). However, these
methods have some limitations when determining the growth activity of a specifi c bacterial species in a natural environ-ment, because samples need to be incubated, thus causing changes in bacterial activity. gyrB is a housekeeping gene
that encodes the B subunit of bacterial DNA gyrase, which plays an essential role in DNA replication. Regulation of
gyrB transcription is associated with the cell cycle in each
cell18), and hence, gyrB mRNA expression may be used as an
indicator of bacterial growth. To investigate the relationship between bacterial growth and gyrB mRNA expression, we
quantifi ed the copy number of gyrB mRNA in Escherichia coli at each growth phase using real-time reverse
transcrip-tion (RT)-PCR. Furthermore, we evaluated the utility of
measuring gyrB gene expression by comparing it with the
conventional direct viable count (DVC) method14).
Consumption of water contaminated by human or animal feces is an important cause of intestinal and systemic illnesses. Estimates of the total coliform count are routinely used to monitor fecal contamination in water, but the US Environ-mental Protection Agency has stated that E. coli counts
provide a better indicator of water quality28). Furthermore,
a previous study showed that amount of this bacterium can be used as a major indicator of fecal contamination in the river environment2), while other reports have suggested that
E. coli can grow in soil6,24). However, studies have shown
that E. coli is non-culturable under adverse conditions, such
as low nutrient availability and/or low temperature20,21). The
present study investigated gyrB expression in E. coli to better
understand the habitat of this bacterium in natural river environments.
2. Materials and Methods 2.1. Bacterial strains and growth conditions
Experiments were performed using E. coli K-12 W3110, Shigella sonnei IID 969, Salmonella enteritidis IID 604, Salmonella enterica serovar Choleraesuis IID1682, and Vibrio vulnifi cus ATCC 27562. E. coli was cultured in
Luria-Expression of the gyrB gene as an indicator of
growth activity of Escherichia coli
Katsuji Tani
2*, Takeshi Kobayashi
1, Akiko Sakotani
2, Takehiko Kenzaka
2and Masao Nasu
11 Environmental Science and Microbiology, Graduate School of Pharmaceutical Sciences, Osaka University,
1–6 Yamada-oka, Suita, Osaka 565–0871, Japan
2 Environmental Science and Microbiology, Faculty of Pharmacy, Osaka Ohtani University,
3–11–1 Nishikiori-kita, Tondabayashi, Osaka 584–8540, Japan
* Tel & Fax: +81–721–9742 * E-mail: [email protected] (Received; 16 November, 2011/Accepted; 7 May, 2012)
To determine whether the DNA gyrase gene (gyrB) can be used as an indicator of bacterial growth activity, its expression
levels were estimated in Escherichia coli under diff erent growth conditions. E. coli was cultured in liquid medium at various
temperatures, and its nucleic acid was extracted and purifi ed. The copy numbers of gyrB mRNA in the log, log-stationary,
and stationary phase cultures in Luria-Bertani broth at 37°C were 4.7, 0.015, and <10–6 (below the detection limit),
respec-tively. When the generation times of E. coli were 0.42, 1.5, 5.3, and 9.9 h, the respective ratios of gyrB mRNA to DNA were
4.7, 1.5, 0.15, and 0.09. gyrB mRNA was expressed at high levels in growing E. coli cells. Nucleic acids were extracted from
surface river water and river sediment samples. The ratio of gyrB mRNA to DNA for the E. coli-Shigella group was 1.3 in
the river sediment sample and 0.008 in the surface river water sample. These results suggest that gyrB mRNA expression
can be used as an indicator of bacterial growth activity and that the river sediment is a potential natural reservoir for the E. coli-Shigella group.
Bertani (LB) broth (0.5% NaCl, 1% tryptone, 0.5% yeast extract) at 37°C or M9 medium (0.5% glucose, 100 μM CaCl2, 200 mM MgSO4, 1.36% Na2HPO4, 0.6% KH2PO4,
0.1% NaCl, and 0.2% NH4Cl) at 20, 22, or 25°C. Shi. sonnei, Sal. enteritidis, and Sal. enterica serovar
Choler-aesuis were cultured in LB broth at 37°C. V. vulnifi cus was
cultured in LB broth (3% NaCl) at 37°C.
2.2. Simultaneous recovery of RNA and DNA
RNA and DNA were recovered from E. coli cultures
using the Qiagen RNA/DNA System Midi Kit (Qiagen. K. K., Japan) according to the manufacturer’s instructions. RNA and DNA were simultaneously recovered from the surface river water and river sediment samples using the method described by Hurt et al.10) with modifi ed
concentra-tions of sodium dodecyl sulfate and cetyltrimethylammonium bromide in the extraction buff er23). The extracted DNA and
RNA were dissolved in 100 μL of TE buff er (pH 8.0) and 80 μL of Tris-HCl (50 mM, pH 7.5), respectively. Twenty units of DNase I (Roche Diagnostics, Indianapolis, IN), 10 μL of 60 mM MgCl2, and 10 μL of 20 mM CaCl2 were
added to the RNA sample, and the mixture was incubated for 30 min at 37°C. After incubation, RNA was precipitated with isopropanol and resuspended in 100 μL of TE buff er (pH 7.5). Recovered RNA and DNA samples were stored at –80°C and –20°C, respectively.
2.3. Preparation of standard DNA and RNA
E. coli was cultured in LB broth at 37°C. Stationary
phase cultures were sampled and nucleic acids were extracted and purifi ed as described by Tsai and Olson26). In brief,
nucleic acids were incubated with 100 μg mL–1 ribonuclease
A (Sigma-Aldrich Co., St. Louis, MO) for 30 min at 37°C to digest RNA, then purifi ed using Tris-EDTA-buff ered phenol-chloroform-isoamyl alcohol (25 : 24 : 1, pH 8.0) and ethanol precipitation as described by Iwamoto et al.11),
and dissolved in TE buff er [10 mM Tris-HCl (pH 8.0) and 1 mM EDTA]. Extracted DNA was analyzed by electropho-resis (100 V, 30 min) on ethidium bromide-stained agarose gels (1%, wt/vol) to confi rm the purity of chromosomal DNA, i.e., without any fragmentation or contamination with RNA. DNA concentration was determined by PicoGreen (Molecular Probes Inc., Eugene, OR) DNA staining, and a standard curve was constructed using a series of lambda phage DNA (Takara Bio Inc., Japan) solutions (serial dilu-tions, 10–1,000 ng mL–1) in TE buff er. The lambda phage
DNA and bacterial DNA samples were diluted 100- or 1,000-fold with TE buff er and stained with 1/400 volume of PicoGreen in a 96-well microplate. Fluorescence intensity (emission at 530 nm) was measured using a fl uorescence multi-well microplate reader (CytoFluor II; PreSpetive Biosystems Inc., Framingham, MA) at an excitation wave-length of 485 nm. The copy number of genomic DNA was calculated using the measured DNA concentration and the molecular weight of each E. coli W3110 chromosomal DNA
(5.0×10⁻¹⁸ g molecule–1).
A plasmid (pGEM T-Easy Vector; Promega Co., Madison, WI) containing the gyrB insert cloned from E. coli W3110 was
constructed.The gyrB insert was amplifi ed by PCR with the primers ESgyrB171F and ESgyrB448R (Table 1). The plasmid DNA was linearized using NdeI (Molecular Biosystems Inc., San Diego, CA). In vitro transcription was performed using
SP6/T7 transcription kit (Roche Diagnostics, Indianapolis, IN). To eliminate DNA contamination, RNA was digested with DNase I (Roche Diagnostics, Indianapolis, IN).
Measurement of RNA concentration was performed using the RiboGreen RNA quantifi cation kit (Molecular Probes Inc., Eugene, OR). The standard curve was generated with a series of 16S rRNA solutions (serial dilutions, 10–1,000 ng mL–1)
using the 16S rRNA standard solution included in the kit. 16S rRNA and in vitro transcripts of E. coli W3110 gyrB
clone were stained with 1/400 volume of RiboGreen in a 96-well microplate. The fl uorescence intensity (emission at 530 nm) was measured using a fl uorescence multi-well microplate reader (CytoFluor II; PreSpetive Biosystems Inc., Framingham, MA) at an excitation wavelength of 485 nm.
2.4. Real-time PCR and real-time RT-PCR of E. coli gyrB DNA and mRNA
The LightCycler system (Roche Diagnostics, Indianapolis, IN) was used for real-time PCR and real-time reverse tran-scription (RT)-PCR of E. coli gyrB DNA and mRNA. To
quantify the gyrB DNA from E. coli, LightCycler DNA
Master Hybridization Probes (Roche Diagnostics, Indianap-olis, IN) were used with 5 mM Mg2+, 0.5 μM of each primer
(ESgyrB171F and ESgyrB448R), and 0.2 μM of each FRET probe [ESgyrB376 (3'-FITC) and ESgyrB404 (5'-LightCycler-Red640)] (Table 1). After an initial denaturation at 95°C for 10 min, 50 PCR cycles at 95°C for 15 s, with annealing at 66°C for 5 s and an extension at 72°C for 25 s, were conducted. A standard DNA template of 5 to 5×10⁶ copies per reaction
of E. coli W3110 genomic DNA was used to construct a
standard curve for real-time PCR quantifi cation. To quantify
gyrB mRNA of E. coli, LightCycler FastStart RNA Master
Hybridization Probes (Roche Diagnostics, Indianapolis, IN) were used with 3.25 mM Mn2+, primers (ESgyrB171F and
ESgyrB448R), and FRET probes [ESgyrB376 (3’-FITC) and ESgyrB404 (5’-LightCycler-LCRed640)]. After reverse transcription for 15 min at 61°C for 15 min, 50 PCR dena-turation cycles at 95°C for 1 s, with annealing at 64°C for 10 s and an extension at 72°C for 15 s, were conducted. A standard RNA template of 5 to 5×10⁷ copies per reaction
of in vitro transcripts of the E. coli W3110 gyrB clone was
used to construct a standard curve for real-time RT-PCR quantifi cation.
LightCycler data were analyzed using LightCycler soft-ware version 3.5 (Roche Diagnostics, Indianapolis, IN). The concentrations and crossing points were calculated, which represented the threshold cycle numbers where the fl uores-cence signal fi rst exceeded the level of the background noise. These were obtained using the second derivative maximum function of LightCycler software, together with
propor-tional and arithmetic baseline adjustments that were made according to the manufacturer’s instructions. The standard curve was generated by linear regression of the crossing point versus the logarithms of the concentrations for each standard sample.
2.5. Recovery rate of DNA and RNA
To determine the DNA and RNA recovery rates, internal standards of DNA and RNA were added to each sample and the internal standards were quantifi ed by real-time PCR and real-time RT-PCR, respectively, after recovery. The luciferase gene was used as the internal standard because it was absent from samples used in the present study. A 1.7-kb PCR amplicon of the luciferase gene was used as the internal DNA standard and a 1.8-kb in vitro transcript of the luciferase
gene clone was used as the internal RNA standard. Real-time PCR and real-Real-time RT-PCR of the luciferase gene and in vitro transcripts used pgL1908f (forward primer),
Luc175r (reverse primer), n-LucHP1 (probe 1 for FRET), and n-LucHP2 (probe 2 for FRET) (Table 1). The luciferase gene was quantifi ed using LightCycler DNA Master Hybrid-ization Probes (Roche Diagnostics, Indianapolis, IN) with 5 mM Mg2+, 0.5 μM of each primer, and 0.2 μM of each
FRET probe. After an initial denaturation at 95°C for 10 min, 40 PCR denaturation cycles at 95°C for 15 min, with annealing at 60°C for 10 s and an extension at 72°C for 15 s, were conducted. Luciferase transcripts were quanti-fi ed using LightCycler-FastStart RNA Master Hybridization Probes (Roche Diagnostics, Indianapolis, IN) with 3.25 mM Mn2+. After reverse transcription at 61°C for 20 min, 40 PCR
denaturation cycles at 95°C for 1 s, with annealing at 60°C for 10 s and an extension at 72°C for 15 s, were conducted.
2.6. Sampling of E. coli culture
The relationship between the copy number of gyrB mRNA
(gyrB mRNA expression) and the growth rate was
deter-mined using E. coli W3110 cultured in LB broth at 37°C,
which was measured at a wavelength of 610 nm. Log, log-stationary (end of log phase), and log-stationary phase cultures were sampled. To determine the relationship between gyrB
mRNA expression and growth rate, E. coli W3110 was
cultured in M9 medium (containing 0.5% glucose) at 20, 22, or 25°C. The log phase culture was sampled and 109
cells were collected on a 0.2-μm pore size polycarbonate membrane fi lter (Advantec, Japan). The generation time was calculated using the following formula:
Generation time=log2/μ μ=specifi c growth rate
The specifi c growth rate was calculated from OD610
measurements (μ=Δln OD610/Δt, where t is time).
2.7. Enumeration of growing bacterial cells
The number of growing bacterial cells was enumerated using the method of Kogre et al.14) with minor modifi
ca-tions. E. coli was incubated in LB broth at 37°C. Based
on the growth curve of E. coli, sampling time points were
selected to obtain cultures for total direct count (TDC) and DVC. The sampling time points were 1.5 h (log phase), 3.5 h (log-stationary phase), and 24 h (stationary phase). Samples for TDC were fi xed with 2% formaldehyde neutral buff er solution (2%; Nacalai Tesque, Japan). Samples for DVC were incubated in LB broth containing 20 μg mL–1 nalidixic
acid (Wako Pure Chemical Industries Ltd., Japan) at 37°C. After 1 h, they were fi xed with formaldehyde neutral buff er solution. Each fi xed sample was stained with 4’,6-diamidino-2-phenylindole (DAPI) and counted using an epifl uorescence microscope (Eclipse 80i; Nikon Co., Japan).
2.8. Sampling of surface river water and river sediment Surface river water and river sediment was sampled at Kuwazu from the Inagawa River in Hyogo, Japan. Surface river water was collected in a sterilized polyethylene terephthalate copolyester bottle, which was returned to the lab at 4°C in the dark. River sediment sampling was performed in triplicate. Sediment samples were transported to the lab in an ethanol/dry-ice bath. The surface river water sample was fi ltered through a 0.2-μm pore size polycarbonate membrane fi lter and at least 109 bacterial cells were collected
on the fi lter. RNA and DNA were recovered from the fi lter or 2 g (wet weight) of the river sediment. The sediment was Table 1. Primers and probes for real-time PCR
Primer and probe Target gene Target position Sequence
ESgyrB171F (forward primer) gyrB gene of E. coli 171–194d 5’-aga aat tat cgt cac cat tca cgc-3’
ESgyrB448R (reverse primer) gyrB gene of E. coli 427–448d 5’-gta cac cgt gtt cgt aga tct g-3’
ESgyrB376a (probe 1 for FRETc) gyrB gene of E. coli 376–401d 5’-ctg tcg caa aaa ctg gag ctg gtt at-3’
ESgyrB404b (probe 2 for FRET) gyrB gene of E. coli 404–426d 5’-agc gcg agg gta aaa ttc acc gt-3’
pgL1908f (forward primer) Luciferase gene 1908–1927e 5’-agg aag ctt tcc atg gaa ga-3’
Luc175r (reverse primer) Luciferase gene 2063–2082e 5’-cag cgt aag tga tgt cca cc-3’
n-LucHP1a (probe 1 for FRET) Luciferase gene 2008–2029e 5’-tga aga gat acg ccc tgg ttc c-3’
n-LucHP2b (probe 2 for FRET) Luciferase gene 2030–2058e 5’-gga aca att gct ttt aca gat gca cat a-3’ a 3’ FITC labeled
b 5’ LCRed640 labeled
c Fluorescence resonance energy transfer d Numbering of bases is E. coli numbering e Numbering bases of pGeneGRIPTM-Luc
suspended in sterilized deionized water, mixed vigorously with a vortex mixer for 30 s, and then sonicated using an ultrasonic cleaner (Model B3210J; Branson, Danbury, CT) for 10 min at 120 W. Bacterial cells were trapped on the polycarbonate fi lter and enumerated using epifl uorescence microscopy (E400; Nikon Co., Japan) with UV excitation after being stained with 1 μg mL–1 of DAPI.
3. Results
The specifi city of PCR primers and FRET probes was experimentally examined in silico. The gyrB gene sequences
of Salmonella spp. were most similar to those of E. coli and Shigella. The sequences of ESgyrB171F, ESgyrB448R, and
ESgyrB404 were dissimilar to the corresponding sequences of Salmonella. ESgyrB376 (3’-labeled FRET probe) matched
perfectly with 8 of the 28 Salmonella DNA gyrase sequences.
ESgyrB404 (5’-labeled FRET probe) had more than two mismatched bases with all Salmonella DNA gyrase sequences.
PCR using ESgyrB171F and ESgyrB448R was able to amplify the DNA gyrase gene of E. coli and Shi. sonnei but not that
of Sal. enteritidis, Sal. enterica serovar Choleraesuis, or V. vulnifi cus. The copy numbers of gyrB mRNA in an E. coli cell at the log, log-stationary, and stationary phases in
LB broth at 37°C were 4.7±2.3, 0.015±0.002, and <10–6
(below the detection limit, n=3), respectively (Table 2). The copy number of gyrB mRNA in a log phase cell was 300
times higher than that in a log-stationary phase cell. The
copy number was below the detection limit in stationary phase cells. Thus, gyrB mRNA expression levels were high in
growing E. coli W3110 cells, but they declined rapidly after
the cells reached the log phase. When the generation times were 0.42, 1.5, 5.3, and 9.9 h, the ratios of gyrB mRNA to
DNA were 4.7, 1.5, 0.15, and 0.09, respectively, in E. coli
(Fig. 1).
The ratios of growing bacterial cells to total cells were enumerated by the DVC method. The ratios of growing E. coli cells at the log, log-stationary, and stationary phases
were 98±0.007%, 1.0±0.005%, and 0.64±0.005%, respec-tively (Table 3, n=3). These results agreed with those of gyrB
gene expression.
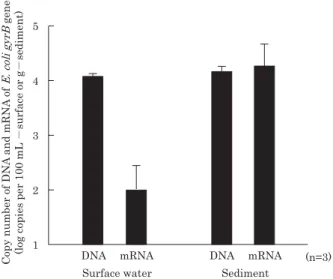
Following the experiments with standard strain, we evalu-ated gyrB gene expression in the environment. The number
of bacteria in the surface river water and river sediment was 2.7×10⁷ cells mL–1 and 1.9×10⁹ cells g–1, respectively. The
copy numbers of gyrB for the E. coli-Shigella group were
1.1×10⁴ copies 100 mL–1 for the surface river water sample
and 1.1×10⁴ copies g–1 for the river sediment. The ratio of
mRNA to DNA was 1.3 in the river sediment sample and 0.008 in the surface river water sample. The ratio in the sedi-ment was more than 100 times greater than that found in the surface water (Fig. 2).
Table 2. Expression of gyrB gene in E. coli cellsa
in diff erent growth phase
Growth phase Copy number of gyrB mRNA/cell
Log 4.7±2.3
Log-stationaryb 0.015±0.002
Stationary <10–6
(n=3)
aE. coli cells were cultured in LB broth at 37°C
b During the transition from log phase to stationary phase
Fig. 1. Relation between copy number of gyrB mRNA and
genera-tion time in E. coli. E. coli cells were cultured in LB broth at
37°C or in M9 medium containing 0.5% glucose at 20°C, 22°C or 25°C, and were collected at mid log phase. gyrB mRNA were
quantifi ed by real-time RT-PCR. Each blotted dot shows the mean of quantifi ed mRNA copy number (n=3), and error bar shows the standard deviation.
Table 3. Growing cells in E. coli cellsa in diff erent growth phase
Growth phase
Log Log-stationaryb Stationary
TDCc 6.6×10⁷±9.3×10⁶ 1.2×10⁹±1.2×10⁸ 7.0×10⁹±1.2×10⁹
DVCd 98±0.007% 1.0±0.005% 0.64±0.005%
(n=3)
aE. coli cells were cultured in LB broth at 37°C
b During the transition from log phase to stationary phase c Total direct count (cells/mL)
d Direct viable count (percentage of elongated cells per total cells)
Fig. 2. Expression of gyrB mRNA of E. coli in river surface water
and sediment. Each error bar indicates the standard deviation derived from triplicate samples.
4. Discussion
We found that gyrB mRNA was expressed at high levels
in growing E. coli cells, in which a higher growth rate
corre-sponded to a higher gyrB expression level. DVC and the ratio
of mRNA to DNA were also correlated. These results suggest that gyrB mRNA expression can be used as an indicator of
bacterial growth activity. The gyrB gene is a housekeeping
gene that encodes for subunit B of bacterial DNA gyrase, and hence, it has an essential role in DNA replication in all bacte-rial species18). Thus, gyrB can be used to determine growth
activity of bacterial species other than E. coli in natural
environments. Only a single copy of the gyrB gene exists in
the genomes of most bacteria. Therefore, the copy number of the gyrB gene represents the number of bacterial genomes,
which indicates the number of bacteria if the generation time is more than 1 h. However, multiple copies of genomic DNA can be found in each cell in more rapidly growing cultures.
The rate of incorporation of a specifi c compound, such as thymidine, leucine, or their analogs, is widely used to deter-mine bacterial growth activity7,8). However, this approach
requires samples to be incubated with the appropriate substance in a closed environment (i.e., a vial), where the bacterial growth activity could change during incubation.
gyrB mRNA expression can be measured without
incuba-tion; hence, it can provide a more accurate indicator of in situ bacterial growth activity. The cellular rRNA content
of bacteria reportedly correlates with the bacterial growth rate5,17). However, the half-life of rRNA in an inactive cell
can be up to several days in natural environments13). The
bacterial rRNA content may indicate the growth rate over the preceding hours or even over several days, and thus,
gyrB mRNA expression is a more appropriate indicator for
determining in situ bacterial growth activity in a rapidly
changing environment. The frequency of cell division may accurately indicate the in situ growth activity and growth rate
in environments9,15) because incubation is not required for the
enumeration of dividing cells. Furthermore, samples used for counting can be fi xed immediately after sampling, which can preserve the bacterial population in a state that is representa-tive of its state in the original environment. However, counting bacteria microscopically is often made diffi cult by the auto-fl uorescence of mineral materials and/or the overlapping of cells in aggregates, biofi lms, and micro-colonies. In contrast,
gyrB mRNA can be measured in various samples if RNA
can be recovered from the sample, including biofi lms, soils, and sediments. The recovery rate of DNA and RNA must be determined to accurately measure the copy numbers of gyrB
DNA and mRNA. In the present study, the recovery rates were determined by quantifying added DNA (PCR amplicons of the luciferase gene) and RNA (in vitro transcripts of the
luciferase clone), which were used as internal standards. Neither the luciferase gene nor its transcript was detected in the river samples (data not shown), and hence, recovery rates could be accurately determined for each sample. The growth activity of E. coli-Shigella in surface river water and river
sediment samples was evaluated by measuring gyrB mRNA
expression. The copy numbers of gyrB for the E. coli-Shigella
group were 1.1×10⁴ copies 100 mL–1 in the surface river
water sample and 1.1×10⁴ copies g–1 in the sediment sample.
The ratio of mRNA to DNA was 1.3 in the river sediment sample and 0.008 in the river surface water sample. The ratio in the sediment sample was more than 100 times higher than that in the surface water sample. Thus, river sediment may be reservoir for the E. coli-Shigella group in natural
environments. Microenvironments provided by particulate matter, biofi lms, and sediments are reportedly rich in organic substances and nutrients, and E. coli can grow and survive
well in such environments4,23). However, there has never been
any evidence that E. coli grows in aquatic environments.
The present study showed that E. coli grew in surface river
water and river sediments and that the growth activity of E. coli in the river sediment was much higher than that in the
surface river water. These fi ndings suggest that river sediment is a potential source of E. coli in surface river water, which
is important for understanding the fate of E. coli in aquatic
environments. gyrB is a bacterial housekeeping gene, and
more than 16,000 sequence data entries can now be found for this gene in DNA databases, which is much more than other genes related to bacterial growth activity. gyrB is also
useful in the phylogenetic analysis of bacteria18).
Phyloge-netic inferences based on gyrB sequences are available; thus,
this novel method of measuring gyrB mRNA expression for
determining bacterial growth activity in natural environments could also be applied to bacterial species other than E. coli
and the Shigella group.
References
1) Artursson, V. and J.K. Jansson. 2003. Use of bromodeoxyuri-dine immunocapture to identify active bacteria associated with arbuscular mycorrhizal hyphae. Appl. Environ. Microbiol. 69: 6208–6215.
2) Baudisova, D. 1997. Evaluation of Escherichia coli as the main
indicator of faecal pollution. Water Sci. Technol. 35: 333–336. 3) Bernard, L., C. Courties, C. Duperray, H. Schäfer, G. Muyzer,
and P. Lebaron. 2001. A new approach to determine the genetic diversity of viable and active bacteria in aquatic ecosystems. Cytometry 43: 314–321.
4) Davies, C.M., J.A.H. Long, M. Donald, and N.J. Ashbolt. 1995. Survival of fecal microorganisms in marine and freshwater sedi-ments. Appl. Environ. Microbiol. 61: 1888–1896.
5) DeLong, E.F., G.S. Wickham, and N.R. Pace. 1989. Phyloge-netic stains: ribosomal RNA-based probes for the cells. Science 243: 1360–1363.
6) Desmarais, T.R., H.M. Solo-Gabriele, and C.J. Palmer. 2002. Infl uence of soil on fecal indicator organisms in a tidally in-fl uenced subtropical environment. Appl. Envir. Microbiol. 68: 1165–1172.
7) Fuhrman, J.A. and F. Azam. 1980. Bacterioplankton second-ary production estimates for coastal waters of British Colum-bia, Antarctica, and California. Appl. Environ. Microbiol. 39: 1085–1095.
8) Fuhrman, J.A. and F. Azam. 1982. Thymidine incorporation as a measure of heterotrophic bacterioplankton production in marine surface waters: evaluation and fi eld results. Mar. Biol. 66: 109–120.
9) Hagström, Å., U. Larsson, P. Hörstedt, and S. Normark. 1979. Frequency of dividing cells, a new approach to the determina-tion of bacterial growth rates in aquatic environments. Appl. Environ. Microbiol. 37: 805–812.
10) Hurt, R.A., X. Qui, L. Wu, Y. Roh, A.V. Palumbo, J.M. Tiedje, and J. Zhou. 2001. Simultaneous recovery of RNA and DNA from soils and sediments. Appl. Environ. Microbiol. 67: 4495– 4503.
11) Iwamoto, T., K. Tani, K. Nakamura, Y. Suzuki, M. Kitagawa, M. Eguchi, and M. Nasu. 2000. Monitoring impact of in situ biostimulation treatment on groundwater bacterial community by DGGE. FEMS Microbiol. Ecol. 32: 129–141.
12) Kawai, M., N. Yamaguchi, and M. Nasu. 1999. Rapid enumera-tion of physiologically active bacteria in purifi ed water used in the pharmaceutical manufacturing process. J. Appl. Microbiol. 86: 496–504.
13) Kemp, P.F., S. Lee, and J. LaRoche. 1993. Estimating the growth rate of slowly growing marine bacteria from RNA con-tent. Appl. Environ. Microbiol. 59: 2594–2601.
14) Kogre, K., U. Shimidu, N. Taga, and R.R. Colwell. 1987. Cor-relation of direct counts with heterotrophic activity for marine bacteria. Appl. Environ. Microbiol. 53: 2332–2337.
15) Møller, S., C.S. Kristensen, L.K. Poulsen, J.M. Carstensen, and S. Molin. 1995. Bacterial growth on surfaces: automated image analysis for quantifi cation of growth rate-related parameters. Appl. Environ. Microbiol. 61: 741–748.
16) Pernthaler, P., J. Pernthaler, M. Schattenhofer, and R. Amann. 2002. Identifi cation of DNA-synthesizing bacterial cells in Coastal north sea plankton. Appl. Environ. Microbiol. 68: 5728–5736.
17) Poulsen, L.K., G. Ballard, and D.A. Stahl. 1993. Use of rRNA fl uorescence in situ hybridization for measuring the activity of single cells in young and established biofi lms. Appl. Environ. Microbiol. 59: 1354–1360.
18) Roberts, R.C. and L. Shapiro. 1997. Transcription of genes encoding DNA replication proteins is coincident with cell cycle
control of DNA replication in Caulobacter crescentus. J. Bac-teriol. 179: 2319–2330.
19) Rodriguez, G.G., D. Phipps, K. Ishiguro, and H.F. Ridgway. 1992. Use of a fl uorescent redox probe for direct visualization of actively respiring bacteria. App. Environ. Microbiol. 58: 1801–1808.
20) Rozen, Y. and S. Belkin. 2001. Survival of enteric bacteria in seawater. FEMS Microbiol. Rev. 25: 513–529.
21) Savageau, M.A. 1983. Escherichia coli habitats, cell types,
and molecular mechanisms of gene control. Am. Nat. 122: 732–744.
22) Schupp, D.C. and S.L. Erlandsen. 1987. A new method to deter-mine Giardia cyst viability: correlation of fl uorescein diacetate and propidium iodide staining with animal infectivity. Appl. Environ. Microbiol. 53: 704–707.
23) Sibille, I., T. Sime-Ngando, L. Mathieu, and J.C. Block. 1998. Protozoan bacterivory and Escherichia coli survival in
drink-ing water distribution systems. Appl. Environ. Microbiol. 64: 197–202.
24) Solo-Gabriele, H.M., M.A. Wolfert, T.R. Desmarais, and C.J. Palmer. 2000. Sources of Escherichia coli in a coastal
subtropi-cal environment. Appl. Envir. Microbiol. 66: 230–237. 25) Tanaka, Y., N. Yamaguchi, and M. Nasu. 2000. Viability of
Escherichia coli O157:H7 in natural river water determined by
the use of fl ow cytometry. J. Appl. Microbiol. 88: 228–236. 26) Tsai, Y.-L. and B.H. Olson. 1991. Rapid method for direct
extraction of DNA from soil and sediments. Appl. Environ. Microbiol. 57: 1070–1074.
27) Urbach, E., K.L. Vergin, and S.J. Giovannoni. 1999. Immuno-chemical detection and isolation of DNA from metabolically active bacteria. Appl. Environ. Microbiol. 65: 1207–1213. 28) USEPA. 1986. USEPA, Ambient water quality criteria for
bac-teria-1986. EPA440-584-002. US EPA, Washington, DC. 29) Yamaguchi, N. and M. Nasu. 1997. Flow cytometric analysis
of bacterial respiratory and enzymatic activity in the natural aquatic environment. J. Appl. Microbiol. 83: 43–52.