Membrane-deformation ability of ANKHD1 is involved in the early endosome enlargement
42
0
0
全文
(2) Article. Membrane-Deformation Ability of ANKHD1 Is Involved in the Early Endosome Enlargement Manabu Kitamata,1 Kyoko Hanawa-Suetsugu,1 Kohei Maruyama,1 and Shiro Suetsugu1,2,* SUMMARY Ankyrin-repeat domains (ARDs) are conserved in large numbers of proteins. ARDs are composed of various numbers of ankyrin repeats (ANKs). ARDs often adopt curved structures reminiscent of the Bin-Amphiphysin-Rvs (BAR) domain, which is the dimeric scaffold for membrane tubulation. BAR domains sometimes have amphipathic helices for membrane tubulation and vesiculation. However, it is unclear whether ARD-containing proteins exhibit similar membrane deformation properties. We found that the ARD of ANK and KH domain-containing protein 1 (ANKHD1) dimerize and deform membranes into tubules and vesicles. Among 25 ANKs of ANKHD1, the first 15 ANKs can form a dimer and the latter 10 ANKs enable membrane tubulation and vesiculation through an adjacent amphipathic helix and a predicted curved structure with a positively charged surface, analogous to BAR domains. Knockdown and localization of ANKHD1 suggested its involvement in the negative regulation of early endosome enlargement owing to its membrane vesiculation.. INTRODUCTION Lipid membranes deform for fission and fusion during various cellular events, including endocytosis, vesicle transport, and organelle division (Jarsch et al., 2016; McNiven and Thompson, 2006; Personnic et al., 2016; Praefcke and McMahon, 2004). The proteins involved in membrane scission include dynamin, endosomal sorting complexes required for transport (ESCRT), and several proteins containing amphipathic helices, such as endophilin, Epsin, Arf1, and Sar1p (Boucrot et al., 2012; Lee et al., 2005; Mattila et al., 2015; Paczkowski and Fromme, 2014; Wollert et al., 2009). Bin-Amphiphysin-Rvs167 (BAR) domains form a curved structure and deform membranes to tubules through electrostatic interactions between the negatively charged lipids and positively charged surface of the BAR domain (Daumke et al., 2014; Suetsugu et al., 2014). Some BAR domains, including those of endophilin, contain amphipathic helices involved in membrane scission and tubulation (Boucrot et al., 2012; Masuda et al., 2006; Nishimura et al., 2018). Owing to the variety of intracellular membrane vesicles, proteins necessary for membrane scission are not considered to be fully identified. We previously reported that the ankyrin-repeat domain (ARD) of the transient receptor potential cation channel subfamily V member 4 binds to lipids, including phosphatidylinositol (4,5) bisphosphate (Takahashi et al., 2014). Arabidopsis ankyrin repeat protein 2A (AKR2A) contains an ARD that binds to monogalactosyldiacylglycerol and phosphatidylglycerol (Kim et al., 2014), implying the potential existence of uncharacterized ARDs with lipid-binding ability. Homo sapiens have approximately 600 ARD-containing proteins (Letunic and Bork, 2017). However, the lipid-binding and lipid-deforming abilities of most ARDs have not been investigated. ARDs comprise several tandemly aligned ankyrin repeats (ANKs). ANK contains two antiparallel a-helices (Li et al., 2006). The number of ANKs varies among ARDs (Mosavi et al., 2004). The variation in ANK number results in a variety of protein surfaces, which often adopt curved structures. These properties imply that ARDs function as scaffolds for membrane deformation, similar to BAR domains.. 1Graduate. School of Science and Technology, Nara Institute of Science and Technology, Ikoma 630-0192, Japan. 2Lead. In this study, we analyzed the membrane-binding and vesiculation abilities of 18 highly transcribed ARDs through a liposome sedimentation assay. We determined the membrane vesiculation potential of ANKHD1 and investigated its function in early endosomes.. Contact. *Correspondence: suetsugu@bs.naist.jp https://doi.org/10.1016/j.isci. 2019.06.020. iScience 17, 101–118, July 26, 2019 ª 2019 The Author(s). This is an open access article under the CC BY-NC-ND license (http://creativecommons.org/licenses/by-nc-nd/4.0/).. 101.
(3) 102. iScience 17, 101–118, July 26, 2019.
(4) Figure 1. Identification of ANKHD1 ARD as a Membrane Vesiculation Protein (A) The 18 purified ARD fragments. The purity of these proteins was examined by SDS-PAGE with Coomassie brilliant blue staining (CBB). See also Figures S1–S3. (B) Illustration of vesiculation by liposome sedimentation assay. When the liposomes were labeled with a small amount of fluorescent-labeled lipids such as rhodamine-PE, the small vesiculated liposomes were not effectively pelleted, which increased the fluorescence from labeled lipids in the supernatant. (C–G) Percentage of rhodamine-PE in the supernatants in liposome sedimentation assay. Liposomes containing PC, PE, PS, and rhodamine-PE prepared at a weight ratio of 6:3:1:0.02 were incubated with the 18 proteins containing ARD fragments (1 mM) for 30 min and then subjected to ultracentrifugation at 109,000 3 g. The supernatant (S) and the pellet (P) fractions were analyzed by SDS-PAGE, followed by visualization of the protein by CBB staining and the liposomes by rhodamine fluorescence. The percentages of rhodamine-PE in the supernatant are shown as the mean of three independent experiments. (C) ASAP1 443-737 aa and OSTF1 1-215 aa. (D) ACAP2 581-770 aa, CLPB 86-330 aa, EHMT1 684-1008 aa, EHMT2 628-968 aa, PPP1R12B 1-358 aa, and FEM1A 1-654 aa. (E) ANKHD1 195-1418 aa, ANKFY1 213-1169 aa, KANK1 1069-1360 aa, PPP1R12C 1-345 aa, RFXANK 1-259 aa, and CDKN2C 1-168 aa. (F) CDKN2D 1-166 aa, ANKRD11 140-297 aa, and ANKRD12 161-311 aa. (G) ANKRD17 224-1410 aa. (H) Vesiculation by liposome sedimentation assay for ARD25 at 1 mM and 250 nM. The lipid compositions of the liposomes were PC:PE:PS:rhodamine-PE at a weight ratio of 6:3:1:0.02 and porcine brain lipids:rhodamine-PE at a weight ratio of 10:0.02. (I) Quantification of liposomes in (H). Data represent the mean of three (250 nM protein) and four (1 mM protein) independent experiments. (J and K) Electron micrographs of liposomes of PC:PE:PS at a weight ratio of 6:3:1 (J) and porcine brain lipids (K) after incubation with ARD25 (1 mM) for 20 min. Liposomes were visualized by negative staining. The boxed region presents an enlarged image. Scale bars, 100 nm. All error bars represent SE. *p < 0.05, **p < 0.01. Statistical significance value was determined using the Student’s t test.. RESULTS Identification of Membrane Vesiculation of ANKHD1 ARD We expected highly transcribed genes to be essential for cellular functions. Among the approximately 600 proteins with ARDs in Homo sapiens (Letunic and Bork, 2017), we selected 18 based on the high frequencies of expressed sequence tags (ESTs) in the Unigene database (Boguski and Schuler, 1995) (Figure S1). These 18 ARDs were expressed in Escherichia coli and purified (Figure 1A). Binding of each ARD to liposomes and subsequent liposome vesiculation were examined via a liposome sedimentation assay. Co-sedimentation of an ARD with liposomes indicated the binding of that ARD to liposomes. The sedimentation efficiency depends on liposome size, and decreased liposome sedimentation occurs with a reduction in liposome size in the presence of proteins. This reduction in liposome sedimentation reflects the vesiculation ability of the protein (Boucrot et al., 2012). The number of liposomes in the supernatant and in the pellet was determined by incorporating rhodamine-labeled phosphatidylethanolamine (PE) into liposomes (Figure 1B). We prepared liposomes containing phosphatidylcholine (PC), PE, and phosphatidylserine (PS) at a weight ratio of 6:3:1 because PC and PE are abundant, whereas PS is not abundant in intracellular organelles, including endosomes, the Golgi complex, endoplasmic reticulum (ER), and mitochondria (Evans and Hardison, 1985; Horvath and Daum, 2013; Keenan and Morre´, 1970; Marquardt et al., 2015; van Meer et al., 2008). We then incubated each of the 18 protein fragments with protein-free liposomes (Figures 1C–1G). Among the 18 protein fragments, the ARD of ANKHD1, containing 25 ANKs (ANKHD1 195–1418 amino acid residues, also termed ARD25), had the highest membrane vesiculation activity (Figure 1E). ANK and FYVE domain-containing 1 (ANKFY1) displayed weaker membrane vesiculation ability than ANKHD1 (Figure 1E). Ankyrin repeat domain-containing protein 17 (ANKRD17), a paralog of ANKHD1, displayed membrane vesiculation ability (Figure 1G). To determine the presence of a group of ARDs with membrane-deforming abilities, ANKs of all ARDs were examined for sequence similarities in Homo sapiens. The amino acid sequences between the ANKs of ANKHD1 and ANKRD17 are conserved, forming a distinct group among the 18 highly transcribed ARD-containing proteins (Figure S2). However, among all human proteins containing ARDs, the ANKs of ANKHD1 are not grouped by amino acid sequence similarity (Figure S3), suggesting the importance of ARD as an assembly of several ANKs for their function. The average EST frequency for ANKHD1 was 167 transcripts per million (TPM), which was the highest among the 18 proteins (Figure S1B). The ANKHD1 EST frequency was equivalent to those of SH3GL1 (endophilin A2, 100 TPM) and ACTR3 (Arp3, 234 TPM). Endophilin A2 is a protein containing a BAR domain. ACTR3 is a component of the abundant Arp2/3 protein complex, which induces branched actin filaments. Therefore, we focused on ANKHD1 in subsequent studies. To examine whether the ARD of ANKHD1 vesiculates liposomes constituted with natural lipids, we examined the vesiculation of liposomes constituted with total lipids (Folch fraction) from porcine brain using the liposome sedimentation assay. ARD25 at 1 mM vesiculated the Folch fraction liposomes (Figures 1H and 1I).. iScience 17, 101–118, July 26, 2019. 103.
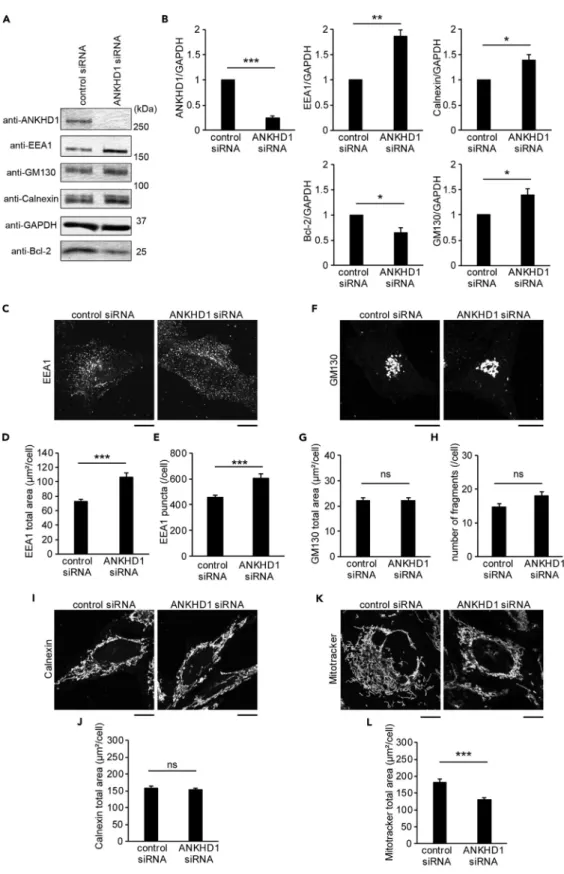
(5) Figure 2. Quantity of Organelle Marker Proteins in ANKHD1-Depleted Cells (A) Effect of ANKHD1 knockdown on the levels of various organelle marker proteins. HeLa cells were treated with control or ANKHD1 siRNA. The whole-cell lysates were subjected to western blot with antibodies for early endosome (EEA1), cisGolgi (GM130), ER(Calnexin), and Bcl-2 (mitochondria). Glyceraldehyde-3-phosphate dehydrogenase (GAPDH) was examined as the loading control. See also Figures S4A, S6A, and S6B.. 104. iScience 17, 101–118, July 26, 2019.
(6) Figure 2. Continued (B) Quantification of the signal intensities in (A) using ImageJ software. Data represent the mean of five independent experiments. (C) Confocal microscopic analysis of EEA1 in HeLa cells treated with control or ANKHD1 siRNA by immunostaining. See also Figure S5. (D and E) The total area (D) and the number (E) of EEA1 puncta per cell in (C) were measured by ImageJ software. Data represent the mean of 43 and 42 cells from three independent experiments for control siRNA and ANKHD1 siRNA, respectively. See also Figures S6C–S6H and S8. (F) Confocal microscopic analysis of GM130 as in (C). (G and H) The total area (G) of GM130 staining per cell in (F) measured as in (D) and the number of Golgi fragments (H) per cell in (F) are shown. Data represent the mean of 68 and 78 cells from three independent experiments for control siRNA and ANKHD1 siRNA, respectively. (I) Confocal microscopic analysis of Calnexin as in (C). (J) The total area of Calnexin staining per cell in (I) was measured as in (D). Data represent the mean of 44 and 46 cells from three independent experiments for control siRNA and ANKHD1 siRNA, respectively. (K) Confocal microscopic analysis of mitochondria stained with MitoTracker as in (C). (L) The total area of MitoTracker staining per cell in (K) was measured as in (D). Data represent the mean of 55 and 52 cells from three independent experiments for control siRNA and ANKHD1 siRNA, respectively. All error bars represent SE. *p < 0.05, **p < 0.01, and ***p < 0.001. Statistical significance was determined with the Student’s t test. ns, not significant. Scale bars, 10 mm.. At 250 nM, ARD25 protein did not vesiculate liposomes constituted with porcine brain lipids or of PC:PE:PS at a weight ratio of 6:3:1 (Figures 1H and 1I). To confirm liposome vesiculation by ARD25, we observed liposomes after incubation with ARD25 via transmission electron microscopy. Consistent with the sedimentation assay, the liposomes of PC/PE/PS and the Folch fraction were vesiculated into small vesicles in the presence of ARD25 at 1 mM (Figures 1J and 1K). These results suggest that ANKHD1 can vesiculate liposomes constituted with natural lipids depending on the protein concentration.. Increased Total Area of EEA1-Positive Early Endosomes and Decreased Total Area of Mitochondria in ANKHD1-Depleted Cells To investigate the cellular function of ANKHD1, ANKHD1 was depleted from HeLa cells, using small interfering RNA (siRNA). Western blot was performed to quantify marker proteins of intracellular organelles: EEA1 for early endosomes (Zoncu et al., 2009), GM130 for cis-Golgi (Nakamura et al., 1995), Calnexin for ER (Wang et al., 2000), and Bcl-2 for mitochondria (Wolter et al., 1997). Western blots were carried out with lysates of cells treated with control siRNA and ANKHD1 siRNA (Figures 2A and 2B). The reduction in ANKHD1 was associated with the upregulation of EEA1, GM130, and Calnexin and downregulation of Bcl-2 (Figures 2A and 2B). A similar EEA1 upregulation was observed in other ANKHD1-depleted cells, including HEK293T, Caki-1, U2OS, and DLD1 cells (Figure S4A). Thereafter, we measured the quantity of these organelles in control siRNA and ANKHD1-siRNA-treated cells (Figures 2C–2L). The total area and the number of EEA1 puncta were higher in ANKHD1-siRNA-treated cells than in the control cells at each focal plane upon confocal microscopy (Figure S5). Therefore, we used the focal plane adjacent to the surface of cellular attachment on the coverslips, where the area of cells is the largest, to quantify the changes in organelles. The total area of EEA1 localization and the number of EEA1 puncta per cell increased approximately by 1.5-fold in ANKHD1 siRNA-treated cells relative to that in the control siRNA-treated cells (Figures 2C–2E), suggesting an increase of the EEA1-positive early endosomes upon depletion of ANKHD1. Interestingly, the total mitochondrial area of the ANKHD1-siRNA-treated cells was approximately 70% of the control siRNA-treated cells, as examined via MitoTracker staining (Figures 2K and 2L). In contrast, the total area and number of Golgi fragments stained with GM130 remained unchanged upon ANKHD1 siRNA treatment (Figures 2F–2H). In addition, the total area of Calnexin localization remained unchanged (Figures 2I and 2J). Hence, ANKHD1 knockdown was associated with an increase in the total area of EEA1-positive early endosomes and a reduction in the total area of mitochondria. As ANKHD1 vesiculates the membrane, the siRNA for ANKHD1 was considered to increase the area of organelles that was vesiculated by ANKHD1. Therefore the EEA1-localized early endosomes, not mitochondria, are potential sites of ANKHD1 activity. EEA1 is the tethering factor of early endosomes for membrane fusion of endocytic vesicles with the small GTPase Rab5 (Murray et al., 2016) and can thus be used to identify mature early endosomes, whereas Rab5 is localized to early endosomes and endocytic vesicles regardless of early endosome maturation (Friedman et al., 2013; He et al., 2017; Zoncu et al., 2009). The level of endogenous Rab5 remained unchanged upon. iScience 17, 101–118, July 26, 2019. 105.
(7) Figure 3. Localization of ANKHD1 on Endosomes (A) Confocal microscopic images of endogenous ANKHD1 (green) and EEA1 (red) in HeLa cells. The rectangle in the upper image shows the region of enlargement in the lower images. Arrows indicate colocalization of endogenous ANKHD1 and EEA1. See also Figure S4B. (B) Colocalization percentages of endogenous ANKHD1 with EEA1 and EEA1 per cell in (A) calculated using ImageJ software. Data represent the means of nine cells. (C) Confocal microscopic images of ANKHD1-EGFP (green) and EEA1 (red) in HeLa cells. Arrows indicate colocalization of ANKHD1-EGFP and EEA1. (D and E) Confocal microscopic images of the endogenous ANKHD1 (green) in HeLa cells overexpressing (D) mCherryRab5 or (E) mCherry-Rab5Q79L, shown in red. (F) Colocalization percentages of endogenous ANKHD1 with mCherry-Rab5 or mCherry-Rab5Q79L and mCherry-Rab5 or mCherry-Rab5Q79L per cell in (D and E). Data represent the mean of 10 and 11 cells overexpressing mCherry-Rab5 and mCherry-Rab5Q79L, respectively. See also Figure S7. All error bars represent SE. *p < 0.05. Statistical significance was assessed with the Student’s t test. ns, not significant. Scale bars, 10 mm. Scale bars in magnification, 2 mm.. treatment with ANKHD1 siRNA (Figures S6A and S6B). Interestingly, the total area of endogenous Rab5 localization was not significantly altered upon treatment with ANKHD1 siRNA (Figures S6C and S6D). However, the number of the endogenous Rab5 puncta decreased upon treatment of ANKHD1 siRNA, where the average area of Rab5 puncta was increased by the decrease in the smaller Rab5 puncta (Figures S6E–S6G). The colocalization of Rab5 with EEA1 was increased in the ANKHD1-depleted cells (Figure S6H), where most of the EEA1-positive. 106. iScience 17, 101–118, July 26, 2019.
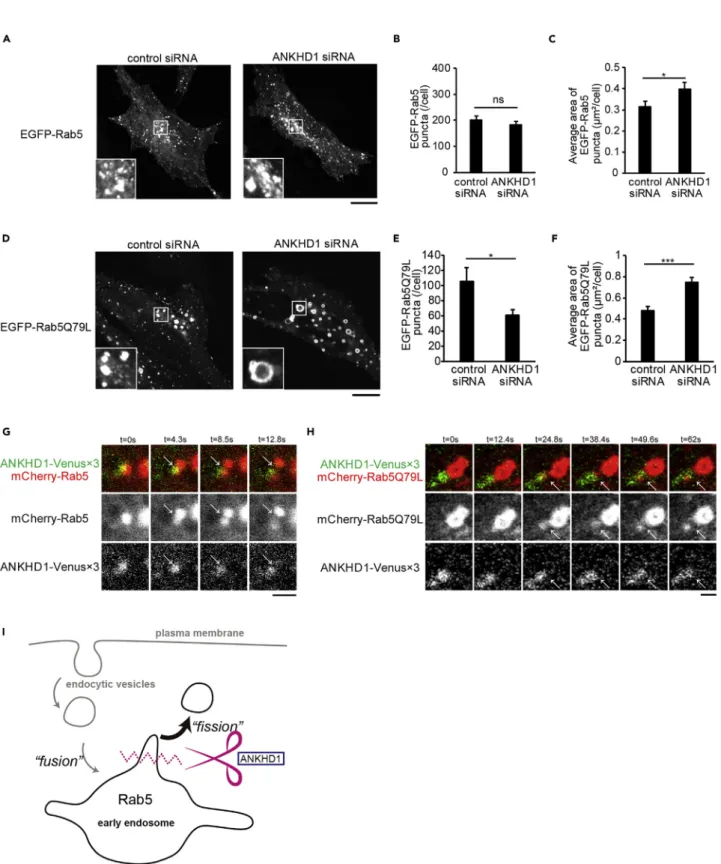
(8) Figure 4. ANKHD1 Regulates Rab5-Positive Organelles and Recruitment at the Scission Site (A) Confocal microscopic images of overexpressed EGFP-Rab5 in HeLa cells treated with control siRNA or ANKHD1 siRNA. Scale bars, 10 mm. (B and C) Quantification of the number (B) and average area (C) of EGFP-Rab5 puncta per cell in (A). Data represent the mean of 21 and 18 cells from three independent experiments for control siRNA and ANKHD1 siRNA, respectively. (D) Confocal microscopic images of overexpressed EGFP-Rab5Q79L in HeLa cells treated with control siRNA or ANKHD1 siRNA. Scale bars, 10 mm.. iScience 17, 101–118, July 26, 2019. 107.
(9) Figure 4. Continued (E and F) Quantification of the number (E) and the average area (F) of EGFP-Rab5Q79L puncta per cell in (D). Data represent the mean of 30 and 29 cells from three independent experiments for control siRNA and ANKHD1 siRNA, respectively. (G) Live imaging of HeLa cells co-transfected with ANKHD1 siRNA, ANKHD1-Venus33, and mCherry-Rab5. Arrows indicate early endosome scission. Scale bar, 1 mm. (H) Live imaging of HeLa cells co-transfected with ANKHD1 siRNA, ANKHD1-Venus33, and mCherry-Rab5Q79L. Arrows indicate early endosome scission. Scale bar, 1 mm. (I) Proposed function of ANKHD1. ANKHD1 is recruited to Rab5-positive early endosomes for membrane vesiculation. All error bars represent SE. *p < 0.05 and ***p < 0.001. Statistical significance was determined with the Student’s t test. ns, not significant.. puncta contained Rab5. Therefore, these data suggest the increase of EEA1-Rab5-double-positive early endosome upon depletion of ANKHD1. Thus an increase in the number of EEA1 puncta indicates an increase of the EEA1-positive early endosomes by the inhibition of the ANKHD1-mediated vesiculation, which would further inhibit the subsequent trafficking of the vesiculated early endosomes.. Subcellular Localization of ANKHD1 To examine the localization of endogenous ANKHD1, we stained endogenous ANKHD1 and EEA1 with anti-ANKHD1 and anti-EEA1 antibodies, respectively (Figures 3A and 3B). Partial colocalization of these two proteins was observed. Similar to HeLa cells, partial colocalization of ANKHD1 with EEA1 was observed in HEK293T, Caki-1, U2OS, and DLD1 cells (Figure S4B). In HeLa cells, the colocalization of ANKHD1 with EEA1 was confirmed using ANKHD1-tagged with enhanced green fluorescent protein (EGFP) (Figure 3C). To further characterize the localization of ANKHD1 in endosomes, we examined the colocalization of ANKHD1 and Rab5, because active Rab5 recruits EEA1 to early endosomes (Lawe et al., 2002). When we examined the colocalization of the two proteins above the threshold level, endogenous ANKHD1 was partially colocalized with mCherry-tagged Rab5, the constitutive active Q79L mutant of Rab5, and endogenous Rab5 (Figures 3D–3F, S7A, and S7F). Therefore, ANKHD1 was considered to be recruited by active Rab5 on early endosomes. In particular, the large early endosomes containing Rab5Q79L also contained ANKHD1 (Figure 3E). The late endosomes/lysosomes and mitochondria were visualized using antiLAMP1 and anti-Tom20 antibodies, respectively (Kanaji et al., 2000; Saftig and Klumperman, 2009), in addition to Rab5 for early endosomes, GM130 for cis-Golgi, and Calnexin for the ER. Colocalization of endogenous ANKHD1 with Rab5 and Tom20 was greater than that with LAMP1, GM130, and Calnexin (Figure S7).. ANKHD1 Antagonizes Rab5-Induced Enlargement of Early Endosomes We then examined the effect of ANKHD1 depletion in Rab5-positive early endosomes. Interestingly, ANKHD1 knockdown did not change the number of GFP-tagged Rab5-positive early endosomes, but decreased the number of Rab5Q79L-positive early endosomes (Figures 4A, 4B, 4D, and 4E). However, the average area of these GFP-Rab5 and Rab5Q79L-positive early endosomes was increased in the ANKHD1 siRNA-treated cells (Figures 4A, 4C, 4D, and 4F), and the small Rab5Q79L puncta were almost absent in ANKHD1 siRNA-treated cells. We then examined ANKHD1 localization in early endosomes without fixation, using mCherry-tagged Rab5 and Rab5Q79L as an early endosomal marker. To better visualize the localization of expressed ANKHD1, three Venus tags (Nagai et al., 2002) were tandemly conjugated and used to tag ANKHD1. In ANKHD1-depleted cells weakly expressing ANKHD1-Venus33 and mCherry-Rab5 or mCherry-Rab5Q79L, ANKHD1 transiently colocalized with Rab5 and Rab5Q79L upon scission of mCherry-Rab5 and mCherrry-Rab5Q79L puncta (Figures 4G and 4H and Video S1). The switch from Rab5 to Rab7 is important for the maturation of early endosomes to late endosomes and lysosomes. Endosome maturation is accompanied by the acidification of the lumen and is detected via LysoTracker staining (Huotari and Helenius, 2011; Rink et al., 2005). The number, average area, and total area of lysosomes remained unchanged in cells treated with control or ANKHD1 siRNA (Figure S8). As early endosomes are enlarged upon fusion of endocytic vesicles, these data suggested that the vesiculation ability of ANKHD1 antagonized the enlargement of early endosomes with active Rab5 localization without affecting endosome maturation (Figure 4I).. The Regions of ANKHD1 for Membrane Vesiculation and Dimerization To examine the mechanism underlying ANKHD1 for membrane vesiculation, the predicted structured (ordered) region of the ANKHD1 was assessed using a disorder-prediction program (Ward et al., 2004).. 108. iScience 17, 101–118, July 26, 2019.
(10) iScience 17, 101–118, July 26, 2019. 109.
(11) Figure 5. Dimerization and Vesiculation Ability of ANKHD1 (A) Illustration of human ANKHD1 and the fragments: ANKHD1 (1–2542 aa), N + ARD15 (ANKHD1 1–885 aa), ARD10 (ANKHD1 886–1587 aa), N + ARD25 (ANKHD1 1–1587 aa), and ARD25 (ANKHD1 195–1418 aa). ANK, amphipathic helix, and the KH domain were indicated. Disorder probability was also plotted by PrDOS (http://prdos.hgc.jp). (B) Level of expressed ANKHD1 fragments, endogenous EEA1, and endogenous ANKHD1 in ANKHD1-depleted HeLa cells expressing EGFP, N + ARD15EGFP, ARD10-EGFP, N + ARD25-EGFP, ARD25-EGFP, or ANKHD1-EGFP for rescue experiments by western blot. See also Figure S9. (C) Quantification of EEA1 in (B). Data represent the mean of three independent experiments. (D) Vesiculation by liposome sedimentation assay for N + ARD15, ARD10, N + ARD25, and ARD25 at 250 nM using ultracentrifugation at 109,000 3 g. The lipid composition of the liposomes was PC:PE:PS:rhodamine-PE at weight ratio of 6:3:1:0.02. (E) Quantification of liposomes in (D). Data represent the mean of three independent experiments. (F) Electron micrographs of liposomes of PC:PE:PS at a weight ratio of 6:3:1 after incubation with N + ARD15, ARD10, N + ARD25, or ARD25 at 250 nM for 20 min. Liposomes were visualized by negative staining. The boxed region presents an enlarged image. Scale bars, 100 nm. (G) Vesiculation by liposome sedimentation assay for N + ARD15 and ARD10 at 1 mM using ultracentrifugation at 109,000 3 g. The lipid composition of the liposomes was PC:PE:PS:rhodamine-PE at weight ratio of 6:3:1:0.02. (H) Quantification of liposomes in (G). Data represent the mean of three independent experiments. (I) Cross-linking assay for ANKHD1 fragments. N + ARD15, ARD10, N + ARD25, or ARD25 at 250 nM were incubated with or without liposome composed of PC:PE:PS at a weight ratio of 6:3:1 and then incubated with BS(PEG)5 at a final concentration of 100 mM. The box indicates the dimer formation of ANKHD1 fragments. All error bars represent SE. *p < 0.05, **p < 0.01, and ***p < 0.001. Statistical significance was determined with the Student’s t test. ns, not significant.. Although the KH domain was assigned on the basis of sequence homology, the region outside of the ARD was mostly disordered (Figure 5A). We prepared several ANKHD1 fragments. N + ARD25 contains 1–1587 amino acids (aa) of ANKHD1, including the N-terminal region and an additional 169 aa of the ARD25 C-terminal region. N + ARD15 and ARD10 contain 1–885 aa and 886–1587 aa of ANKHD1, which contain the group of 15 ANKs and the group of 10 ANKs, respectively (Figure 5A). When these ANKHD1 fragments and ANKHD1 were expressed in HeLa cells depleted of ANKHD1 via siRNA, N + ARD15, N + ARD25, and ARD25 expression levels were equivalent, although the exogenous ANKHD1 expression levels were lower than those of these fragments, and ARD10 expression levels were very low (Figure 5B). ANKHD1 and N + ARD25 downregulated EEA1 in ANKHD1-depleted cells (Figures 5B and 5C); however, expression of the other fragments did not significantly downregulate EEA1, as revealed through western blot. The effect of ARD10 expression was unclear because of its almost undetectable expression. Therefore, N + ARD25 was implicated as the active fragment for membrane vesiculation of early endosomes. We then examined the effect of expression of ANKHD1 and its fragments on the total area and the number of EEA1 puncta in HeLa cells (Figures S9A–S9D). The expression of N + ARD25 and ANKHD1 decreased the total area of EEA1 staining than those of other ANKHD1 fragments (Figure S9C). ANKHD1 expression slightly decreased the number of EEA1 puncta, although the reduction in the number of EEA1 puncta upon expression of ANKHD1 fragments was not significant (Figure S9D). Therefore the expression of ANKHD1 or its N + ARD25 fragment potentially decreases EEA1-positive organelles. In contrast, N + ARD25 expression did not affect the ER, mitochondria, and Golgi apparatus, as examined on the basis of changes in the total area of Calnexin, MitoTracker, and GM130 staining, respectively (Figures S9E– S9J). The number of Golgi fragments remained unchanged upon N + ARD25 expression (Figure S9K). Furthermore, vesiculation of liposomes comprising PC, PE, and PS at a weight ratio of 6:3:1 by these ANKHD1 fragments was examined in vitro, using the ANKHD1 fragments expressed and purified from E. coli. This phospholipid composition is similar to that of early endosomes (Evans and Hardison, 1985; Kobayashi et al., 1998). In liposome sedimentation assays, the N + ARD25 fragment showed greater vesiculation potential than the ARD25, N + ARD15, and ARD10 fragments at a 250 nM protein concentration (Figures 5D and 5E). Transmission electron microscopy revealed that N + ARD15 did not vesiculate liposomes; however, ARD10 and ARD25 deformed the membrane into tubes and N + ARD25 vesiculates liposomes into small vesicles in such a condition (Figure 5F). Interestingly, ARD10 displayed a greater vesiculation potential than N + ARD15 at a 1 mM protein concentration (Figures 5G and 5H). As the membrane-deforming proteins often form dimers and oligomers, the assembly of ANKHD1 was examined via a chemical cross-linking assay with or without liposomes. N + ARD15, N + ARD25, and ARD25 were cross-linked via bis-N-succinimidyl-(pentaethylene glycol) ester (BS(PEG)5) (Figure 5I). N + ARD25 was more efficiently cross-linked than ARD25 (Figure 5I). In contrast, ARD10 did not exhibit clear. 110. iScience 17, 101–118, July 26, 2019.
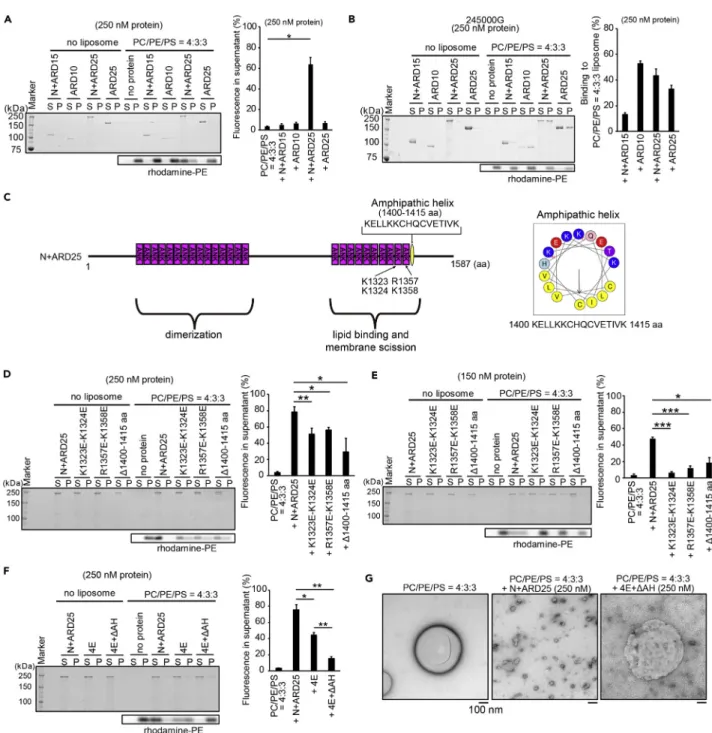
(12) Figure 6. Vesiculation Ability of ANKHD1 Caused by Amphipathic Helix and Electrostatic Interaction (A) Vesiculation by liposome sedimentation assay for N + ARD15, ARD10, N + ARD25, and ARD25 at 250 nM using ultracentrifugation at 109,000 3 g. The lipid composition of the liposomes was PC:PE:PS:rhodamine-PE at a weight ratio of 4:3:3:0.02. The percentage of the rhodamine-PE fluorescence in the supernatant is shown. Data represent the mean of three independent experiments. See also Figure S10. (B) Protein binding by liposome sedimentation assay for N + ARD15, ARD10, N + ARD25, and ARD25 at 250 nM using ultracentrifugation at 245,000 3 g, where most of the liposomes were pelleted. The lipid composition of the liposomes was PC:PE:PS:rhodamine-PE at a weight ratio of 4:3:3:0.02. The percentage of the protein in the pellet is shown. Data represent the mean of three independent experiments. (C) Illustration of the mutations (K1323E-K1324E and R1357E-K1358E) and amphipathic helix (1400–1415 aa) of N + ARD25 (ANKHD1-1-1587 aa). The wheel diagram of the predicted amphipathic helix (1400–1415 aa residues) in ANKHD1 by HeliQuest is also shown. The hydrophobic moment indicates amphiphilicity of a helix. See also Figure S11. (D and E) Vesiculation by liposome sedimentation assay for N + ARD25 and its mutations in which basic amino acids were substituted into acidic amino acids (K1323E-K1324E or R1357E-K1358E) or deletion of the amphipathic helix (D 1,400–1,415 aa) at 250 nM (D) and 150 nM (E). The lipid composition of liposomes was PC:PE:PS:rhodamine-PE at a weight ratio of 4:3:3:0.02. The percentage of rhodamine-PE fluorescence in the supernatant is also shown. Data represent the mean of three (D) or four (E) independent experiments.. iScience 17, 101–118, July 26, 2019. 111.
(13) Figure 6. Continued (F) Vesiculation by liposome sedimentation assay for N + ARD25 and its mutations with K1323E-K1324E-R1357E-K1358E (4E) or K1323E-K1324E-R1357EK1358E+D 1,400–1,415 aa (4E+DAH) at 250 nM. The lipid composition of the liposomes was PC:PE:PS:rhodamine-PE at a weight ratio of 4:3:3:0.02. The percentage of rhodamine-PE fluorescence in the supernatant is shown. Data represent the mean of four independent experiments. (G) Electron micrographs of liposomes after incubation with N + ARD25 or 4E+DAH at 250 nM for 20 min. The liposome composition was PC:PE:PS at a weight ratio of 4:3:3. Scale bars, 100 nm. All error bars represent SE. *p < 0.05, **p < 0.01, and ***p < 0.001. Statistical significance was determined with the Student’s t test. ns, not significant.. dimer or oligomer bands after the cross-linking reaction (Figure 5I). Cross-linking occurred in the presence and absence of liposomes. These results suggest the involvement of N + ARD15 in dimer formation, which enabled the efficient vesiculation by N + ARD25 through ARD10.. Vesiculation Ability of ANKHD1 Results from the Amphipathic Helix and Electrostatic Interactions At the deformation sites of endosomes, especially for the recycling endosomes, PS is considered to be enriched because of the presence of lipid flippase (Chen et al., 2010; Lee et al., 2015; Uchida et al., 2011; Xu et al., 2013). Therefore, we also examined the vesiculation of liposomes comprising PC, PE, and PS at a weight ratio of 4:3:3. Similar to liposomes comprising PC, PE, and PS at a weight ratio of 6:3:1, the N + ARD25 fragment displayed the most efficient vesiculation (Figure 6A). Vesiculation of these liposomes depended on the concentration of the N + ARD25 protein (Figure S10). We then filtered the liposomes to reduce the size of liposomes larger than 800 nm. The filtered liposomes were vesiculated in a manner similar to the non-filtered liposomes, suggesting that the large liposome diameter was not required for vesiculation (Figure S10). We then examined the binding of these fragments by increasing the centrifugation speed used for the liposome sedimentation assay. The binding of the N + ARD25, ARD10, and ARD25 fragments to these liposomes were observed, whereas ARD15 did not bind to liposomes, indicating that ANKHD1 interacts with liposomes through ARD10 (Figure 6B). We attempted to examine the contribution of electrostatic interactions between the positively charged amino acid residues of ANKHD1 and the negatively charged lipids with respect to the vesiculation ability. Sequence alignments of the ANKs in ANKHD1 showed that the 10 ANKs contain more frequent positively charged amino acid residues at positions 1 and 2 in the ANK compared with the 15 ANKs (Figure S11A). Thereafter the predicted structure of the 10 ANKs via the Phyre2 program (Kelley et al., 2015) was used to detect the positively charged surface (Figures S11B and S11C), which resulted in N + ARD25 fragments with K1323E-K1324E and R1357E-K1358E mutations (Figure 6C). At protein concentrations of 250 and 150 nM, the N + ARD25 K1323E-K1324E and R1357E-K1358E mutants displayed decreased vesiculation potential compared with N + ARD25 (Figures 6D and 6E). These results suggest that ANKHD1-mediated membrane scission involves electrostatic interactions between the membrane and proteins. The hydrophobic moment indicates the amphiphilicity of a potential a-helix. Determination of the hydrophobic moment using HeliQuest (Gautier et al., 2008) indicated the presence of a potential amphipathic helix at 1400–1415 aa (Figures 6C and S11D). At protein concentrations of 250 and 150 nM, the N + ARD25 mutant with the deletion of 1400–1415 aa (D1400–1415 aa) displayed a decreased vesiculation ability compared with that of N + ARD25 (Figures 6D and 6E). Furthermore, we generated N + ARD25 with K1323E-K1324E + R1357E-K1358E mutations (4E) and K1323EK1324E + R1357E-K1358E + D1400-1415 aa mutations (4E+DAH). In liposome sedimentation assays, the 4E+DAH mutant drastically decreased vesiculation compared with N + ARD25 and the 4E mutant via liposome sedimentation (Figure 6F). We visualized these liposomes via electron microscopy. Vesiculated liposomes were observed after incubation with the N + ARD25 fragment, but not with the 4E+DAH mutant (Figure 6G). Therefore the combination of mutations in the positively charged amino acid residues and the deletion of the amphipathic helix further reduced the vesiculation ability, indicating that both electrostatic interactions and the amphipathic helix contributed to membrane vesiculation, suggesting that ANKHD1 can cause membrane deformation and vesiculation in a manner similar to that of BAR domain proteins (Figure S11E).. ANKHD1 Regulates the Size and Number of Early Endosomes through Membrane Vesiculation To investigate the role of vesiculation of ANKHD1 in early endosomal regulation, we expressed the siRNAresistant ANKHD1-EGFP and its 4E+DAH mutant in ANKHD1 siRNA-treated cells at levels similar to those. 112. iScience 17, 101–118, July 26, 2019.
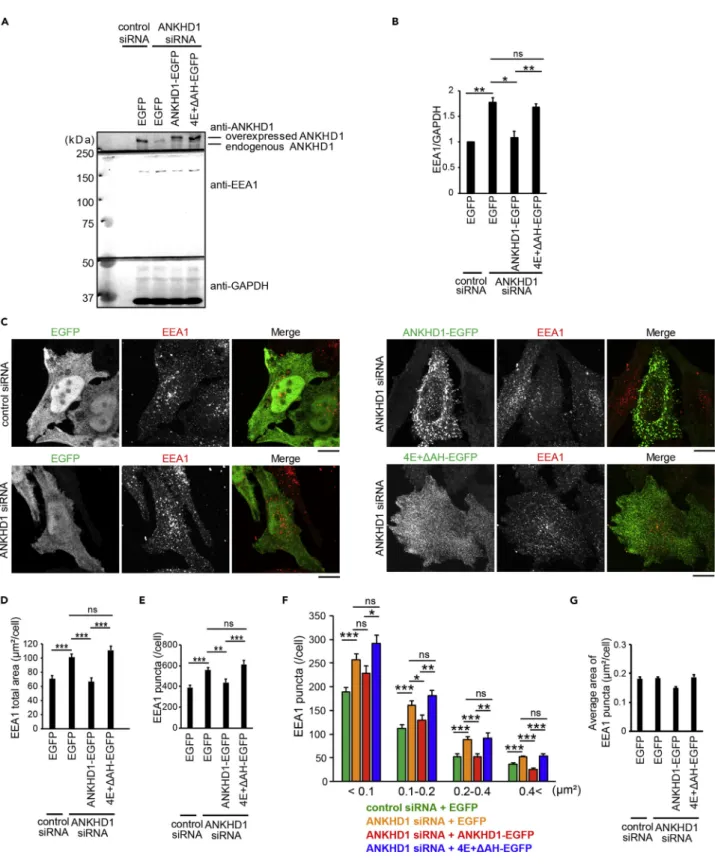
(14) Figure 7. ANKHD1 Regulates the Size and Number of EEA1-Positive Early Endosomes by Vesiculation Ability (A) Amounts of endogenous ANKHD1, endogenous EEA1, and expressed ANKHD1 in HeLa cells transfected with control siRNA + EGFP, ANKHD1 siRNA + EGFP, ANKHD1 siRNA + ANKHD1-EGFP, or ANKHD1 siRNA + ANKHD1-EGFP with 4E+DAH (4E+DAH-EGFP) for rescue experiments by western blot. (B) Quantification of EEA1 in (A). Data represent the mean of four independent experiments. (C) Confocal microscopic images of endogenous EEA1 for the rescue experiments as in (A). Scale bars, 10 mm.. iScience 17, 101–118, July 26, 2019. 113.
(15) Figure 7. Continued (D–G) The total area (D) and the number (E), the size distribution (F), and the average area (G) of EEA1 puncta per cell in (C) were measured using ImageJ software. Data represent the mean of 27, 27, 25, and 25 cells from three independent experiments for control siRNA + EGFP, ANKHD1 siRNA + EGFP, ANKHD1 siRNA + ANKHD1-EGFP, and ANKHD1 siRNA + 4E+DAH-EGFP, respectively. All error bars represent SE. *p < 0.05, **p < 0.01, and ***p < 0.001. Statistical significance was determined with the Student’s t test. ns, not significant.. of endogenous ANKHD1 (Figure 7A). In ANKHD1-depleted cells, the amount, total area, and the number of EEA1 was greater than that of EEA1 in control cells (Figures 7A–7E). The expression of ANKHD1-EGFP, but not 4E+DAH-EGFP, restored the amount of EEA1 protein, as well as the total area and the number of EEA1positive puncta in ANKHD1-depleted cells to physiological levels in the control cells (Figures 7A–7E). To examine the effect of ANKHD1-mediated vesiculation on EEA1-positive early endosome, we analyzed the size distribution of EEA1-positive puncta per cell in these cells. The number of EEA1-positive puncta increased in all four size ranges upon treatment with ANKHD1 siRNA (<0.1, 0.1–0.2, 0.2–0.4, and 0.4< mm2) (Figure 7F). The expression of ANKHD1-EGFP restored the number of EEA1-positive puncta in all four size ranges to those in control cells, whereas the expression of its 4E+DAH mutant did not restore the number of EEA1-positive puncta in all four size ranges (Figure 7F). The average area of the EEA1-positive puncta per cell was largely unaltered (Figure 7G). These results indicate that the membrane vesiculation ability of ANKHD1 is essential for vesiculation of EEA1-positive early endosomes. On expressing siRNA-resistant ANKHD1 and its 4E+DAH mutant in ANKHD1 siRNA-treated cells to levels similar to those of endogenous ANKHD1 in Rab5Q79L-expressing cells (Figure 8A), ANKHD1 expression adequately restored the number and average area of Rab5Q79L-positive early endosomes; however, the 4E+DAH mutant could not restore those in Rab5Q79L-positive early endosomes, which remained enlarged (Figures 8B–8D). These results suggest that ANKHD1 regulates early endosome through vesiculation.. DISCUSSION ANKHD1 contains 25 ANKs, potentially divisible into a group containing the first 15 ANKs and a group containing the last 10 ANKs. We observed that ANKHD1 dimerization occurred through the N-terminal region containing the 15 ANKs. Membrane vesiculation occurred with the 10 ANKs, which was considered to be enhanced by the dimerization among the first 15 ANKs. ARDs often assume curved conformations, as in case of Ankyrin-R, which has 24 ANKs (Wang et al., 2014). The predicted structure of the latter 10 ANKs suggested abundance of positively charged amino acid residues in its protein surface, which is similar to the lipid-binding surface of the BAR domain. Furthermore, an amphipathic helix was adjacent to the latter 10 ANKs. Some BAR domains capable of membrane scission contain amphipathic helices (Boucrot et al., 2012). Therefore, it is reasonable that ANKHD1 has the potential for membrane deformation and vesiculation. Our in vitro studies suggest that the ARD of ANKHD1 can produce liposome tubules and vesicles. The mutations with K1323E-K1324E or R1357E-K1358E, which were speculated to reduce the interaction with charged lipid PS, decreased the vesiculation ability. Deletion of the amphipathic helix was speculated to diminish the insertion of the amphipathic helix into the membrane, thereby decreasing membrane scission. Membrane scission for vesiculation appears independent of ATP or GTP hydrolysis, at least in vitro. There are several examples of membrane vesiculation by proteins without ATP or GTP in vitro. The BAR domain superfamily of proteins with amphipathic helices, including endophilin, vesiculates liposomes in vitro (Boucrot et al., 2012; Gallop et al., 2006), probably through mechanical force (Simunovic et al., 2017). ANKHD1 might vesiculate the membrane in combination with mechanical forces, including the force resulting from the flow of the medium in vitro and by intracellular motor proteins. In ANKHD1-knockdown cells, EEA1-positive early endosomes were increased, as evident from the amount of the EEA1 marker protein. However, the endosomal localization of ANKHD1 was unclear. If ANKHD1 mediated membrane scission, it is possible that endosomal ANKHD1 localization was limited. Partial colocalization of proteins with vesiculation potential to target organelles was reported for dynamin and ESCRT (Gautreau et al., 2014; Lee et al., 2016; Schiel et al., 2012). Early endosomes are associated with the continuous fusion of endocytic vesicles. The Rab5-positive endosomal tubules are generated after homotypic fusion of early endosomes (Skjeldal et al., 2012). Knockdown. 114. iScience 17, 101–118, July 26, 2019.
(16) Figure 8. ANKHD1 Regulates the Size and Number of Rab5-Positive Organelles through Vesiculation Ability (A) Amounts of endogenous ANKHD1 and expressed ANKHD1 in HeLa cells transfected with control siRNA + Venus33, ANKHD1 siRNA + Venus33, ANKHD1 siRNA + ANKHD1- Venus33, or ANKHD1 siRNA + ANKHD1- Venus33 with 4E+DAH (4E+DAH- Venus33) for rescue experiments by western blot. (B) Confocal microscopic images of expressed mCherry-Rab5Q79L in HeLa cells transfected with control siRNA + Venus33 + mCherry-Rab5Q79L, ANKHD1 siRNA + Venus33 + mCherry-Rab5Q79L, ANKHD1 siRNA + ANKHD1- Venus33 + mCherry-Rab5Q79L, or ANKHD1 siRNA + 4E+DAH- Venus33 + mCherryRab5Q79L for rescue experiments. Scale bars, 10 mm. (C and D) Quantification of the number (C) and average area (D) of mCherry-Rab5Q79L puncta per cell in (B). Data represent the mean of 23, 19, 16, and 19 cells from three independent experiments for control siRNA + Venus33, ANKHD1 siRNA + Venus33, ANKHD1 siRNA + ANKHD1- Venus33, and ANKHD1 siRNA + 4E+DAH- Venus33, respectively. All error bars represent SE. *p < 0.05, **p < 0.01, and ***p < 0.001. Statistical significance was determined using the Student’s t test. ns, not significant.. of ANKHD1 enlarged the Rab5Q79L-positive endosomes, indicating that ANKHD1 mediates its activity with activated Rab5. As the constitutive activation of Rab5 increases Rab5-positive endosomes, a further increase in endosomes induced by ANKHD1 downregulation indicated that ANKHD1 negatively regulates fusion-mediated enlargement of early endosomes. Early endosomes are vesiculated, and the vesicles are transported to the plasma membrane, trans-Golgi, and recycling endosomes. Rab5 is not localized to the budding compartment of early endosomes for any of these three components (Bonifacino and Rojas, 2006; Grant and Donaldson, 2009; Maxfield and McGraw, 2004; Naslavsky and Caplan, 2011; So¨nnichsen et al., 2000). In addition to such trafficking, early endosomes with Rab5 are converted into late endosomes with Rab7, which then fuse to form lysosomes (Rink et al., 2005). LysoTracker staining indicated that endosome maturation to late endosomes and lysosomes appeared unaffected because LysoTracker staining intensity was not significantly altered by ANKHD1 siRNA. iScience 17, 101–118, July 26, 2019. 115.
(17) treatment (Figure S8). Vesiculation of early endosomes by ANKHD1 is potentially involved in unknown trafficking pathways, which might be related to mitochondria owing to the downregulation of mitochondrial marker proteins (Figures 2K and 2L). Alternatively, because ANKHD1 did not perfectly colocalize with Rab5, vesicles generated by ANKHD1 are potentially involved in trafficking to recycling endosomes or plasma membrane, which contain a large amount of PS (Chen et al., 2010; Lee et al., 2015; Uchida et al., 2011; Xu et al., 2013). Some studies have reported interactions between the early endosome and mitochondria. The Hippo pathway provides a connection between ANKHD1 and mitochondria. Upon activation of the Hippo pathway, ANKHD1 is transferred into the cytosol (Sansores-Garcia et al., 2013; Sidor et al., 2013). In Drosophila, the loss of Mask, the homolog of human ANKHD1, induces mitophagy, a type of autophagy specific to the clearance of damaged mitochondria (Zhu et al., 2015). We observed a reduction in the number of mitochondria in ANKHD1-depleted cells, which might have been induced by mitophagy. Concurrently, endocytic proteins regulate the size of mitochondria by an indirect association with mitochondrial fission (Farmer et al., 2017), suggesting a potential ANKHD1-dependent vesicle transport from endosomes to mitochondria. Endosomal motility is reportedly affected by the interactions of endosomes with mitochondria (Das et al., 2016), thus indicating the site of ANKHD1 activity. Nonetheless, detailed functional mechanisms of action of intracellular ANKHD1 warrant further investigation.. Limitations of the Study We showed that the ARD of ANKHD1 vesiculated the liposomes into small vesicles in vitro. However, we could not examine the in vitro vesiculation ability of the full-length ANKHD1 because we could not successfully express and purify the protein; however, we expressed the wild-type and the vesiculation-deficient mutant of the full-length ANKHD1 protein in ANKHD1-siRNA-treated cells, confirming the vesiculation ability of the full-length protein. Furthermore, we used the reconstituted liposomes, which might not have the same lipids of early endosome. We observed early endosomes by immunofluorescence staining using anti-EEA1 and anti-Rab5 antibodies, which might not perfectly indicate the early endosomes because of limits in the antibody staining including background staining. In further studies, observation of early endosome and other organelles in the control cells and the ANKHD1-depleted cells by electron microscopy will improve the understanding of the function of ANKHD1.. METHODS All methods can be found in the accompanying Transparent Methods supplemental file.. SUPPLEMENTAL INFORMATION Supplemental Information can be found online at https://doi.org/10.1016/j.isci.2019.06.020.. ACKNOWLEDGMENTS We thank all the members of the laboratory for technical assistance and helpful discussions. This work was supported by grants from the Funding Program for Next-Generation World-Leading Researchers (NEXT program LS031), JSPS (KAKENHI 26291037, 15H0164, 15H05902, 17H03674, 17H06006, 17K19529), the Mitsubishi Foundation to S.S, and JSPS (KAKENHI 16K07351) to K.H.-S.. AUTHOR CONTRIBUTIONS M.K., K.H.-S., and K.M. performed the biochemical and cell biological analyses. S.S. supervised the project. M.K. and S.S. wrote the manuscript with input from all other authors.. DECLARATION OF INTERESTS The authors declare no competing interests.. Received: October 22, 2018 Revised: March 22, 2019 Accepted: June 12, 2019 Published: July 26, 2019. 116. iScience 17, 101–118, July 26, 2019.
(18) REFERENCES Boguski, M.S., and Schuler, G.D. (1995). ESTablishing a human transcript map. Nat. Genet. 10, 369–371. Bonifacino, J.S., and Rojas, R. (2006). Retrograde transport from endosomes to the trans-Golgi network. Nat. Rev. Mol. Cell Biol. 7, 568–579. Boucrot, E., Pick, A., C¸amdere, G., Liska, N., Evergren, E., McMahon, H.T., and Kozlov, M.M. (2012). Membrane fission is promoted by insertion of amphipathic helices and is restricted by crescent BAR domains. Cell 149, 124–136. Chen, B., Jiang, Y., Zeng, S., Yan, J., Li, X., Zhang, Y., Zou, W., and Wang, X. (2010). Endocytic sorting and recycling require membrane phosphatidylserine asymmetry maintained by TAT-1/CHAT-1. PLoS Genet. 6, e1001235. Das, A., Nag, S., Mason, A.B., and Barroso, M.M. (2016). Endosome-mitochondria interactions are modulated by iron release from transferrin. J. Cell Biol. 214, 831–845. Daumke, O., Roux, A., and Haucke, V. (2014). BAR domain scaffolds in dynamin-mediated membrane fission. Cell 156, 882–892. Evans, W.H., and Hardison, W.G. (1985). Phospholipid, cholesterol, polypeptide and glycoprotein composition of hepatic endosome subfractions. Biochem. J. 232, 33–36. Farmer, T., Reinecke, J.B., Xie, S., Bahl, K., Naslavsky, N., and Caplan, S. (2017). Control of mitochondrial homeostasis by endocytic regulatory proteins. J. Cell Sci. 130, 2359–2370. Friedman, J.R., Dibenedetto, J.R., West, M., Rowland, A.A., and Voeltz, G.K. (2013). Endoplasmic reticulum-endosome contact increases as endosomes traffic and mature. Mol. Biol. Cell 24, 1030–1040. Gallop, J.L., Jao, C.C., Kent, H.M., Butler, P.J., Evans, P.R., Langen, R., and McMahon, H.T. (2006). Mechanism of endophilin N-BAR domainmediated membrane curvature. EMBO J. 25, 2898–2910. Gautier, R., Douguet, D., Antonny, B., and Drin, G. (2008). HELIQUEST: a web server to screen sequences with specific alpha-helical properties. Bioinformatics 24, 2101–2102. Gautreau, A., Oguievetskaia, K., and Ungermann, C. (2014). Function and regulation of the endosomal fusion and fission machineries. Cold Spring Harb. Perspect. Biol. 6, a016832. Grant, B.D., and Donaldson, J.G. (2009). Pathways and mechanisms of endocytic recycling. Nat. Rev. Mol. Cell Biol. 10, 597–608. He, K., Marsland, R., III, Upadhyayula, S., Song, E., Dang, S., Capraro, B.R., Wang, W., Skillern, W., Gaudin, R., Ma, M., et al. (2017). Dynamics of phosphoinositide conversion in clathrinmediated endocytic traffic. Nature 552, 410–414. Horvath, S.E., and Daum, G. (2013). Lipids of mitochondria. Prog. Lipid Res. 52, 590–614. Huotari, J., and Helenius, A. (2011). Endosome maturation. EMBO J. 30, 3481–3500.. Jarsch, I.K., Daste, F., and Gallop, J.L. (2016). Membrane curvature in cell biology: an integration of molecular mechanisms. J. Cell Biol. 214, 375–387. Kanaji, S., Iwahashi, J., Kida, Y., Sakaguchi, M., and Mihara, K. (2000). Characterization of the signal that directs Tom20 to the mitochondrial outer membrane. J. Cell Biol. 151, 277–288. Keenan, T.W., and Morre´, D.J. (1970). Phospholipid class and fatty acid composition of golgi apparatus isolated from rat liver and comparison with other cell fractions. Biochemistry 9, 19–25. Kelley, L.A., Mezulis, S., Yates, C.M., Wass, M.N., and Sternberg, M.J. (2015). The Phyre2 web portal for protein modeling, prediction and analysis. Nat. Protoc. 10, 845–858. Kim, D.H., Park, M.J., Gwon, G.H., Silkov, A., Xu, Z.Y., Yang, E.C., Song, S., Song, K., Kim, Y., Yoon, H.S., et al. (2014). An ankyrin repeat domain of AKR2 drives chloroplast targeting through coincident binding of two chloroplast lipids. Dev. Cell 30, 598–609. Kobayashi, T., Stang, E., Fang, K.S., de Moerloose, P., Parton, R.G., and Gruenberg, J. (1998). A lipid associated with the antiphospholipid syndrome regulates endosome structure and function. Nature 392, 193–197. Lawe, D.C., Chawla, A., Merithew, E., Dumas, J., Carrington, W., Fogarty, K., Lifshitz, L., Tuft, R., Lambright, D., and Corvera, S. (2002). Sequential roles for phosphatidylinositol 3-phosphate and Rab5 in tethering and fusion of early endosomes via their interaction with EEA1. J. Biol. Chem. 277, 8611–8617. Lee, J.E., Westrate, L.M., Wu, H., Page, C., and Voeltz, G.K. (2016). Multiple dynamin family members collaborate to drive mitochondrial division. Nature 540, 139–143. Lee, M.C., Orci, L., Hamamoto, S., Futai, E., Ravazzola, M., and Schekman, R. (2005). Sar1p N-terminal helix initiates membrane curvature and completes the fission of a COPII vesicle. Cell 122, 605–617. Lee, S., Uchida, Y., Wang, J., Matsudaira, T., Nakagawa, T., Kishimoto, T., Mukai, K., Inaba, T., Kobayashi, T., Molday, R.S., et al. (2015). Transport through recycling endosomes requires EHD1 recruitment by a phosphatidylserine translocase. EMBO J. 34, 669–688. Letunic, I., and Bork, P. (2017). 20 years of the SMART protein domain annotation resource. Nucleic Acids Res. 46, D493–D496. Li, J., Mahajan, A., and Tsai, M.D. (2006). Ankyrin repeat: a unique motif mediating protein-protein interactions. Biochemistry 45, 15168–15178. Marquardt, D., Geier, B., and Pabst, G. (2015). Asymmetric lipid membranes: towards more realistic model systems. Membranes (Basel) 5, 180–196. Masuda, M., Takeda, S., Sone, M., Ohki, T., Mori, H., Kamioka, Y., and Mochizuki, N. (2006). Endophilin BAR domain drives membrane. curvature by two newly identified structure-based mechanisms. EMBO J. 25, 2889–2897. Mattila, J.P., Shnyrova, A.V., Sundborger, A.C., Hortelano, E.R., Fuhrmans, M., Neumann, S., Mu¨ller, M., Hinshaw, J.E., Schmid, S.L., and Frolov, V.A. (2015). A hemi-fission intermediate links two mechanistically distinct stages of membrane fission. Nature 524, 109–113. Maxfield, F.R., and McGraw, T.E. (2004). Endocytic recycling. Nat. Rev. Mol. Cell Biol. 5, 121–132. McNiven, M.A., and Thompson, H.M. (2006). Vesicle formation at the plasma membrane and trans-Golgi network: the same but different. Science 313, 1591–1594. Mosavi, L.K., Cammett, T.J., Desrosiers, D.C., and Peng, Z.Y. (2004). The ankyrin repeat as molecular architecture for protein recognition. Protein Sci. 13, 1435–1448. Murray, D.H., Jahnel, M., Lauer, J., Avellaneda, M.J., Brouilly, N., Cezanne, A., MoralesNavarrete, H., Perini, E.D., Ferguson, C., Lupas, A.N., et al. (2016). An endosomal tether undergoes an entropic collapse to bring vesicles together. Nature 537, 107–111. Nagai, T., Ibata, K., Park, E.S., Kubota, M., Mikoshiba, K., and Miyawaki, A. (2002). A variant of yellow fluorescent protein with fast and efficient maturation for cell-biological applications. Nat. Biotechnol. 20, 87–90. Nakamura, N., Rabouille, C., Watson, R., Nilsson, T., Hui, N., Slusarewicz, P., Kreis, T.E., and Warren, G. (1995). Characterization of a cis-Golgi matrix protein, GM130. J. Cell Biol. 131, 1715– 1726. Naslavsky, N., and Caplan, S. (2011). EHD proteins: key conductors of endocytic transport. Trends Cell Biol. 21, 122–131. Nishimura, T., Morone, N., and Suetsugu, S. (2018). Membrane re-modelling by BAR domain superfamily proteins via molecular and nonmolecular factors. Biochem. Soc. Trans. 46, 379–389. Paczkowski, J.E., and Fromme, J.C. (2014). Structural basis for membrane binding and remodeling by the exomer secretory vesicle cargo adaptor. Dev. Cell 30, 610–624. Personnic, N., Ba¨rlocher, K., Finsel, I., and Hilbi, H. (2016). Subversion of retrograde trafficking by translocated pathogen effectors. Trends Microbiol. 24, 450–462. Praefcke, G.J., and McMahon, H.T. (2004). The dynamin superfamily: universal membrane tubulation and fission molecules? Nat. Rev. Mol. Cell Biol. 5, 133–147. Rink, J., Ghigo, E., Kalaidzidis, Y., and Zerial, M. (2005). Rab conversion as a mechanism of progression from early to late endosomes. Cell 122, 735–749. Saftig, P., and Klumperman, J. (2009). Lysosome biogenesis and lysosomal membrane proteins: trafficking meets function. Nat. Rev. Mol. Cell Biol. 10, 623–635.. iScience 17, 101–118, July 26, 2019. 117.
(19) Sansores-Garcia, L., Atkins, M., Moya, I.M., Shahmoradgoli, M., Tao, C., Mills, G.B., and Halder, G. (2013). Mask is required for the activity of the Hippo pathway effector Yki/YAP. Curr. Biol. 23, 229–235. Schiel, J.A., Simon, G.C., Zaharris, C., Weisz, J., Castle, D., Wu, C.C., and Prekeris, R. (2012). FIP3endosome-dependent formation of the secondary ingression mediates ESCRT-III recruitment during cytokinesis. Nat. Cell Biol. 14, 1068–1078. Sidor, C.M., Brain, R., and Thompson, B.J. (2013). Mask proteins are cofactors of Yorkie/YAP in the Hippo pathway. Curr. Biol. 23, 223–228. Simunovic, M., Manneville, J.B., Renard, H.F., Evergren, E., Raghunathan, K., Bhatia, D., Kenworthy, A.K., Voth, G.A., Prost, J., McMahon, H.T., et al. (2017). Friction mediates scission of tubular membranes scaffolded by BAR proteins. Cell 170, 172–184.e11. Skjeldal, F.M., Strunze, S., Bergeland, T., Walseng, E., Gregers, T.F., and Bakke, O. (2012). The fusion of early endosomes induces molecular-motor-driven tubule formation and fission. J. Cell Sci. 125, 1910–1919. So¨nnichsen, B., De Renzis, S., Nielsen, E., Rietdorf, J., and Zerial, M. (2000). Distinct membrane domains on endosomes in the recycling pathway visualized by multicolor. 118. iScience 17, 101–118, July 26, 2019. imaging of Rab4, Rab5, and Rab11. J. Cell Biol. 149, 901–914.. subdomain of the endoplasmic reticulum. J. Cell Biol. 150, 1489–1498.. Suetsugu, S., Kurisu, S., and Takenawa, T. (2014). Dynamic shaping of cellular membranes by phospholipids and membrane-deforming proteins. Physiol. Rev. 94, 1219–1248.. Ward, J.J., Sodhi, J.S., McGuffin, L.J., Buxton, B.F., and Jones, D.T. (2004). Prediction and functional analysis of native disorder in proteins from the three kingdoms of life. J. Mol. Biol. 337, 635–645.. Takahashi, N., Hamada-Nakahara, S., Itoh, Y., Takemura, K., Shimada, A., Ueda, Y., Kitamata, M., Matsuoka, R., Hanawa-Suetsugu, K., Senju, Y., et al. (2014). TRPV4 channel activity is modulated by direct interaction of the ankyrin domain to PI(4,5)P2. Nat. Commun. 5, 4994. Uchida, Y., Hasegawa, J., Chinnapen, D., Inoue, T., Okazaki, S., Kato, R., Wakatsuki, S., Misaki, R., Koike, M., Uchiyama, Y., et al. (2011). Intracellular phosphatidylserine is essential for retrograde membrane traffic through endosomes. Proc. Natl. Acad. Sci. U S A 108, 15846–15851. van Meer, G., Voelker, D.R., and Feigenson, G.W. (2008). Membrane lipids: where they are and how they behave. Nat. Rev. Mol. Cell Biol. 9, 112–124. Wang, C., Wei, Z., Chen, K., Ye, F., Yu, C., Bennett, V., and Zhang, M. (2014). Structural basis of diverse membrane target recognitions by ankyrins. Elife 3, e04353. Wang, H.J., Guay, G., Pogan, L., Sauve´, R., and Nabi, I.R. (2000). Calcium regulates the association between mitochondria and a smooth. Wollert, T., Wunder, C., Lippincott-Schwartz, J., and Hurley, J.H. (2009). Membrane scission by the ESCRT-III complex. Nature 458, 172–177. Wolter, K.G., Hsu, Y.T., Smith, C.L., Nechushtan, A., Xi, X.G., and Youle, R.J. (1997). Movement of Bax from the cytosol to mitochondria during apoptosis. J. Cell Biol. 139, 1281–1292. Xu, P., Baldridge, R.D., Chi, R.J., Burd, C.G., and Graham, T.R. (2013). Phosphatidylserine flipping enhances membrane curvature and negative charge required for vesicular transport. J. Cell Biol. 202, 875–886. Zhu, M., Li, X., Tian, X., and Wu, C. (2015). Mask loss-of-function rescues mitochondrial impairment and muscle degeneration of Drosophila pink1 and parkin mutants. Hum. Mol. Genet. 24, 3272–3285. Zoncu, R., Perera, R.M., Balkin, D.M., Pirruccello, M., Toomre, D., and De Camilli, P. (2009). A phosphoinositide switch controls the maturation and signaling properties of APPL endosomes. Cell 136, 1110–1121..
(20) ISCI, Volume 17. Supplemental Information. Membrane-Deformation Ability of ANKHD1 Is Involved in the Early Endosome Enlargement Manabu Kitamata, Kyoko Hanawa-Suetsugu, Kohei Maruyama, and Shiro Suetsugu.
(21) Transparent Methods Antibodies The following antibodies were used: rabbit anti-GFP antibody (MBL Life Science, 598), rabbit anti-ANKHD1 antibody (Atlas Antibodies, HPA008718), mouse anti-EEA1 antibody (BD Biosciences, 610456), rabbit anti-EEA1 (Cell Signaling Technology, 3288), mouse anti-GAPDH antibody (Santa Cruz Biotechnology, sc-166574), mouse anti-GM130 antibody (BD Biosciences, 610822), mouse anti-Bcl-2 antibody (BD Biosciences, 610538), mouse anti-Calnexin antibody (Santa Cruz Biotechnology, sc23954), mouse anti-mCherry antibody (Novus, NBP1-96752), mouse anti-Rab5 antibody (Santa Cruz Biotechnology, sc-46692), mouse anti-LAMP1 antibody (Santa Cruz Biotechnology, sc-20011), and mouse anti-Tom20 antibody (Santa Cruz Biotechnology, sc-17764). Plasmids Glutathione S-transferase (GST)-tagged human ANKHD1 fragments of 195–1418 aa (ARD25) were amplified by PCR using the following primers: 5’GAAGATCTGCAGAAAACAGCCACAATG-3’ and 5’GAAGATCTTTAGTCTTTAGCCTTCACAATG-3’. They were then inserted into the pCold vector (TaKaRa Bio) at the BamH1 restriction site. To prepare the pVenus×3 vector, EGFP in the pEGFP-N3 vector was replaced with Venus×3. The vector backbone of the pEGFP-N3 vector was amplified by the following primers: 5’-TAAAGCGGCCGCGACTCTAG-3' and 5’GGTGGCGATGGATCCCGGG-3’. Each Venus cDNA was amplified by the following primers: 5’-CCGGGATCCATCGCCACCATGGTGAGCAAGGGCGAG-3’ and 5’GGCAGATCTGAGTCCGGACTTGTACAGCTCGTCCATG -3’. 5’- TCCGGACTCAGATCTGCCACCGCGGTGAGCAAGGGCGAGGAG3’ and 5’-CGCGGTGGCGATGGATCCGCTCTTGTACAGCTCGTCCATGC-3’. 5’-GCGGATCCATCGCCACCGCGGTGAGCAAGGGCGAGGAGC-3’ and 5’-CTAGAGTCGCGGCCGCTTTACTTGTACAGCTCGTCCATGC-3’. These four fragments were assembled using the Gibson Assembly Master Mix (New England BioLabs)..
(22) The pVenus×3-ANKHD1 plasmid was prepared by assembly using Gibson Assembly Master Mix. The five cDNA fragments included cDNA of full-length ANKHD1, three Venus cDNAs, and the backbone of pEGFP-N3 vector. The backbone of pEGFP-N3 vector was amplified by PCR with the primers: 5’TAAAGCGGCCGCGACTCTAG-3’ and 5’ATCAGTCAGCATGGTGGCAGATCTGAGTCCGGTAGCGC-3’. The three Venus sequences were amplified by PCR with the following primers: 5’TCTCAAATATGTCAACAGCGGATCCATCGCCACCGCGGTGAGCAAGGGCG-3’ and 5’-GGCAGATCTGAGTCCGGACTTGTACAGCTCGTCCATG-3’, 5’TCCGGACTCAGATCTGCCACCGCGGTGAGCAAGGGCGAGGAG-3’ and 5’CGCGGTGGCGATGGATCCGCTCTTGTACAGCTCGTCCATGC-3’, 5’AGCGGATCCATCGCCACCGCGGTGAGCAAGGGCGAGGAGC-3’ and 5’CTAGAGTCGCGGCCGCTTTACTTGTACAGCTCGTCCATGC-3’. The ANKHD1 cDNA was amplified by PCR with the following primers: 5’GAAGATCTGCCACCATGCTGACTGATAGCGGAGG and GAAGATCTGTTGACATATTTGAGATGC-3’. The amplified cDNA sequence was inserted into the pMD20-T vector using Mighty TA-cloning Kit (TaKaRa Bio) and then extracted by BglII digestion. To prepare the siRNA resistant constructions of ANKHD1, five silent mutations were induced in each target sequence of three siRNAs: 5′GGTGGAAACAGCGACTCTGATAAC-3′, 5′GTGACACCCAACTCTTTGTCCACCAG-3′, and 5′AGCAGCTGTGCGTGACAAACACCCGG-3′. Protein purification Plasmids for expression of GST-fused protein were transformed into Rosetta2 cells (Novagen). The cells were cultured in Luria broth (LB) medium at 37°C, and the proteins were overexpressed using 1 mM isopropyl β-D-1-thiogalactopyranoside overnight at 12°C. The cells were collected and then lysed in a buffer containing 10 mM Tris-HCl (pH 7.5), 150 mM NaCl, 1 mM EDTA, 0.5% Triton X-100 (8 mM), 2 mM 2mercaptoethanol, and 1 mM phenylmethylsulfonyl fluoride using an ultrasonic.
(23) homogenizer. The lysate was centrifuged and the supernatant was incubated with the glutathione-sepharose 4B beads. The beads were washed four times using approximately 10-fold dilutions in 10 mM Tris-HCl (pH 7.5), 150 mM NaCl, 1 mM EDTA, and 1 mM dithiothreitol (DTT), and protein was collected by cleavage from the GST tag by precision protease at 4°C overnight. Preparation of liposomes PC (Sigma-Aldrich, P3841), PE (Sigma-Aldrich, P7693), PS (Sigma-Aldrich P5660), and porcine brain Folch fractions (Avanti) were dissolved in chloroform and mixed using defined weigh ratios to 0.2 mg/ml concentration of total lipid. Rhodamine-PE (Avanti, 810150) was incorporated at 0.2%. The lipids were dried under nitrogen gas and subsequently maintained under vacuum for 20 min to remove residual chloroform. The dried lipids were suspended in buffer containing 10 mM Tris-HCl (pH 7.5), 150 mM NaCl, and 1 mM EDTA and then incubated for 1 hr at 37°C. In Figure S10, liposomes were extruded 11 times with 800 nm polycarbonate filters using an extruder (Avanti). Liposome sedimentation assay The protein aggregates were removed by ultracentrifugation before incubation with liposomes. The prepared liposomes (0.2 mg/ml) were incubated with the proteins in buffer containing 10 mM Tris-HCL (pH 7.5), 150 mM NaCl, 1 mM EDTA, and 0.5 mM DTT for 30 min at room temperature. After incubation, these reaction solutions were centrifuged at 109000 × g for 20 min to examine the vesiculation and at 245000× g for 20 min to examine the membrane binding at room temperature in a TLA-100 rotor (Beckman). The supernatant and the pellet fractions were separated, and SDS-PAGE sample buffer was added into these fractions to the same volume, and then analyzed by SDS-PAGE. The fluorescence of rhodamine-PE was measured using an FLA-8000 fluorescence image analyzer (Fuji-Film). The band intensities were quantified by ImageJ software. Electron microscopy Proteins were incubated with liposomes (0.2 mg/ml) prepared as described above in a.
(24) buffer containing 10 mM Tris-HCl (pH 7.5), 150 mM NaCl, and 1 mM EDTA. After incubation for 20 min at 25°C, a formvar-coated grid was put on the reaction mixture, washed with 100 mM HEPES (pH 7.5), and then stained with 0.5% uranyl acetate for 30 s. The grid was observed by transmission electron micrography using a model H7100 microscope (Hitachi). Crosslinking analysis Proteins were incubated with or without liposomes (0.2 mg/ml) in buffer containing 10 mM HEPES (pH 8.0), 150 mM NaCl, 1 mM EDTA, and 0.5 mM DTT for 30 min at room temperature. The mix solution was incubated with BS(PEG)5 (Thermo Fisher Scientific, 21581) for 30 min at room temperature. The reaction was quenched by adding SDS-PAGE sample buffer and then analyzed by SDS-PAGE. Transfection and siRNA treatment HeLa, HEK293T, Caki-1, U2OS, and DLD1 cells were cultured in Dulbecco’s modified Eagle’s medium containing 10% fetal bovine serum with penicillin and streptomycin at 37°C in an atmosphere of 5% CO2. One day before transfection, 5×10⁴ cells were seeded in wells of 6-well dishes. The cells were transfected using Lipofectamine 3000 (Invitrogen). After 24 hr of transfection, the cells were analyzed. Knockdown of ANKHD1 was performed with stealth RNAi (Invitrogen). The siRNA sequences were 5’-CAGGUGGGAAUAGUGAUUCAGAUAA-3’, 5’GAAGUGACUCCUAAUUCCUUGUCAA-3’, and 5’CAGUCAGCAACUGUGUGUCACUAAU-3’. These siRNAs were mixed and transfected using Lipofectamine 3000. The stealth RNAi siRNA Negative Control (Invitrogen) was also transfected as a control. One day before transfection of siRNA, 5×10⁴ cells were seeded in wells of 6-well dishes, and then siRNA was transfected into the cells. After 48 hr of transfection, the cells were analyzed. Immunostaining HeLa cells were fixed in 4% paraformaldehyde for 10 min, permeabilized in a buffer containing 0.1% Triton X-100, 50 mM Tris-HCl (pH 7.5), and 100 mM NaCl for 10 min, and then blocked in 1% bovine serum albumin, 50 mM Tris-HCl (pH 7.5), and 100.
(25) mM NaCl for 1 hr. The cells were incubated with primary antibody in buffer containing 1% BSA, 50 mM Tris-HCl (pH 7.5), and 100 mM NaCl for 1 hr. After washing with PBS, the cells were incubated with secondary antibodies conjugated with Alexa Fluor 488 and 568 in buffer containing 1% BSA, 50 mM Tris-HCl (pH 7.5), and 100 mM NaCl for 1 hr. The cells were washed using PBS and mounted in ProLong Diamond Antifade Mountant (Invitrogen). All fluorescence images were acquired by confocal microscopy (FV1000D, Olympus). A 100× immersion objective lens (NA 1.40, Olympus) was used for live cell and fixed cell imaging. Z-stack images were captured at 0.4 µm intervals. Live cell imaging Mitochondria were stained with 200 nM Mitotracker Red CM-H2Xros (Molecular Probes, M7513) at 37°C in an atmosphere of 5% CO2 for 45 min. Lysosomes were stained using 75 nM Lysotracker Red DND-99 (Molecular Probes, L7528) at 37°C in an atmosphere of 5% CO2 for 1 hr. Live cells were observed by confocal microscopy at 37°C in the 5% CO2 atmosphere. Quantification of organelle area The number of puncta, average area, and total area of organelles per cell were calculated from images with the focal plane in the vicinity of coverslips, where the area of the cell is the largest, using ImageJ software. Images of the organelles were converted into binary images and set in equal thresholds in each experiment. Then, the minimal particles size was set to 0.04 µm2 and evaluated by the Analyze Particles function in the ImageJ software. Quantification of colocalization in cells The percentages of colocalization per cell in Figure 3, Figure S6, and Figure S7 were calculated using the Colocalization Threshold function in the ImageJ software. Colocalization represented the overlap with green and red channel intensities above a threshold and indicates the pixels that have both channels. The percentages of colocalization were calculated as the number of pixels that had both channels / total number of pixels of each channel. Fluorescence images were set in equal thresholds in.
(26) each experiment. Statistical analysis Statistical differences were analyzed using paired two tailed Student’s t-test in Figure 1, Figure 2B, Figure 5, Figure 6, Figure 7B, Figure S4, Figure S6B and Figure S10. Unpaired two tailed Student’s t-test were performed in Figures 2D-2E, Figures 2G-2H, Figure 2J, Figure 2L, Figure 3, Figure 4, Figures 7D-7F, Figure 8, Figure S5, Figures S6D-S6H, Figure S8, and Figure S9. P-values and the number of repeated experiments are described in the figures and figure legends. All error bars represent standard error..
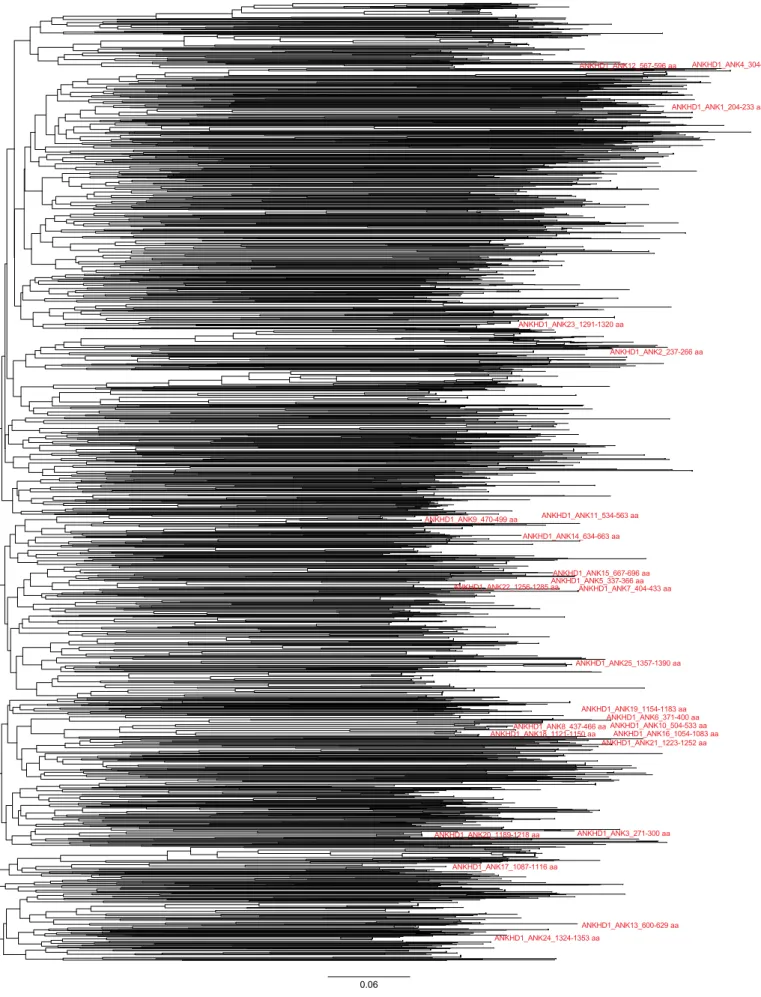
(27) Supplemental Figure Legends. Figure S1. Domain structure of 18 ARDs containing fragments and these EST frequencies, Related to Figure 1. (A) Illustration of the ankyrin repeat proteins. The 18 ARD fragments, surrounded by red lines, were used in Figure 1. (B) Average EST frequencies (TPM: Transcripts per million) of 18 ARDs containing fragments among 78 organs/health states/developmental stages in the Unigene database (https://www.ncbi.nlm.nih.gov/unigene). Figure S2. Phylogenetic tree of ankyrin repeats from human 18 ARD proteins, Related to Figure 1. Phylogenetic tree of ankyrin repeats from human 18 ARD proteins is shown. The amino acid sequences of the ankyrin repeats within each protein are compared in the highly transcribed human 18 ARD proteins (Figure S1). Red and blue indicate ANKHD1 and ANKRD17, respectively. Figure S3. Phylogenetic tree of ankyrin repeats from all human proteins, Related to Figure 1. Phylogenetic tree of ankyrin repeats of all human proteins from SMART (http://smart.embl-heidelberg.de) is shown. The amino acid sequences of ankyrin repeats within each protein are compared in all human proteins. Red indicates ANKHD1. The names of proteins other than ANKHD1 are not shown. Figure S4. Localization of ANKHD1 on EEA1-positive early endosomes in HEK293T, Caki-1, U2OS, and DLD1 and increased EEA1-positive early endosomes in ANKHD1-depleted cells, Related to Figure 2 and Figure 3. (A) Effects of ANKHD1 knockdown on the levels of endogenous EEA1 in HEK293T, Caki-1, U2OS, and DLD1 cells treated with control or ANKHD1 siRNA. The wholecell lysates were subjected to western blotting with anti-EEA1 antibody. GAPDH was examined as the loading control. Data represent the mean of four independent experiments. Error bars represent SE. *P < 0.05 and **P < 0.01. Statistical significance.
(28) was determined with the Student’s t-test. (B) Confocal microscopy images of endogenous ANKHD1 (green) and EEA1 (red) in HEK293T, Caki-1, U2OS, and DLD1 cells. Arrows indicate colocalization of endogenous ANKHD1 and EEA1. Scale bars, 10 µm. Scale bars in magnification, 2 µm. Figure S5. The total area and number of EEA1-positive early endosomes at each focal plane in HeLa cells, Related to Figure 2. (A) The z-stack images of EEA1 in HeLa cells. The lower panel shows the z section at the yellow line at the upper panel. The z-stack images were taken at 0.4 µm intervals for the measurement of EEA1 puncta in each focal plane. At the lower panel, the z axis was enlarged five times. (B-C) The total area (B) and the number (C) of EEA1 puncta per cell in each focal plane were measured by ImageJ software. Confocal slices were taken at 0.4 µm intervals. Data represent the mean of 14 cells. All error bars represent SE. *P < 0.05, **P < 0.01, and ***P < 0.001. Statistical significance was determined with the Student’s t-test. Figure S6. Knockdown of ANKHD1 increases the size of Rab5-positive organelles and the co-localization of Rab5 with EEA1, Related to Figure 2. (A) Amounts of endogenous Rab5 in HeLa cells treated with control or ANKHD1 siRNA by western blotting. (B) Quantification of Rab5 in (A). Data represent the mean of five independent experiments. (C) Confocal microscopy analysis of endogenous Rab5 in HeLa cells treated with control or ANKHD1 siRNA by immunostaining. (D-G) The total area (D), the number (E), the size distribution (F), and the average area (G) of Rab5 puncta per cell in (C) were measured by ImageJ software. Data represent the mean of 30 cells from three independent experiments for control siRNA and ANKHD1 siRNA. (H) Colocalization percentages of endogenous Rab5 with endogenous EEA1 in ANKHD1-depleted cells. Date represent the mean of 7 and 8 cells for control siRNA and ANKHD1 siRNA, respectively. All error bars represent SE. *P < 0.05, **P < 0.01, and ***P < 0.001. Statistical.
(29) significance was determined with the Student’s t-test. ns, not significant. Scale bars, 10 µm. Scale bars in magnification, 2 µm Figure S7. Localization of ANKHD1 in various organelles, Related to Figure 3. (A) Confocal microscopy images of endogenous ANKHD1 (green) and Rab5 (red) in HeLa cells. The rectangle in the upper image shows the region of enlargement in the lower images. (B) Confocal microscopy images of endogenous ANKHD1 (green) and LAMP1 (red) in HeLa cells. (C) Confocal microscopy images of endogenous ANKHD1 (green) and GM130 (red) in HeLa cells. (D) Confocal microscopy images of endogenous ANKHD1 (green) and Calnexin (red) in HeLa cells. (E) Confocal microscopy images of endogenous ANKHD1 (green) and Tom20 (red) in HeLa cells. (F) Colocalization percentages of endogenous ANKHD1 with Rab5, LAMP1, GM130, Calnexin, or Tom20 per cell in (A-E) calculated using ImageJ software. Data represent the means of 10 (A), 10 (B), 13 (C), 15 (D), and 12 (E) cells. Error bars represent SE. Scale bars, 10 µm. Scale bars in magnification, 2 µm. Figure S8. Knockdown of ANKHD1 does not affect maturation of early endosomes to lysosomes, Related to Figure 2. (A) Lysosome morphology stained with Lysotracker was observed in HeLa cells treated with control or ANKHD1 siRNA. (B-D) Quantification of (B) the number, (C) the average area, and (D) the total area of lysosomes per cell in (A). Data represent the means of 26 and 25 cells from three independent experiments for control siRNA and ANKHD1 siRNA, respectively. All error bars represent SE. Statistical significance was determined with the Student’s ttest. ns, not significant. Scale bars, 10 µm. Figure S9. Effect of ANKHD1 fragments on the total area of organelles, Related to Figure 5..
(30) (A) Amounts of expressed ANKHD1 fragments in HeLa cells expressing EGFP, N+ARD15-EGFP, ARD10-EGFP, N+ARD25-EGFP, ARD25-EGFP, or ANKHD1EGFP by western blotting. (B) Confocal microscopy images of expressed ANKHD1 fragments and endogenous EEA1 in HeLa cells expressing EGFP, N+ARD15-EGFP, N+ARD25-EGFP, ARD25EGFP, or ANKHD1-EGFP. (C-D) The total area (C) and the number (D) of EEA1 puncta per cell in (B) was measured using ImageJ software. Data represent the mean of 25, 26, 25, 24, and 26 cells from three independent experiments for EGFP, N+ARD15-EGFP, N+ARD25-EGFP, ARD25-EGFP, and ANKHD1-EGFP, respectively. (E) Confocal microscopy analysis of endogenous Calnexin in HeLa cells expressing EGFP or N+ARD25-EGFP. (F) The total area of Calnexin staining per cell in (E) was measured as in (C). Data represent the mean of 22 cells from three independent experiments for EGFP and N+ARD25-EGFP. (G) Confocal microscopy analysis of mitochondria stained with Mitotracker in HeLa cells expressing EGFP or N+ARD25-EGFP. (H) The total area of Mitotracker staining per cell in (G) was measured as in (C). Data represent the mean of 22 and 21 cells from three independent experiments for EGFP and N+ARD25-EGFP, respectively. (I) Confocal microscopy analysis of endogenous GM130 in HeLa cells expressing EGFP or N+ARD25-EGFP. (J-K) The total area (J) of GM130 staining measured as in (C) and the number of Golgi fragments (K) per cell in (I) are shown. Data represent the mean of 22 cells from three independent experiments for EGFP and N+ARD25-EGFP. All error bars represent SE. *P < 0.05 and **P < 0.01. Statistical significance was determined using the Student’s t-test. ns, not significant. Scale bars, 10 µm Figure S10. Vesiculation ability of ANKHD1 in filtered liposome and unfiltered liposome is not different, Related to Figure 6. (A) Vesiculation by liposome sedimentation assay for N+ARD25 with liposomes extruded through a filter of 800 nm and liposomes without extrusion. Protein.
図
+2
関連したドキュメント
This movement requires a greater ability to balance than other step tests because subjects must return from an altered center of gravity to the original position without continuing
Endogenous muscle atrophy F-box is involved in the development of cardiac rupture after myocardial infarction. Muscle-specific RING finger 1 negatively regulates pathological
Habiro con- siders an abelian group A k (H) dened by unitrivalent graphs with k trivalent vertices and with univalent vertices labelled by elements of H , subject to anti- symmetry,
Standard domino tableaux have already been considered by many authors [33], [6], [34], [8], [1], but, to the best of our knowledge, the expression of the
In this section we generalize some of the results of Sommers [16] on bounded dominant regions of Cat and positive filters in + to bounded dominant regions of A m and
An example of a database state in the lextensive category of finite sets, for the EA sketch of our school data specification is provided by any database which models the
The edges terminating in a correspond to the generators, i.e., the south-west cor- ners of the respective Ferrers diagram, whereas the edges originating in a correspond to the
We derive rigorously a homogenized model for the displacement of one compressible miscible fluid by another in a partially fractured porous reservoir.. We denote by the
